First look at FFIV

F5 Networks sits at the apex of a great looking rally, but what are the odds that we see another leg higher? Let's dig into the data.

Happy Friday! As markets grind higher, I was looking through the results of my scanner on StockCharts and stumbled upon F5 Networks, Inc (FFIV). I remember working with their devices early on in my career when the were the go-to company for anyone handling large web traffic loads, especially encrypted traffic. F5 devices were top of the line.
Their offerings have expanded vastly since then and they offer new products in the cloud as well as managed services. Let's dig into the recent price action to see what traders think about FFIV.
All investments come with significant risks, including the loss of all capital. Please do your own research before investing, and never risk more than you are willing to lose. I hold no certifications or registrations with any financial entity.
On to the charts! 🚀
Relative strength
One of my first stops when looking at any new ticker is the relative strength chart. Let's start there and work top to bottom through the indicators:
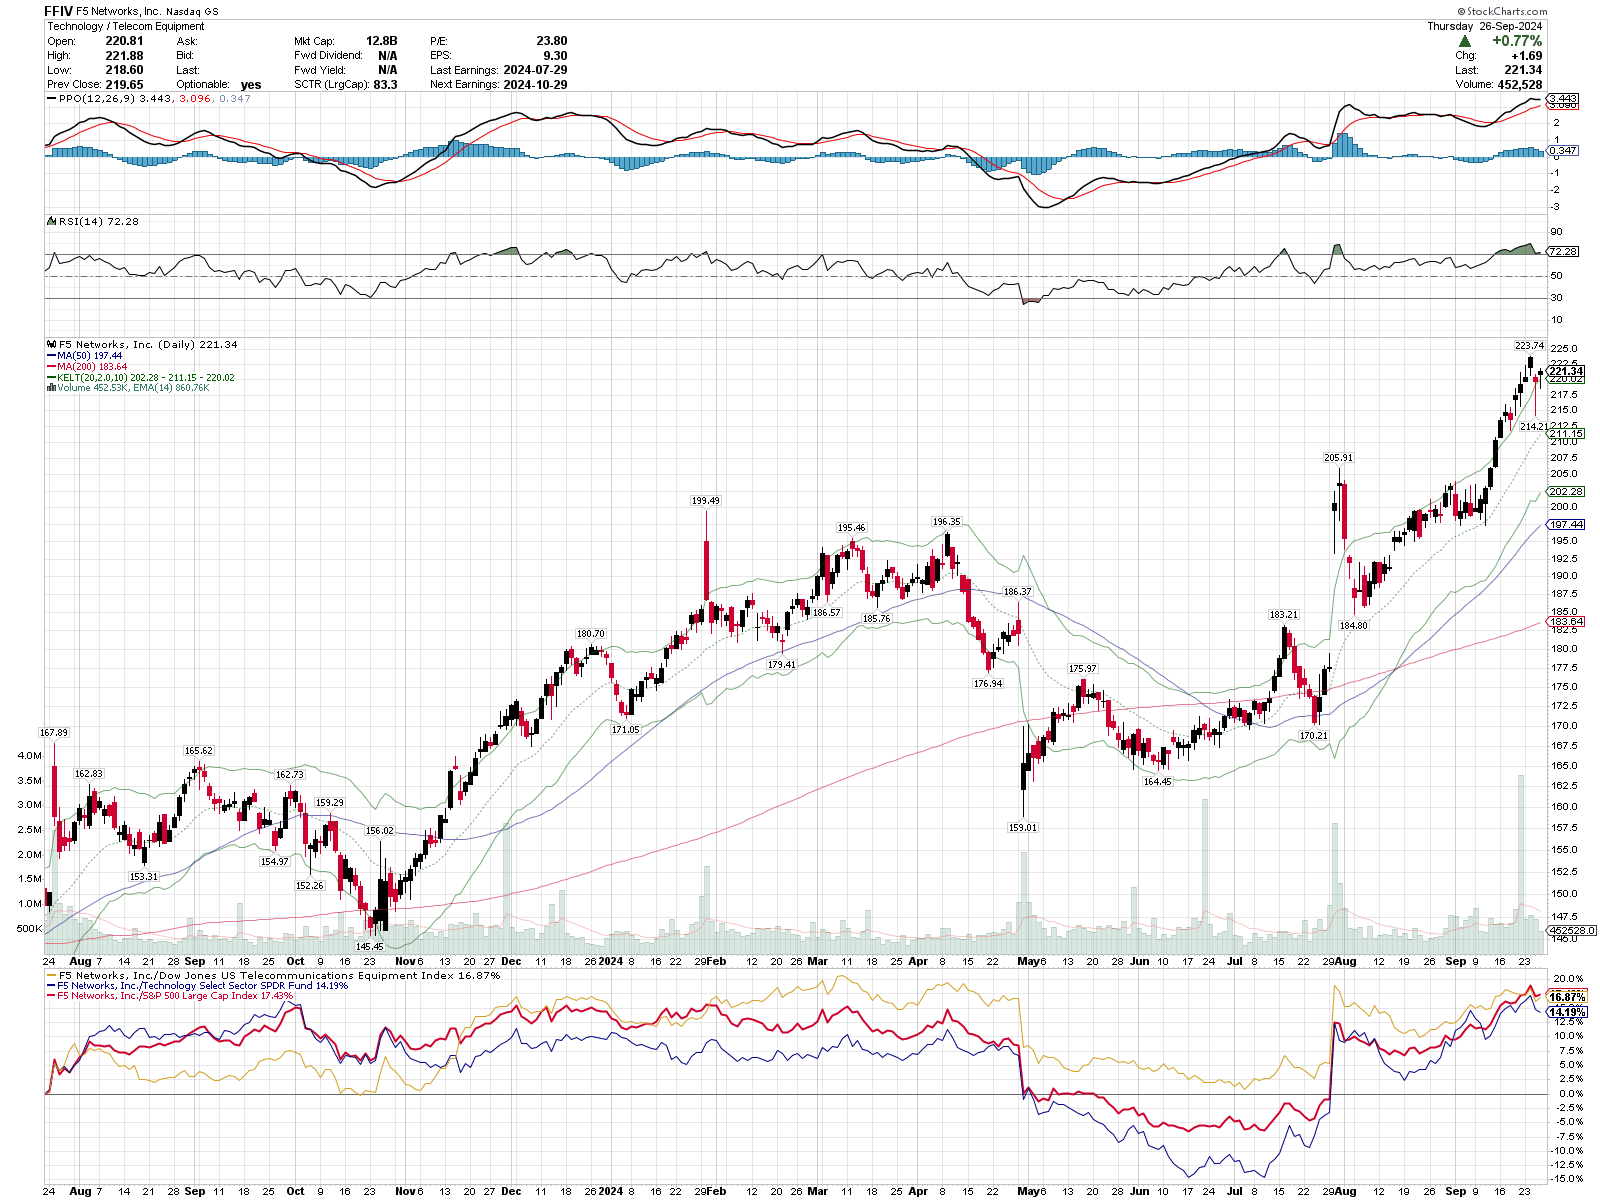
- The PPO indicator is above the zero line and the momentum line (black) is above the signal line (red). This is generally bullish and it looks like the door is open for a "pinch play" where the momentum line approaches the signal line very closely (the "pinch") and then bounces off again.
- Below the PPO is the RSI, which sits just above 70. Most would yell "it's oversold!" at this point, but to me, this is a sign of strength. FFIV crossed into the top half of the RSI band back in July and hasn't gone below for any meaningful amount of time since then.
- On the price chart, look at the most recent set of candlesticks with long bottom wicks. That's a signal to me that traders tried to push the price down, but buyers showed up and pushed price right back up to the highs of the day. The candlesticks sit just outside the Keltner channels and that's a sign of a very strong uptrend. These rallies eventually need a break and they go back into the channel.
- Price is well above the 50 and 200 day moving averages and both of those lines are tilted upwards.
- Finally, the relative strength lines at the bottom show a definite strength change beginning in late August. These lines examine FFIV's price movements relative to its Dow Jones Index, S&P 500 sector (XLK), and the S&P 500 index itself. FFIV's strength has led those indexes for most of the year and then it took a hit in May. It regained the old strength level at the end of July.
FFIV appears to have plenty of strength behind it even though it may be a little over extended. I'd love to see some consolidation at the current level before another move higher.
Trend strength
If you combine ADX and PPO together, you can estimate the strength of a trend. Let's start with a long term monthly view since 1999:
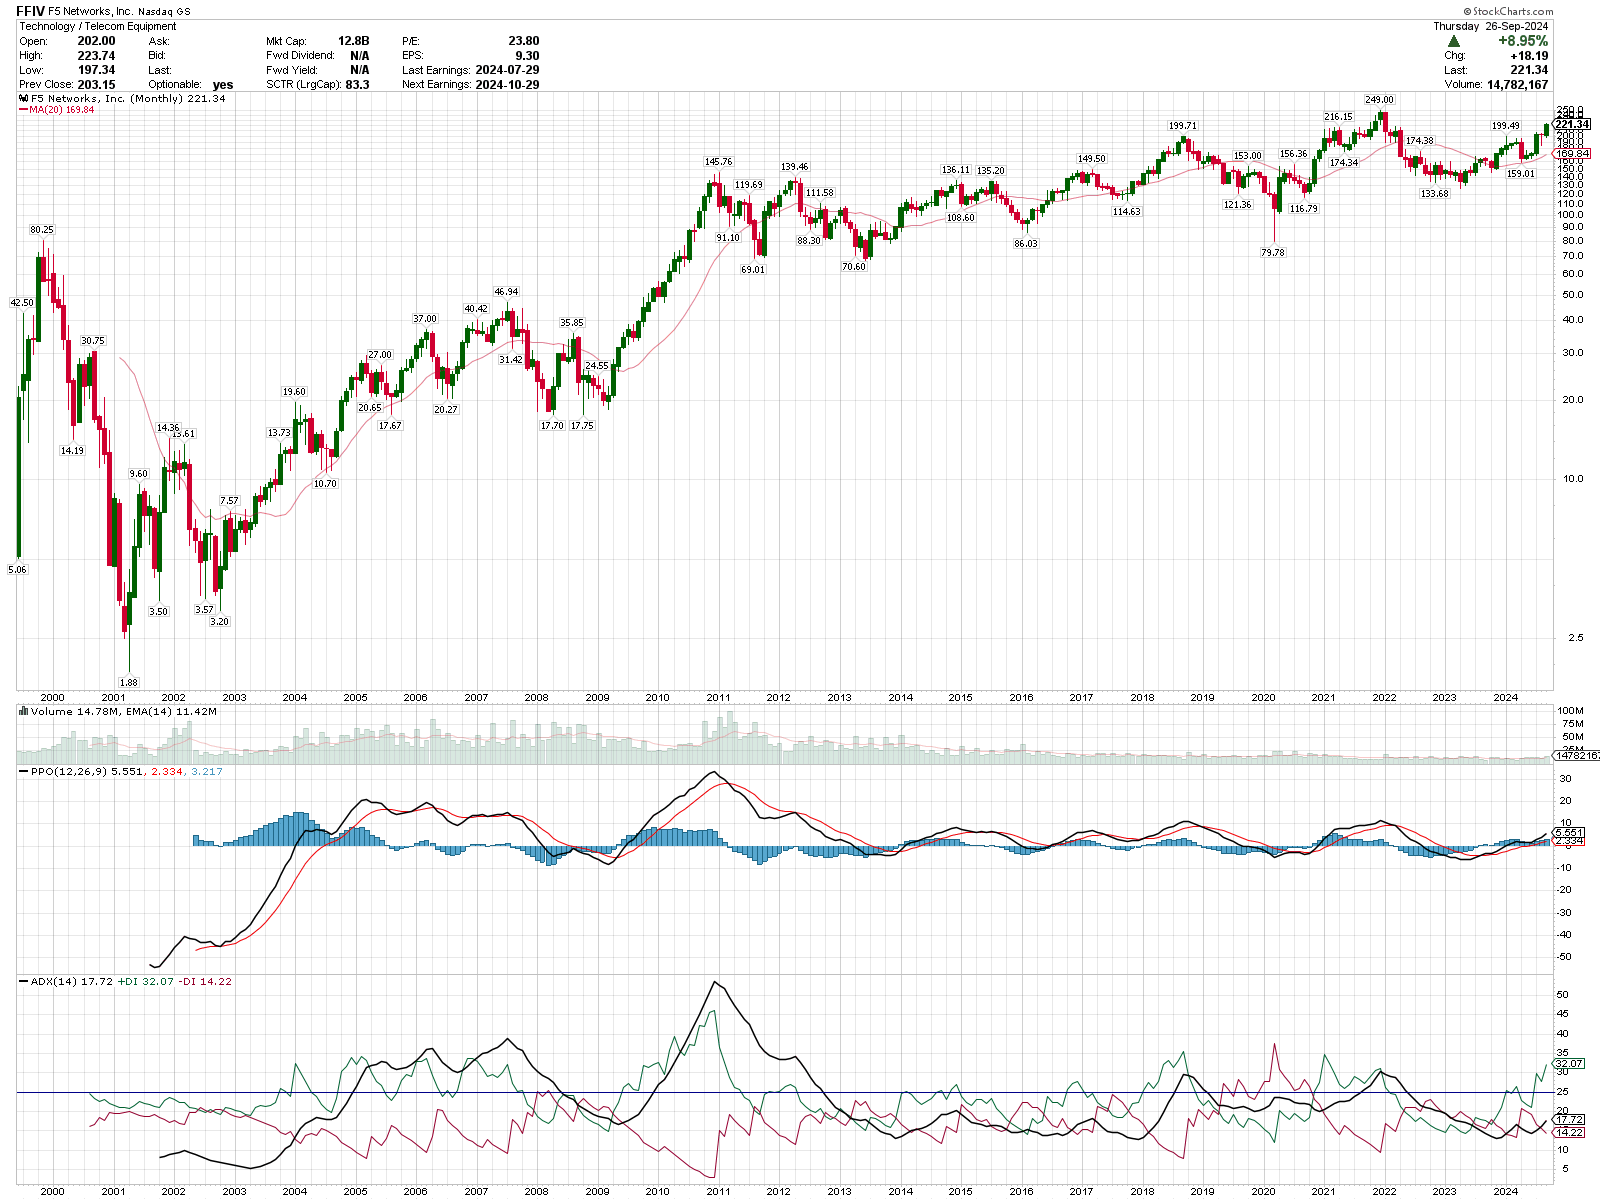
On the monthly, we have a PPO that just moved above the zero line recently and our ADX indicator shows that bulls have been mostly in control since late 2023. Note that the green ADX line (the +DI line) is above the red line (the -DI line). Buying is intensifying rapidly and selling is trailing off.
The black line is a combination of both lines and it tells us the strength of the current trend. The black line sits just under 18 today. An ADX of 20-25 makes me think we might have a trend. Anything over 25 gives me good confidence that a strong trend is underway. The monthly chart is pushing into the maybe zone for me but it isn't there yet.
Let's drop to a weekly time frame and see if we can get more context there:
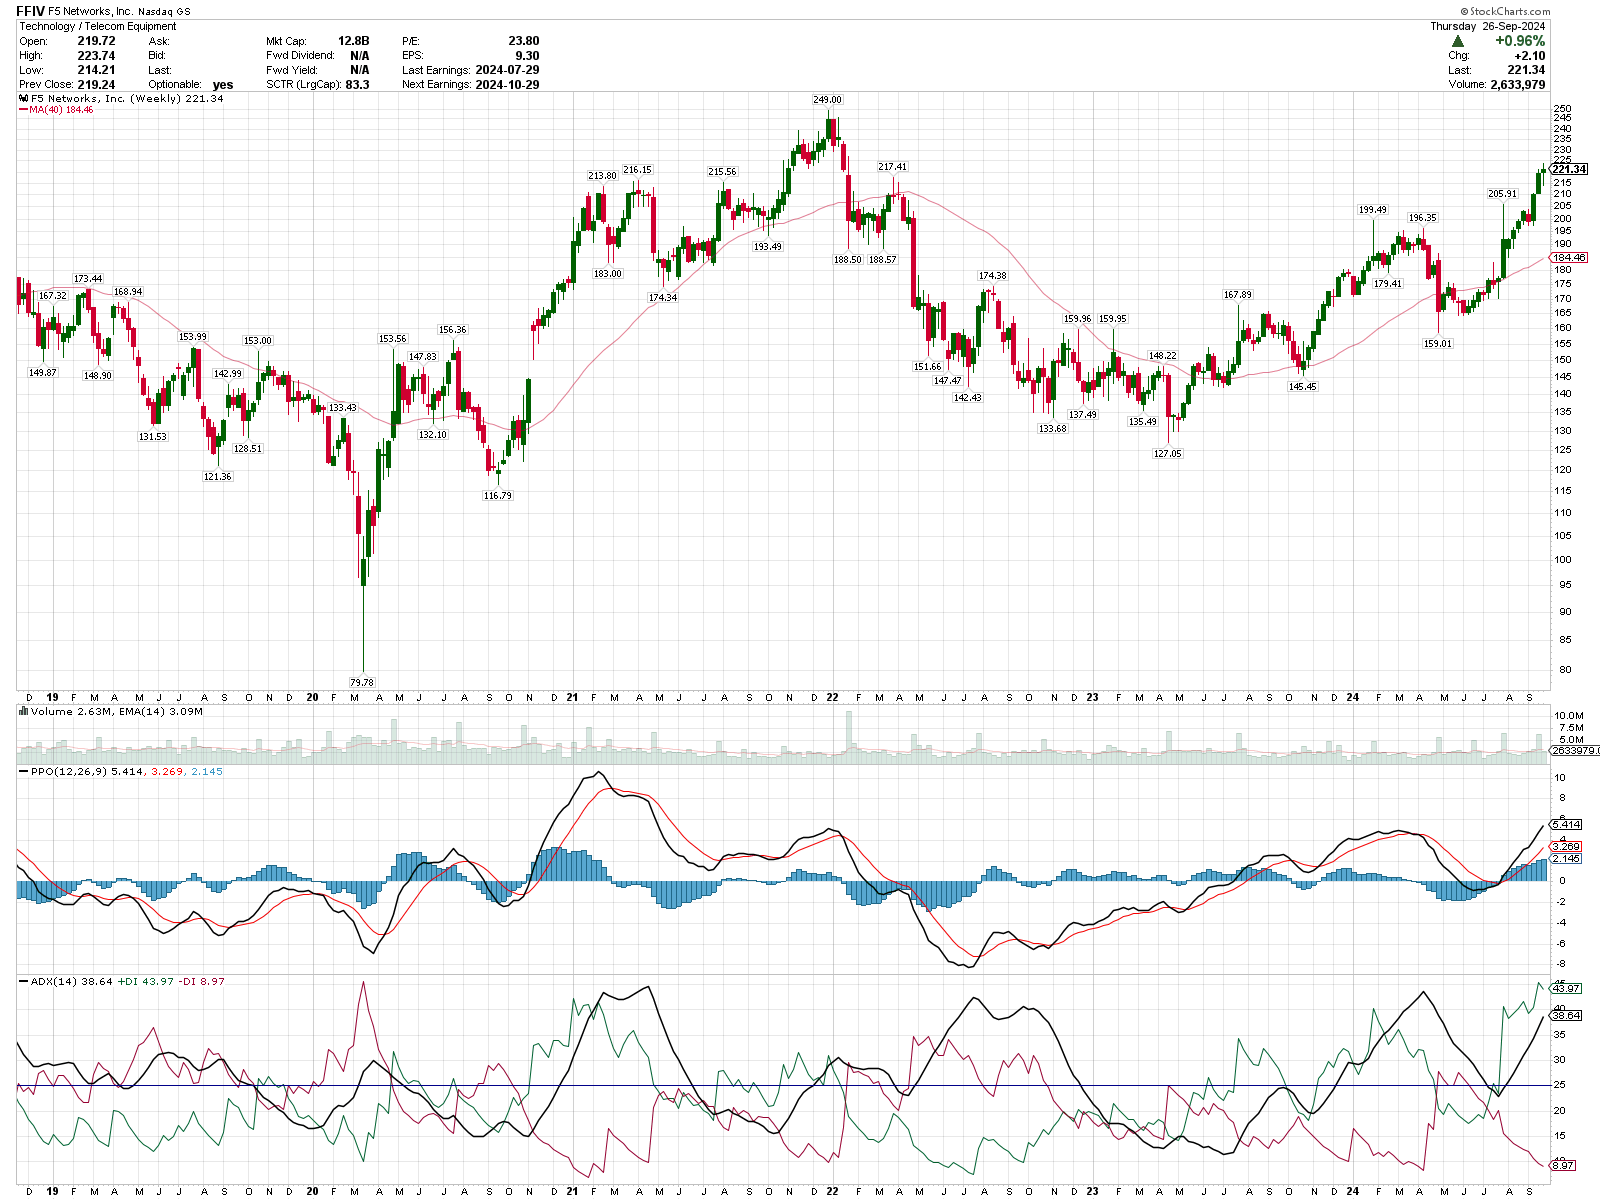
Okay, we have something very different on this chart. Our PPO looks like a rocket ship and is well over zero. The momentum line (black) is moving further apart from the signal line (red). Volume is also fairly steady during this time, too.
The ADX sits at 38.64. Anything over 25 is a sign of a strong trend for me. Note how the selling pressure is slowly falling away while the buying pressure has rocketed upwards. Buyers seem to be in control lately on the weekly time frame.
So far, the monthly chart gives an optimistic maybe but the weekly chart argues that the trend is definitely underway. What does the daily say?
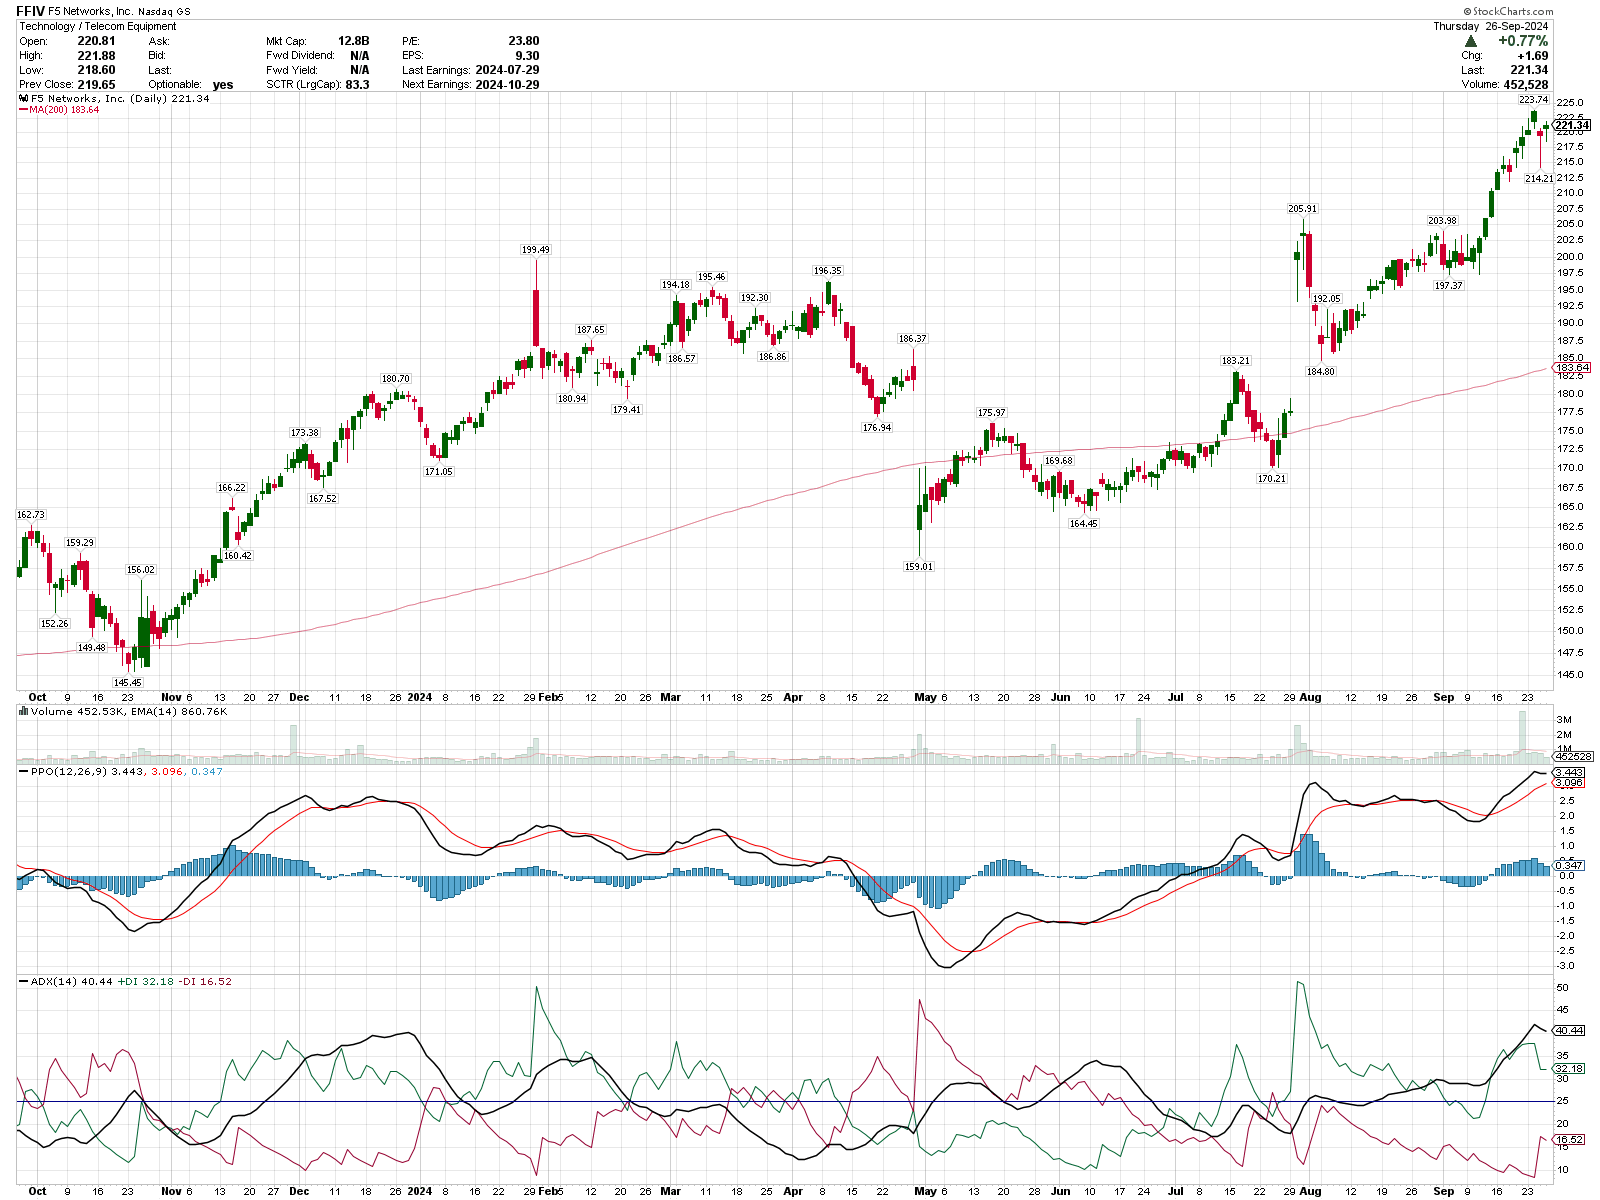
We looked at the bullish daily PPO already, but the ADX here is up around 40. Buyers have stumbled a bit recently but buying pressure remains stronger than selling pressure. We saw that in the daily candlesticks, too. FFIV is a growth company and interest rate pressures have brought valuations into question over the past couple of weeks.
At this point, I see:
- Monthly: Trend likely coming
- Weekly: Trend is underway and it's strong
- Daily: Trend is underway, very strong, but it's meeting some resistance
Institutional trading
Let's take a look at where institutions are making big trades on FFIV over the past 90 days:
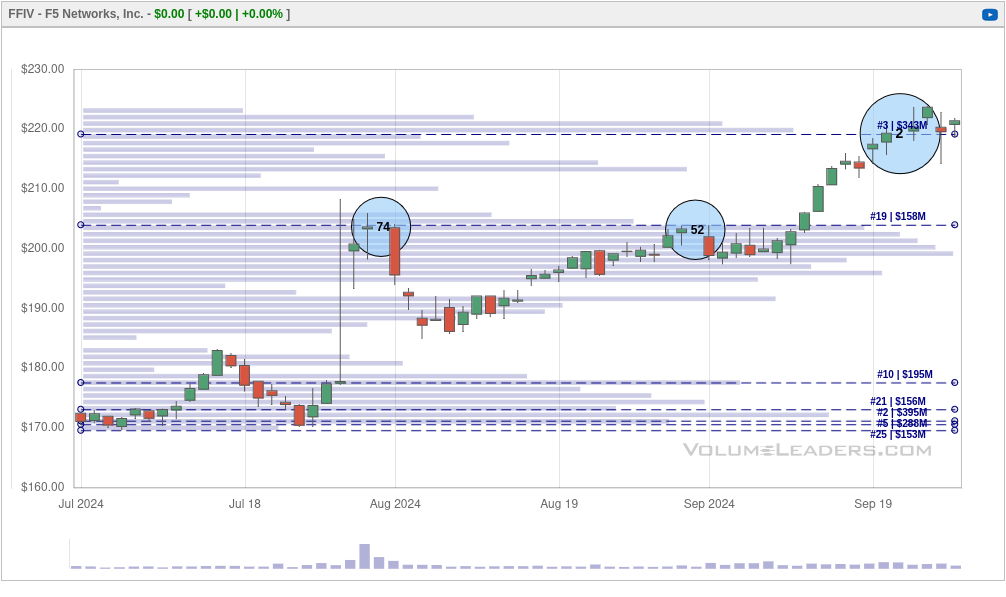
The second biggest trade ever made on FFIV happened recently around $219.24 with 1.42M shares traded at $311M. FFIV is getting stuck around its third largest volume level since it began trading. Traders might be digesting this new level to determine if they want to add to their position, go short, or exit their position.
The big trades in late July and August look like part of a consolidation area before a move higher. We might be looking at a similar pattern now. Let's bump the time frame out to one year and see what we find:
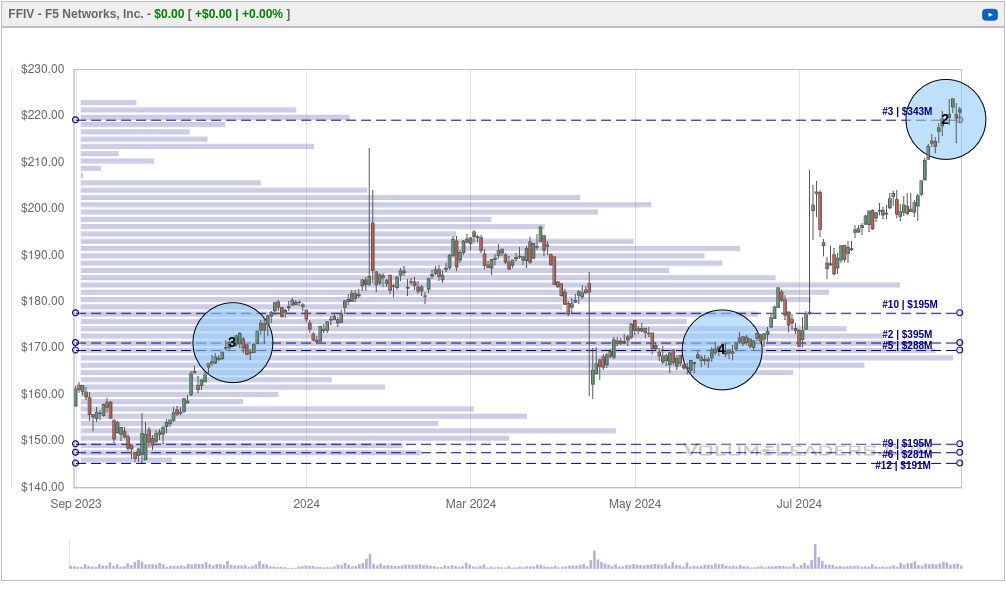
The biggest trades for FFIV seem to come at consolidation levels based on the past year's data. I could see a few possibilities for the #2 trade here:
- Someone is making a short bet or closing a long position, expecting price to fall down to one of the older levels around $170-$180.
- Someone is making a new bet on a consolidation zone, much like #3 back in late 2023.
- This trade was simply a result of index re-balancing or quarterly options expiration.
Sentiment
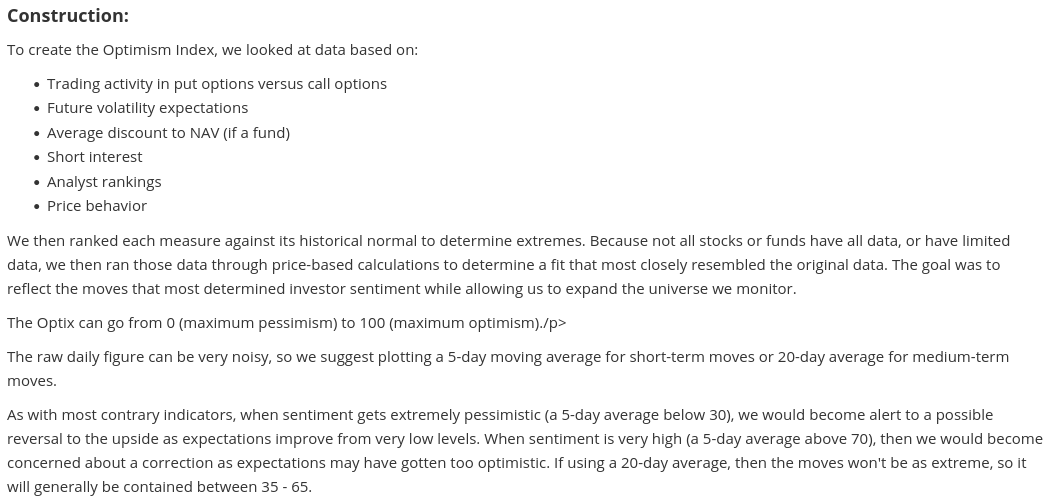
I've been trying out SentimenTrader.com lately and they offer sentiment chart for many stocks and ETFs, including FFIV. They create an Optimism Index based on several factors:
I'm still learning how to interpret these charts, but when the indicator is near or above the red line, optimism is running very high for a particular stock. Optimism is great, but too much of it can lead to a reversal. Here's a look at the weekly chart since late 2021:
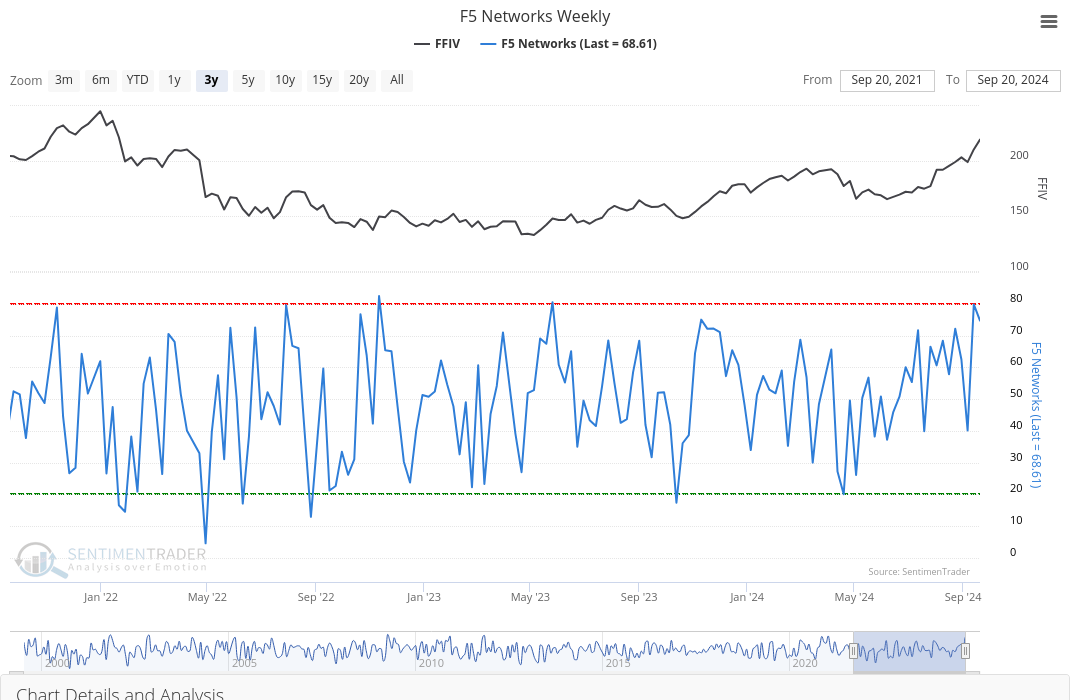
The overall trend since April has been for higher optimism. Note the higher lows and higher highs. We're approaching the red line now and that's a sign that optimism might be running a little hot. This isn't a guarantee of anything, but it matches up with the high RSI reading we saw on the charts earlier.
Thesis
FFIV definitely shows strength on multiple time frames, but it might be at a level where traders need to digest the recent movements before the next move happens. I'll be watching for consolidation or a retest of the consolidation zones around $200 or $190. Signs of a failed rally include lower volume or a breakdown in the PPO indicator. I have no FFIV trades on the board right now.
Good luck in the markets today! 🍀
Discussion