7/21 OPEX Analysis

The 7/21 OPEX is here! Let's take a look at the overall market, TSLA, and AMD before we get into the weekend. 🌴

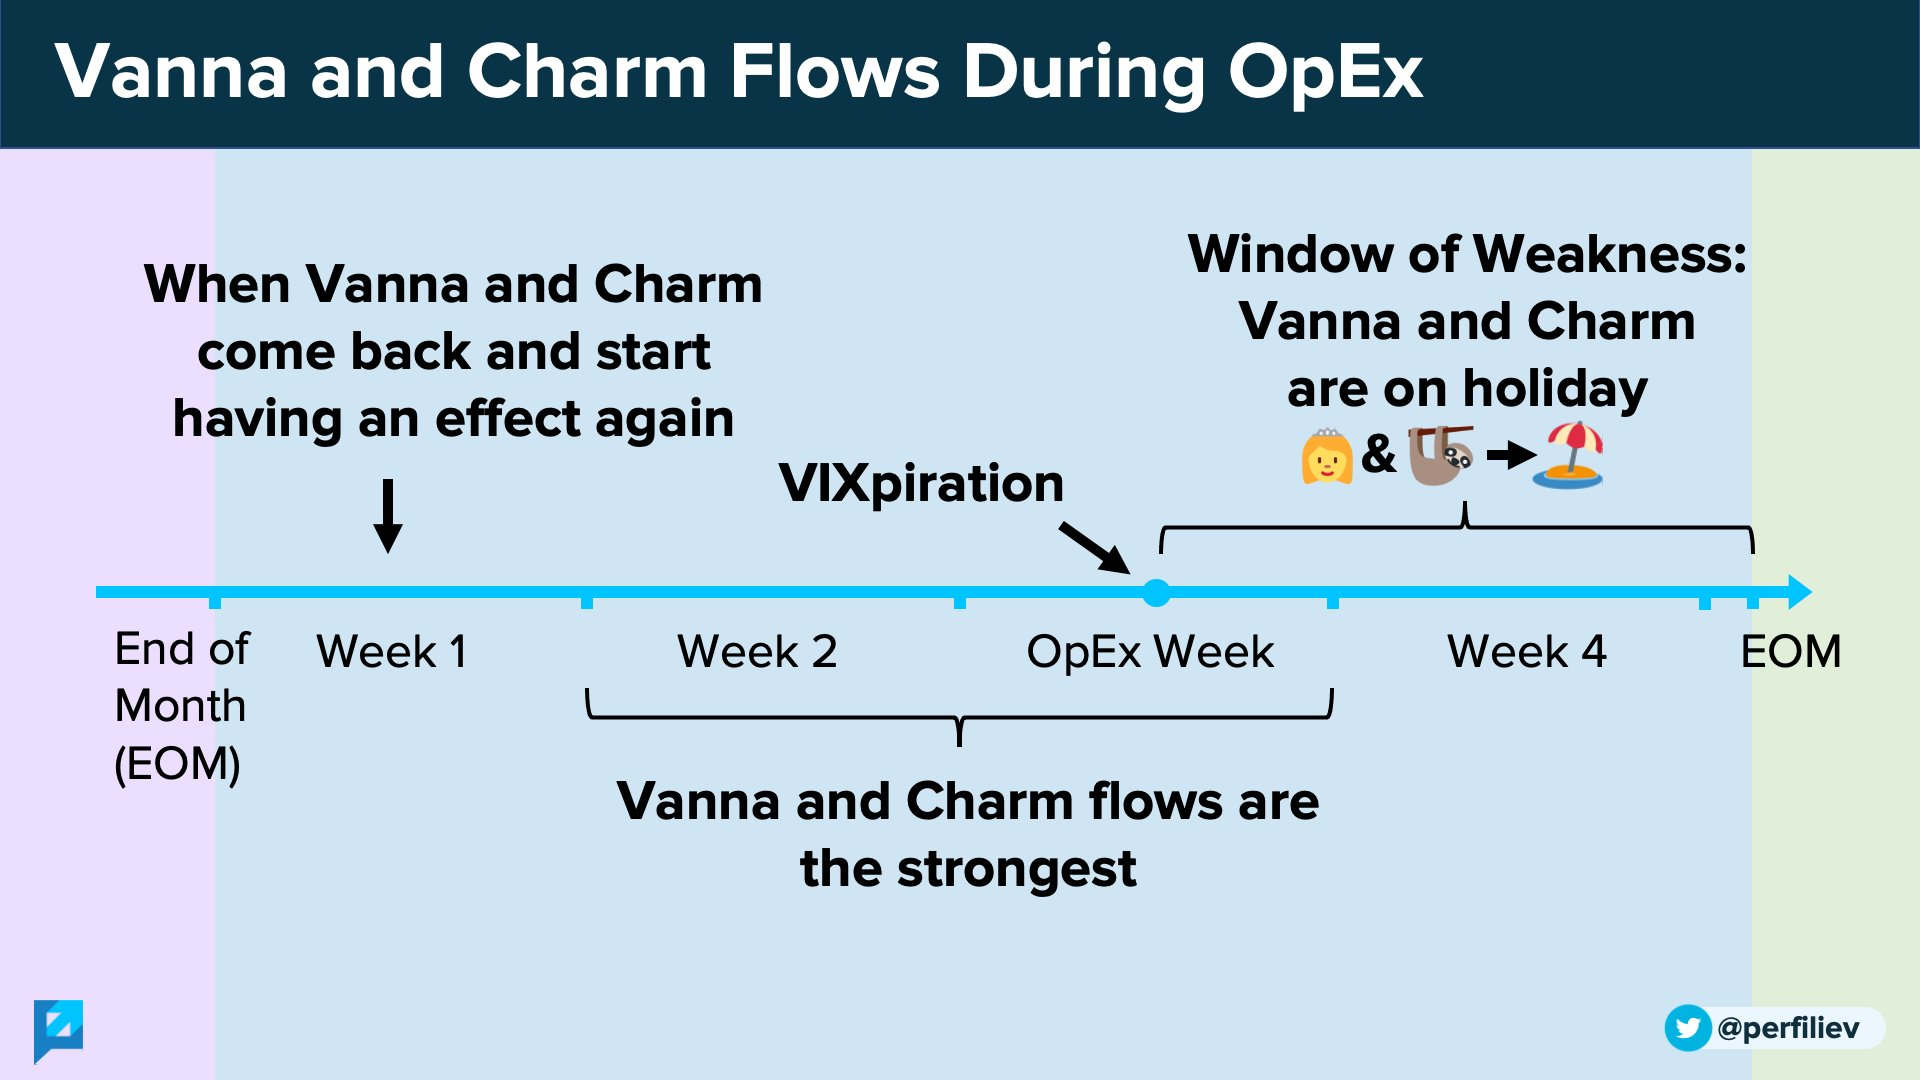
The July OPEX (options expiration) is upon us! This is one of those days where trading gets more challenging due to lots of options contracts rolling out to later expiration dates. It's also signals a change in the effects of gamma and vanna as noted below:
The market was flooded with news yesterday from earnings calls to new recession predictions from various economic indicators. But that's not my focus here. I work based off the data I can see and measure – not the feel of the market.
With that said, let's have a look at the overall market and a quick look at TSLA and AMD. But first:
All investments come with significant risks, including the loss of all capital. Please do your own research before investing, and never risk more than you are willing to lose. I hold no certifications or registrations with any financial entity.
Here we go! 😜
Overall market
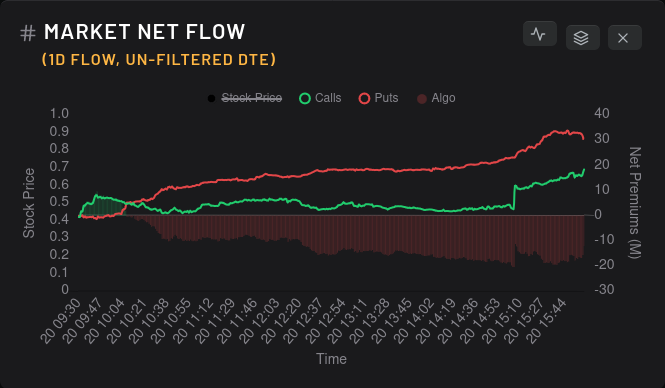
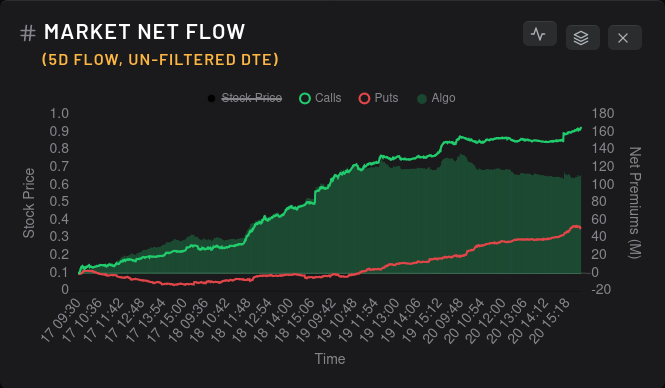
Market net flow took a stumble yesterday but be sure to gauge this movement on the five day chart below. Options contracts look to be charging up again as we move towards another Federal Reserve interest rate announcement next week:
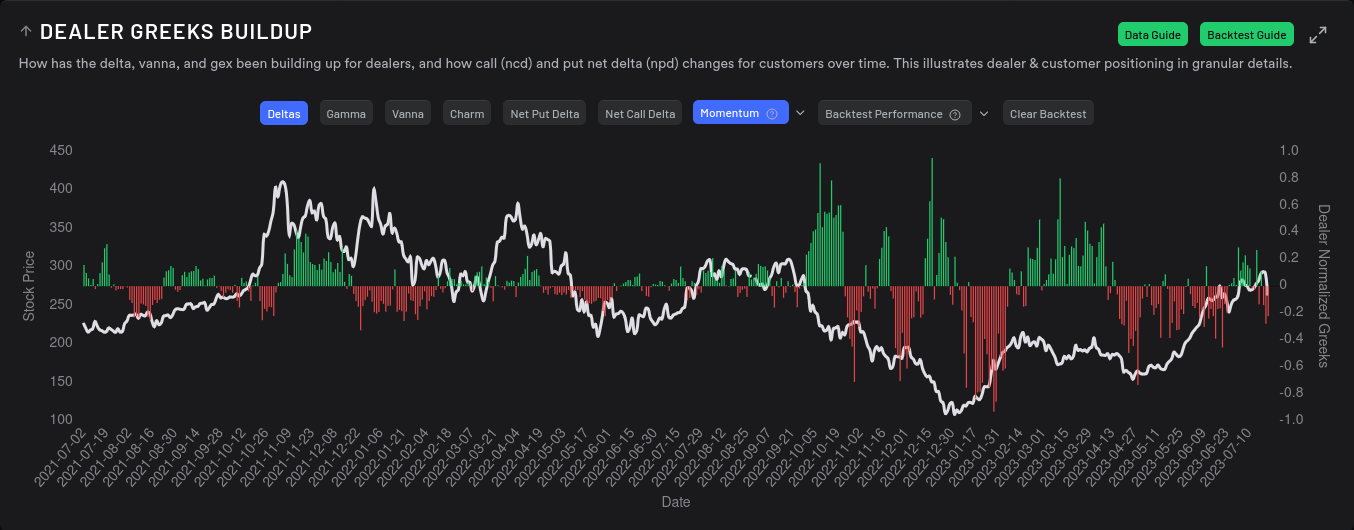
Analyzing dealer greek buildups for SPY can be a bit daunting, but dealers have been mostly long (which means market participants are short) throughout this entire run up:
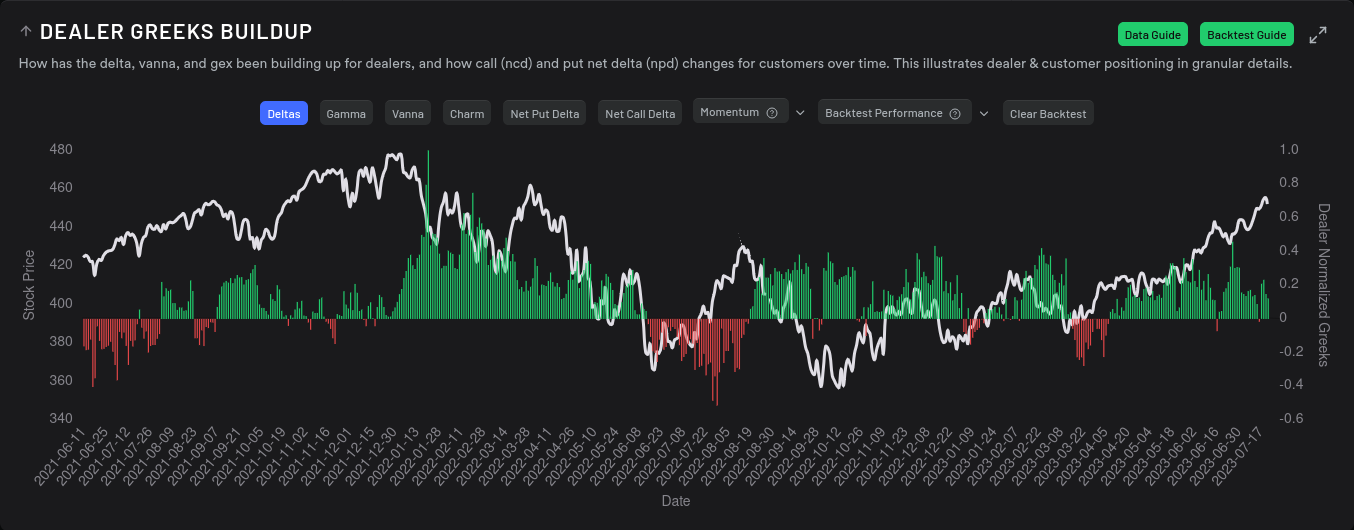
SPY seems to backtest better off pure day-to-day measurements here (unlike 15 day momentums for TSLA/AMD), and it seems to backtest fairly well over the past year if you buy when dealer greeks are red and sell when they are green:
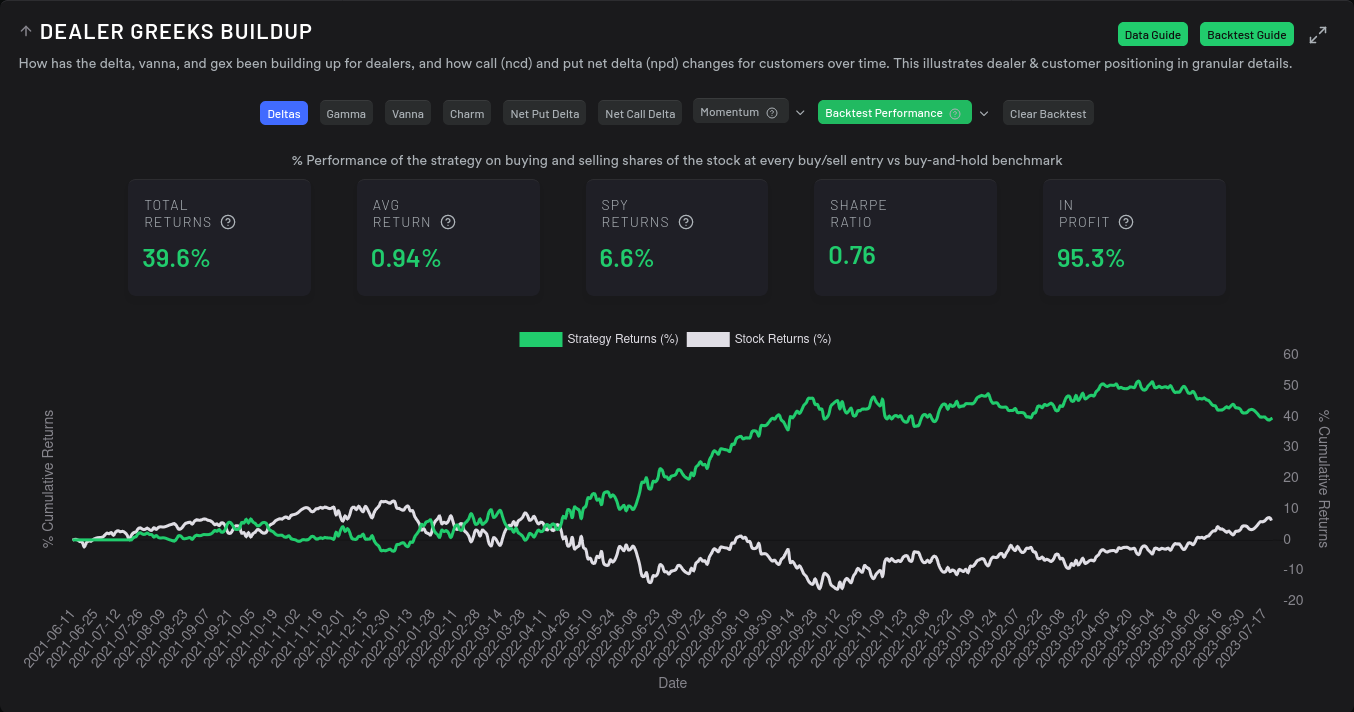
Notice that the right side of this chart shows diminishing returns as SPY climbs. There's a ton of hedging activity in SPY and that could be the cause of this divergence.
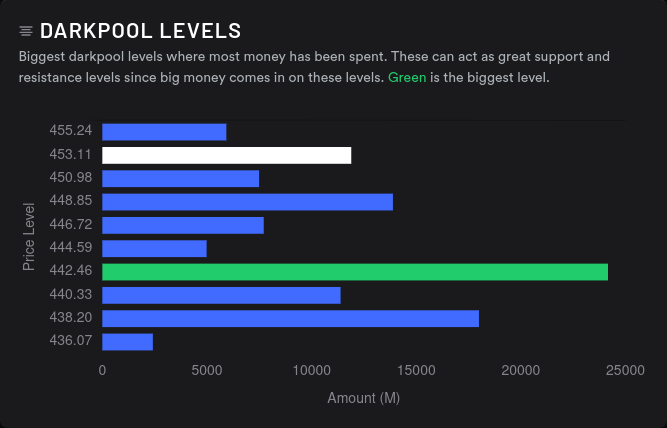
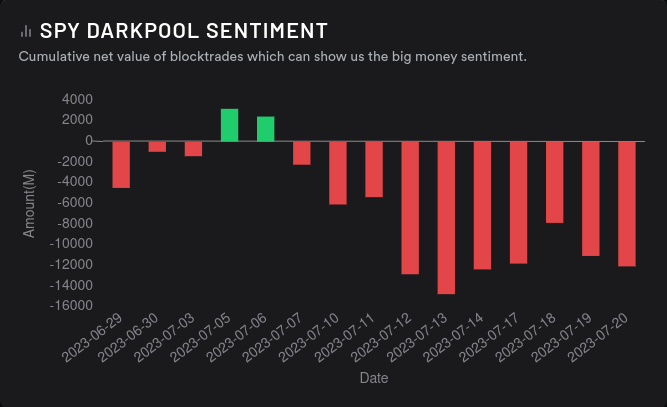
SPY's dark pool data suggests our highest volume is around $438-$442 and sentiment has trended bearish lately:
TSLA
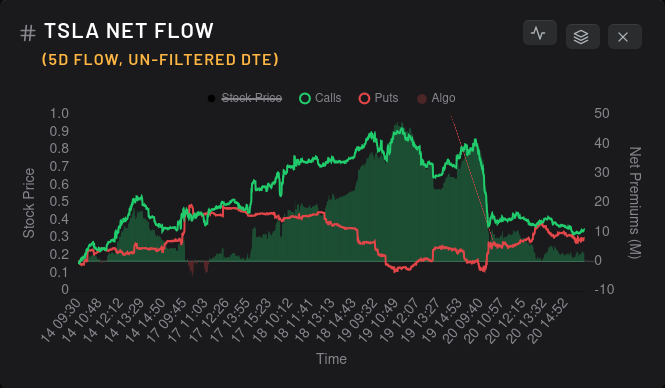
It's safe to say that the market is still digesting the earnings data from TSLA and other companies. Yesterday's price action was wild with a gap down in the morning.
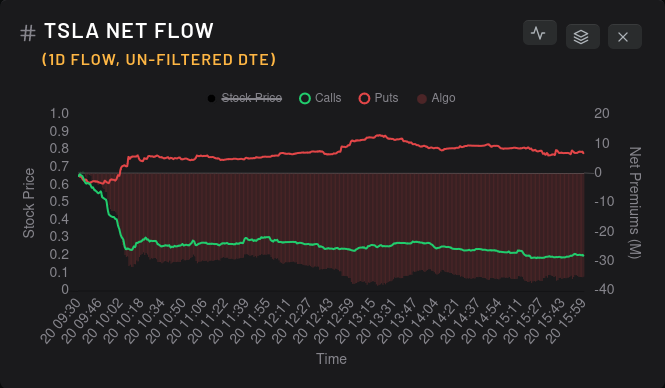
Puts crept up slightly but calls sold off in a hurry. This could be from call holders who looked to cut their losses, or these could be net new short calls:
Vanna is going into a weaker phase, but we've moved into a totally different state than before. Positive vanna above price has dwindled and $275 has shown up as a downward pressure zone:
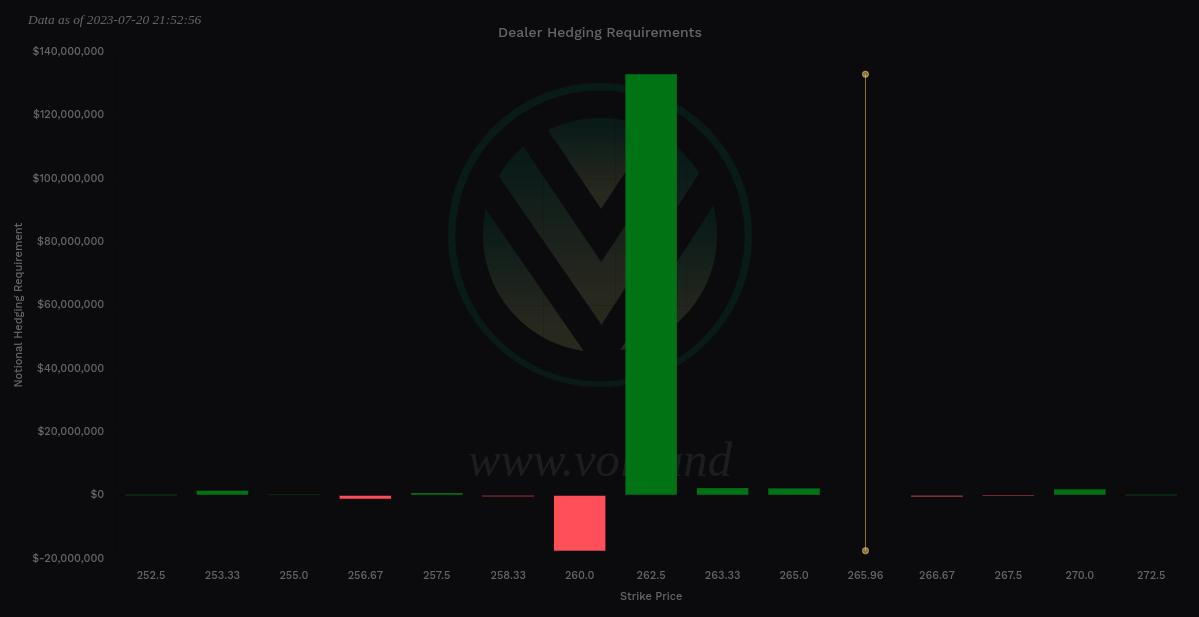
TSLA's delta-adjusted gamma is limited to the $260-$262.50 range.
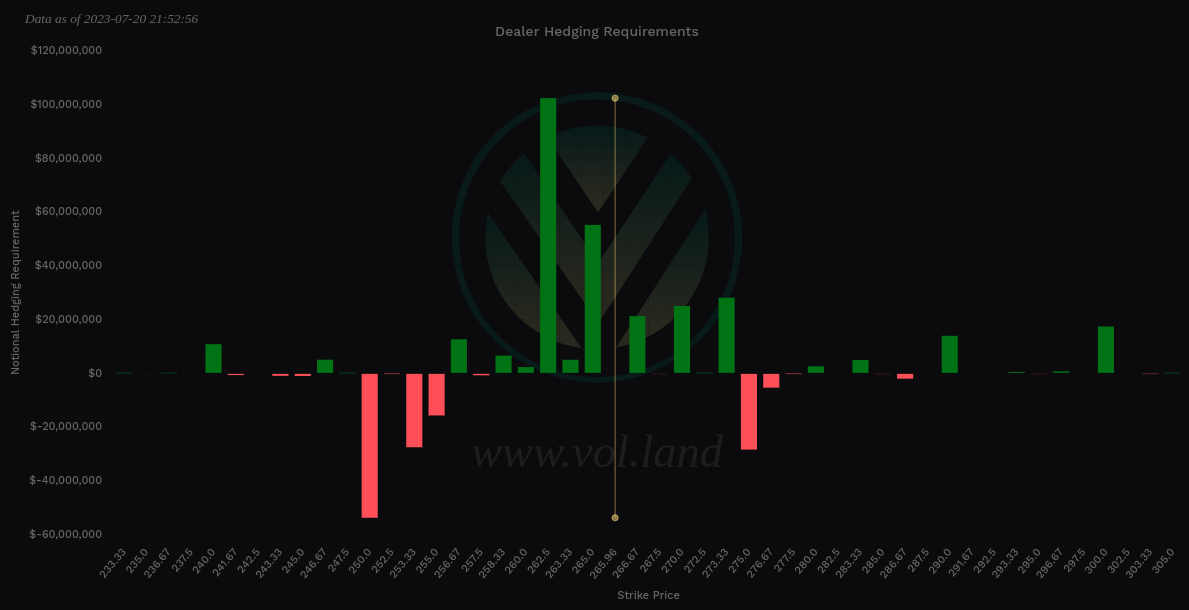
Dealers are still short, but a little less than Thursday. This correlates with what we saw above as customers pulled back from some bullish trades after earnings:
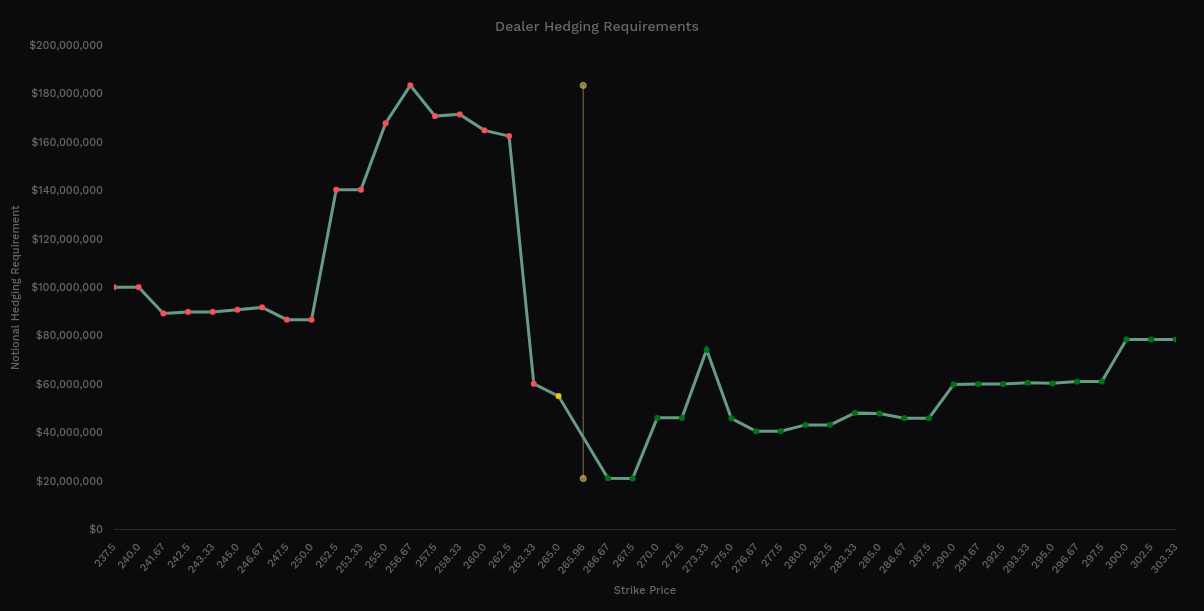
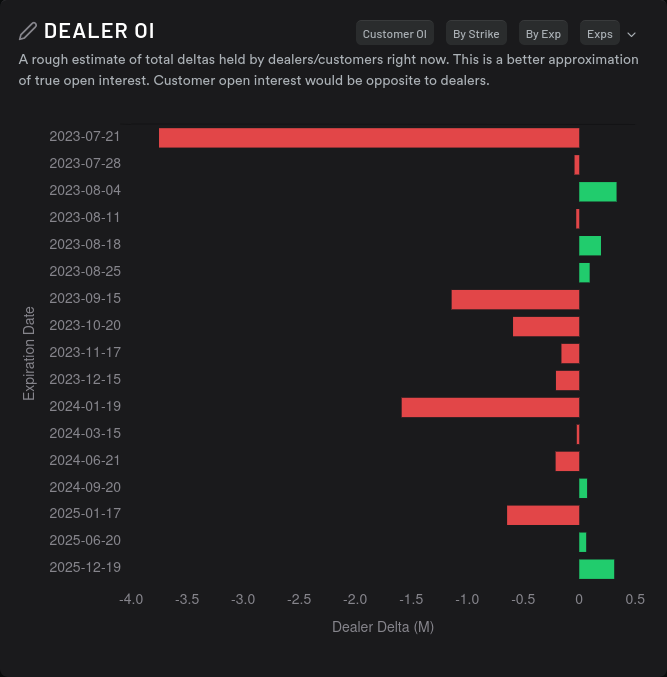
Dealer open interest still suggests that 7/21 has a ton of bullish premium wrapped up in it and we might hit some speed bumps until another bullish expiration on 9/15:
Dark pool data shows that we're well below the highest volume zone around $274-$278 and yesterday's dark pool volume was less than I expected. We have a bullish sentiment here and yesterdays trades were almost even on sentiment.
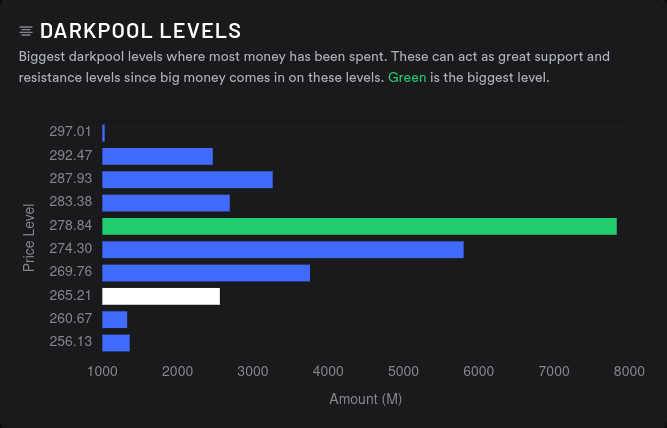
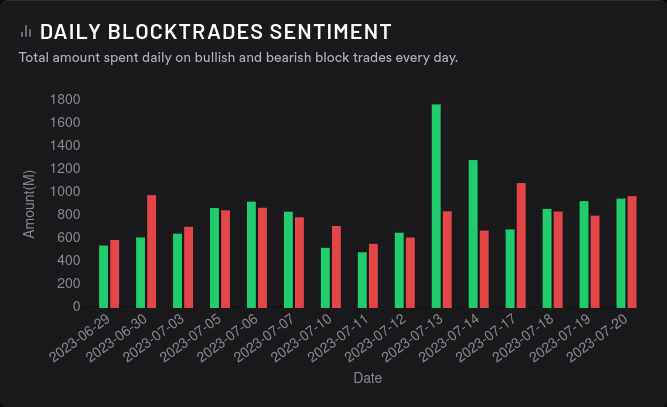
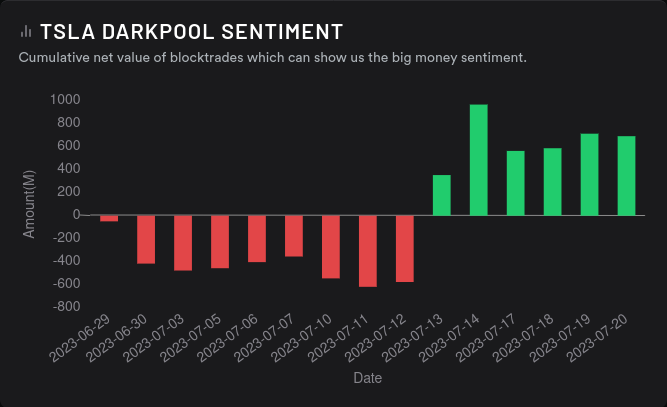
In the past, price falling under big dark pool volume areas has usually meant a reversion back to that high volume level, but we will have to wait and see.
AMD
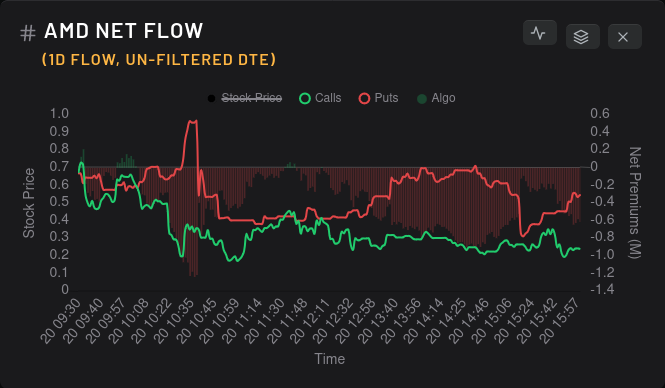
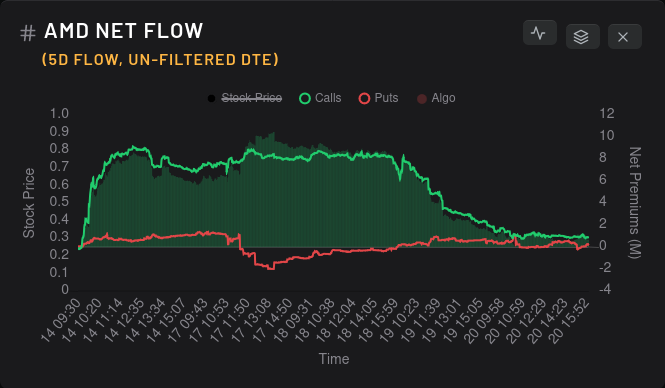
A few people pointed out that TSM's earnings news yesterday may have spooked AMD traders a bit. AMD's price action yesterday was surprising, but the options flow tells a slightly different story as we approach earnings on 8/1. Calls and puts both sold off here:
AMD's dealer greeks buildup over a 15 day period are moving closer to the zero line which suggests that bullish and bearish options traders are battling nearly evenly as AMD sits in a good support zone:
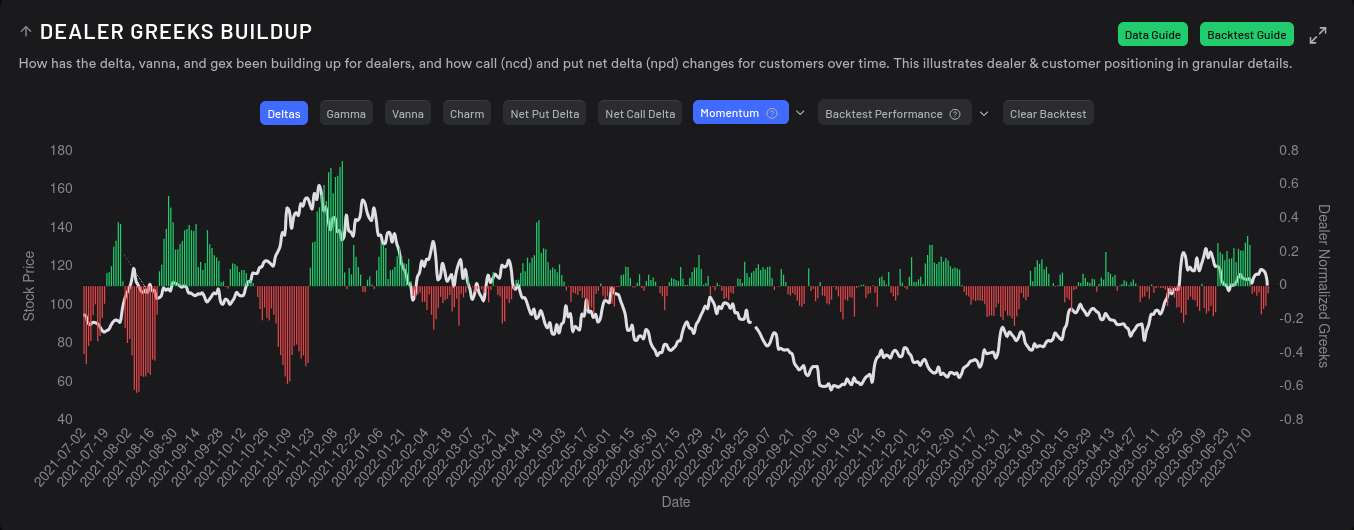
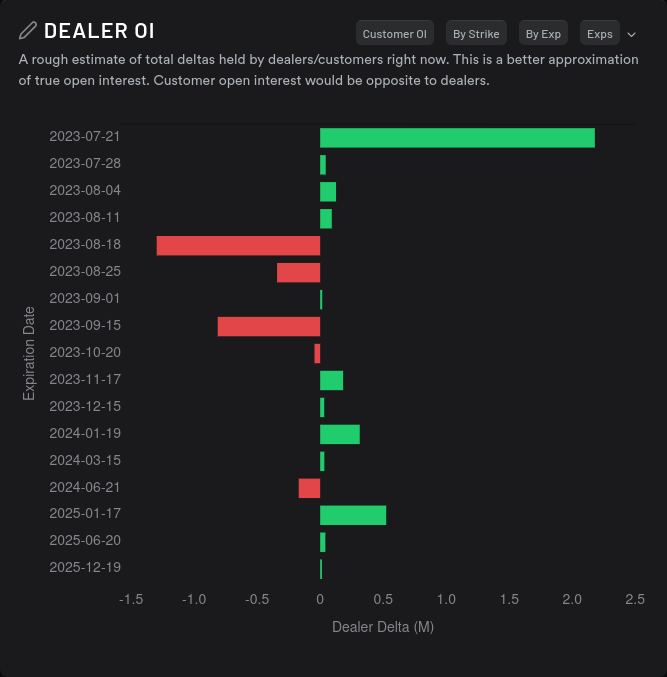
Dealer open interest suggests that 7/21 is a bearish expiration with some hope coming for 8/18:
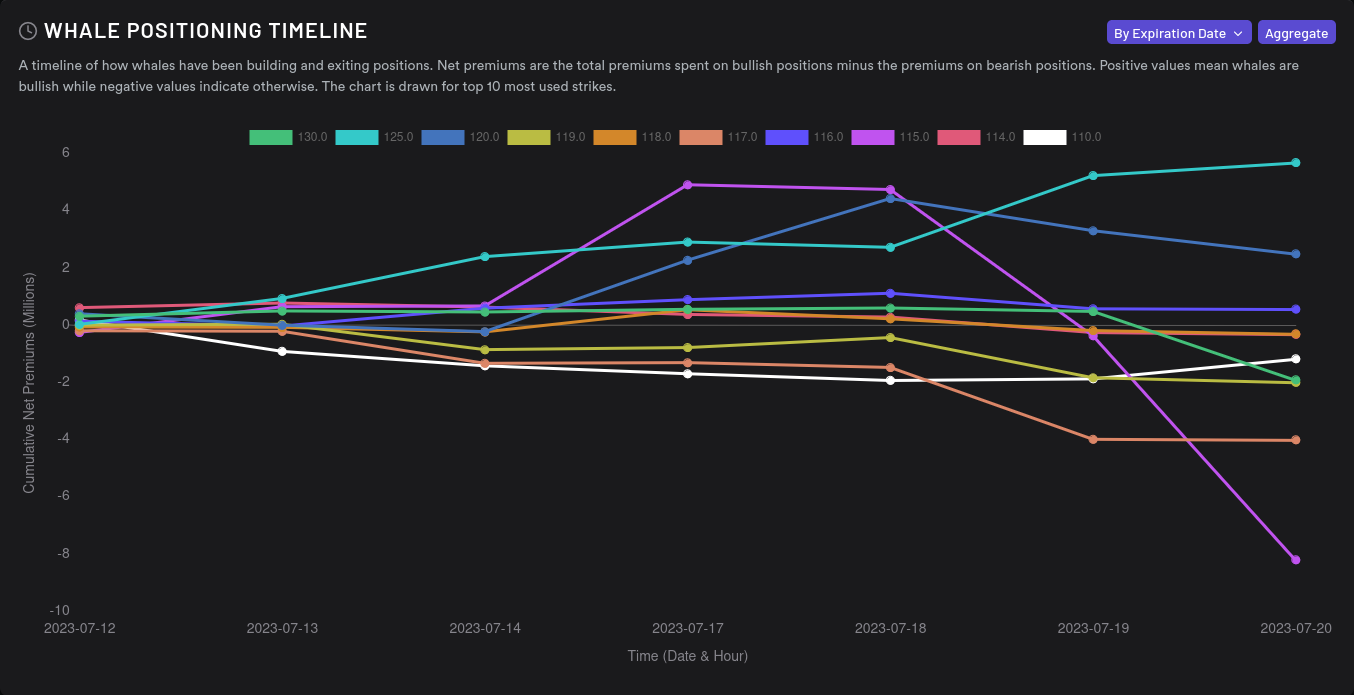
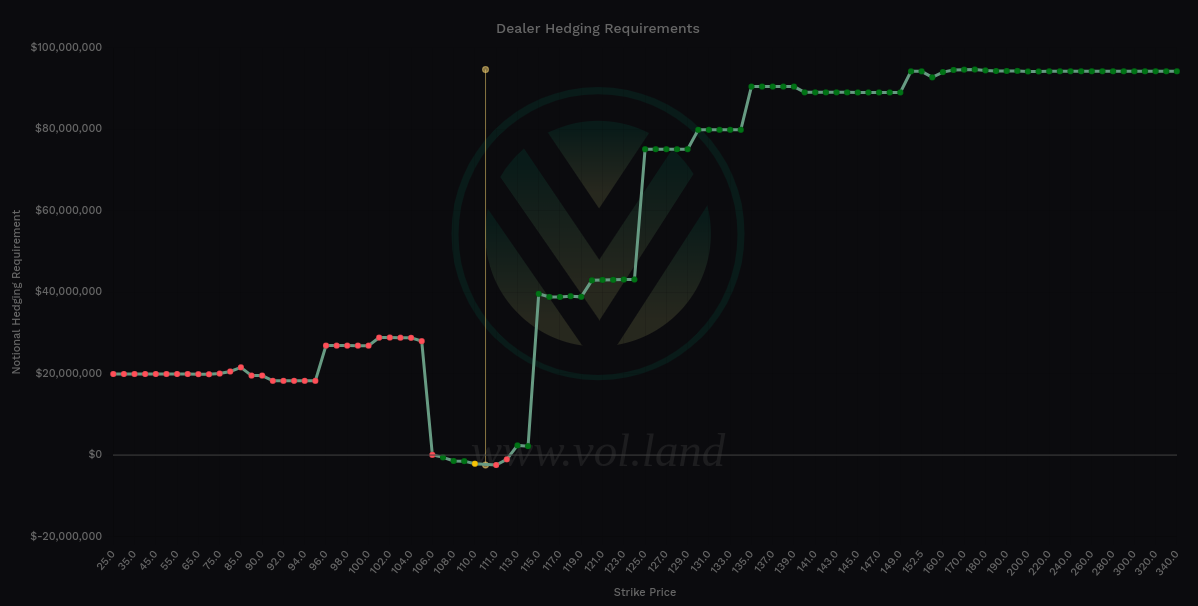
Big money options traders are going bearish at $115 but $125 is steadily getting more bullish:
AMD's vanna is in a weakened state, but it looks bullish except for that $105 positive vanna line below the current price. Above price, $115 and $125 show up as potential magnets if implied volatility can stay calm:
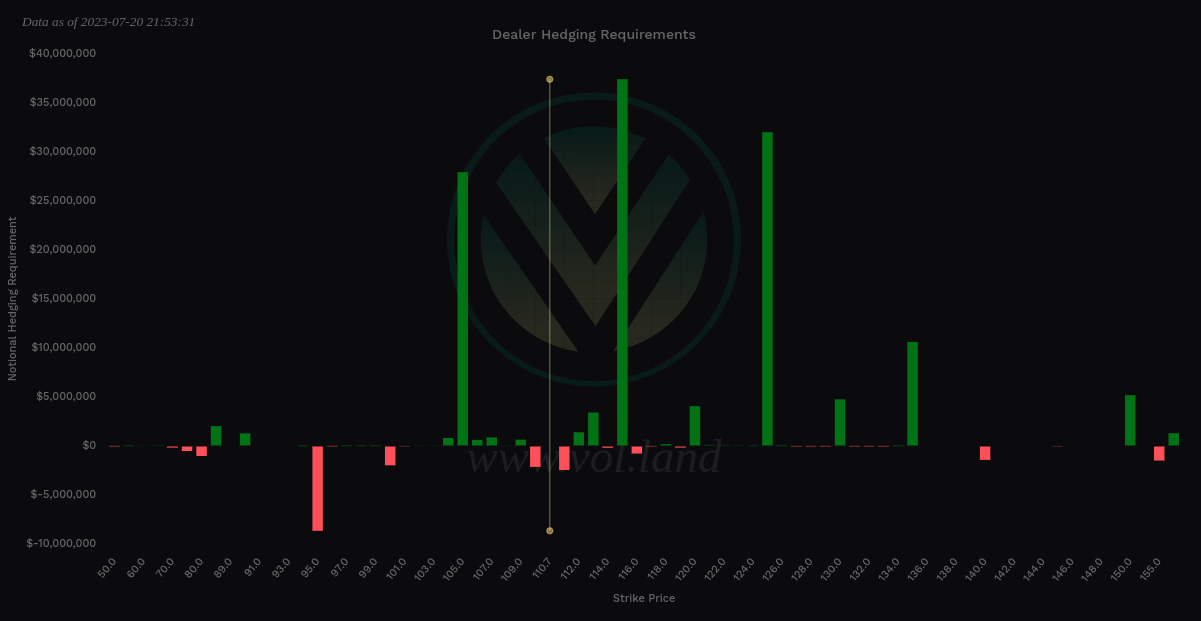
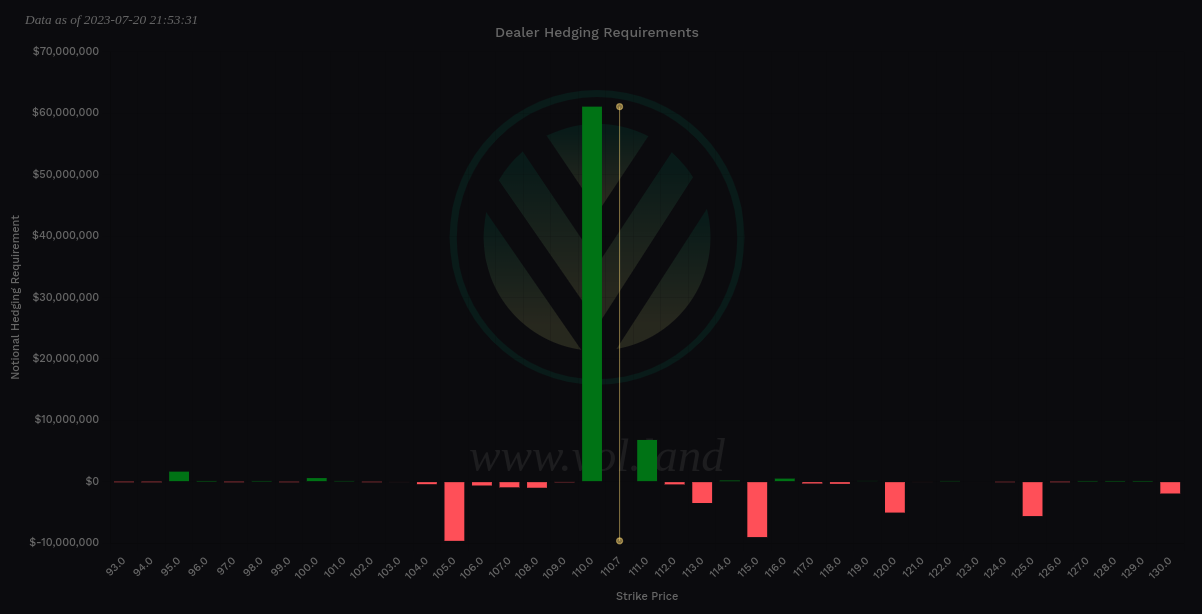
AMD's delta-adjusted gamma is crowded around $110 as I expected. I have a support line drawn on my charts at $109 from last weekend and there's been plenty of support in the $110-$115 range for a while:
Can we find correlations in the dark pool data? Well, Tradytics is throwing some errors on AMD's dark pool data page this morning so we'll have to work without that data today. 🤦♂️
Thesis
TSLA sure does have some wild swings. My $295 short call came off easily yesterday with a great profit, but my long shares and the $280 short put are looking a bit sad right now. I'll leave these alone, get assigned some additional shares this weekend, and build a plan this upcoming week.
We're back to $265 or so this morning and if we rally back into the $270's where we have all that dark pool volume, I should be able to work that cost basis down. One of my biggest mistakes in the past involves selling covered calls much too early after a drop and getting assigned on those.
AMD bounced exactly off my support/resistance line around $109 yesterday and this morning:
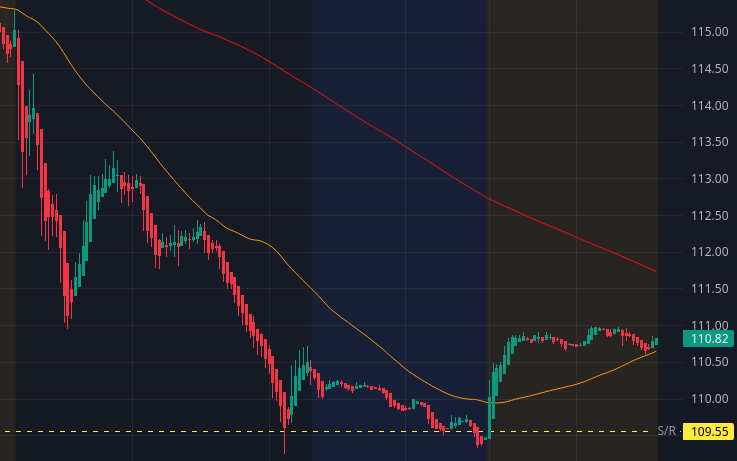
There's a potential for AMD to get back into the $110-$115 zone and consolidate a bit more before earnings and I've sold some puts to cash in on some of that. If we go below $109, stay below that line, and options data turns bearish, I may get aggressive with some covered calls. My cost basis on AMD is in the $90's, so getting assigned in here would secure some profits.
Good luck out there today and have a great weekend! 🍀
Discussion