AMD analysis for April 29
Going up against NVDA is no easy task, but AMD is showing signs that it's setting up for a turn. Earnings call is tomorrow! 📢

Happy Monday! This week comes with a bunch of news that could push the market one direction or another:

Be prepared for a little extra volatility this week. Stick to your system!

All investments come with significant risks, including the loss of all capital. Please do your own research before investing, and never risk more than you are willing to lose. I hold no certifications or registrations with any financial entity.
Today's post is all about AMD! Let's get started. 🚀
High level overview
AMD has earnings tomorrow, Tuesday, after the market closes. Although its performance has been a little rocky lately, it looks great in the long term:

During the last earnings call, Lisa Su gave a wide range for future earnings and it will be interesting to see how AMD has performed against that expected range.

Charts
AMD lost a little strength against the market as a whole since early March, but it settled into a very interesting level near the 200 day moving average. StockChart's SCTR rating, which uses indicators on different time frames, is approaching 90 again. That's a sign of recovering strength.

Volume has trailed off since the early March highs as the price slid down. Decreasing volume during a trending move leads me to think that this downward move doesn't have a lot of strength behind it. RSI bounced off the 30 level as AMD touched $145.
Let's break away from some of the chop on the chart and examine a weekly chart:

AMD has shown strength against the overall market with a very positive 200 week moving average. The weekly RSI is right in the middle of the range as we go into earnings. The bottom of our 20 week price channel sits at $116 and the 20 week moving average is at $102.
The current pattern looks quite similar to the late 2021 and early 2022 pattern, but circumstances with interest rates and semiconductors in general have changed a lot since then.
Ratios
Let's begin by comparing AMD to the overall market using VTI, Vanguard's total stock market ETF:

The ratio sits above a 200 day moving average and the MACD fast line is touching the slow one. When I see that along with an RSI line below 50 that is on the rise, I see this as an incredibly bullish setup. However, earnings calls are dangerous and it's good to be prepared for a move in either direction.
Comparing AMD to XLK, the S&P 500 tech ETF, doesn't give us much more information. We can compare AMD to SMH, the semiconductor ETF, for another view:

On the bearish side, RSI is quite low and the ratio fell below the 200 day moving average quite aggressively. This shows that AMD is losing ground to semiconductors at a rapid pace. The MACD hints at a potential turnaround coming soon.
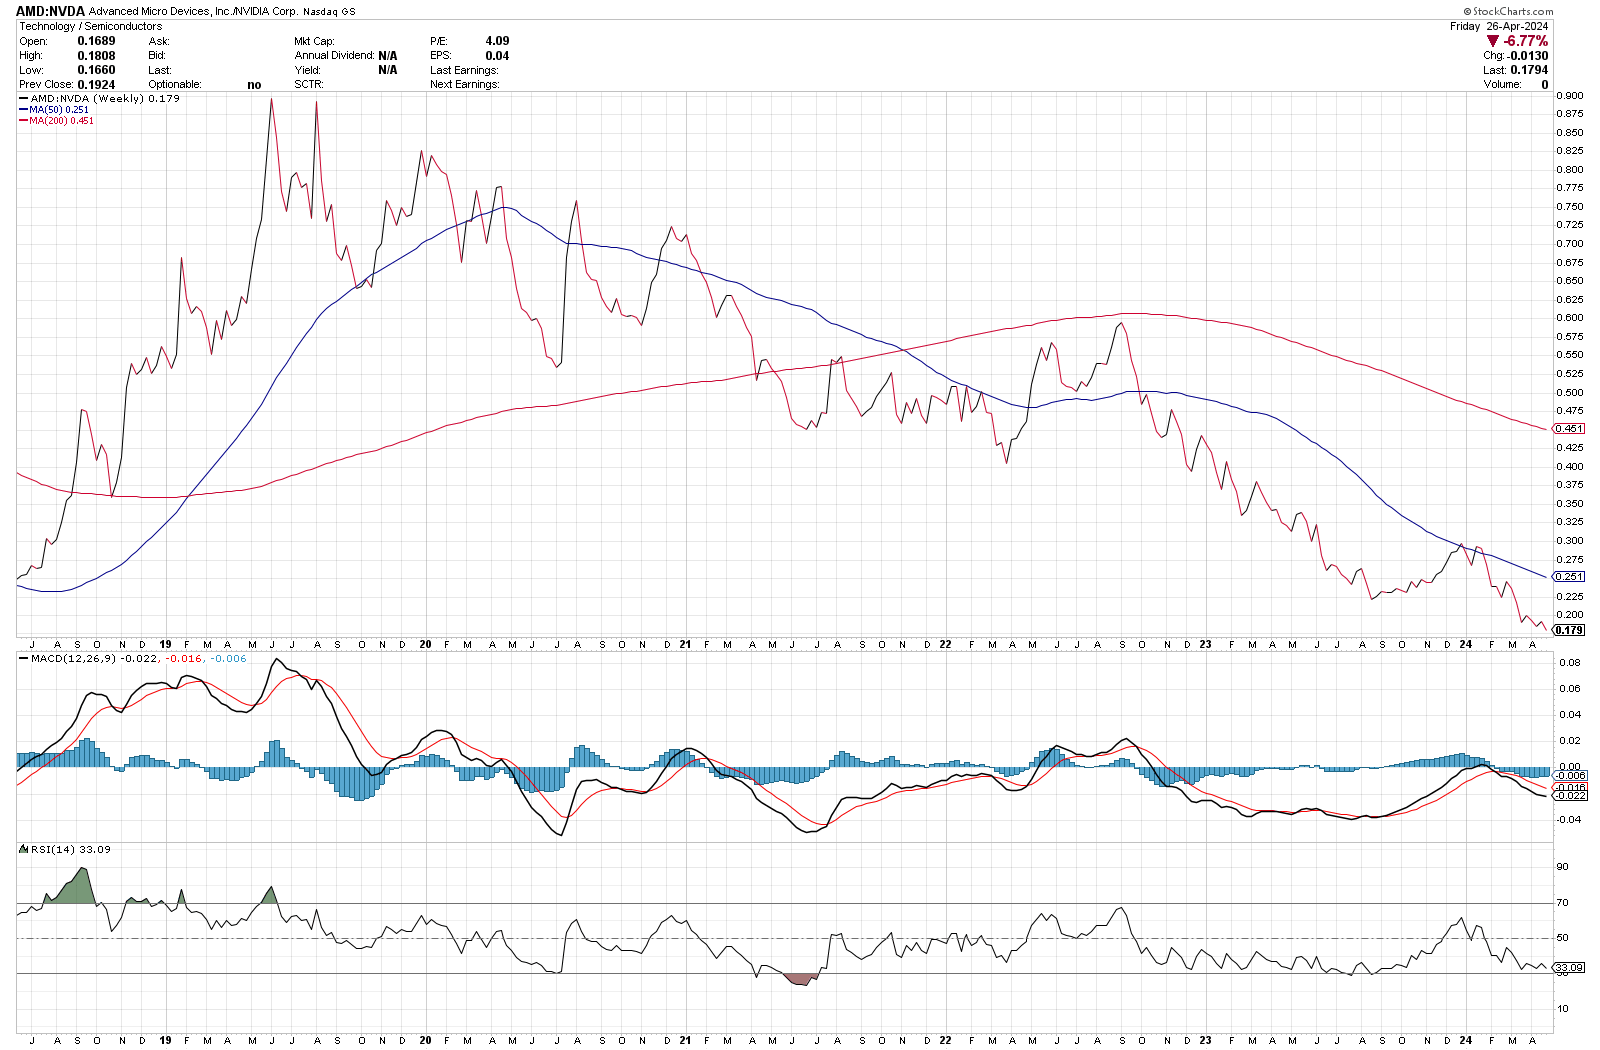
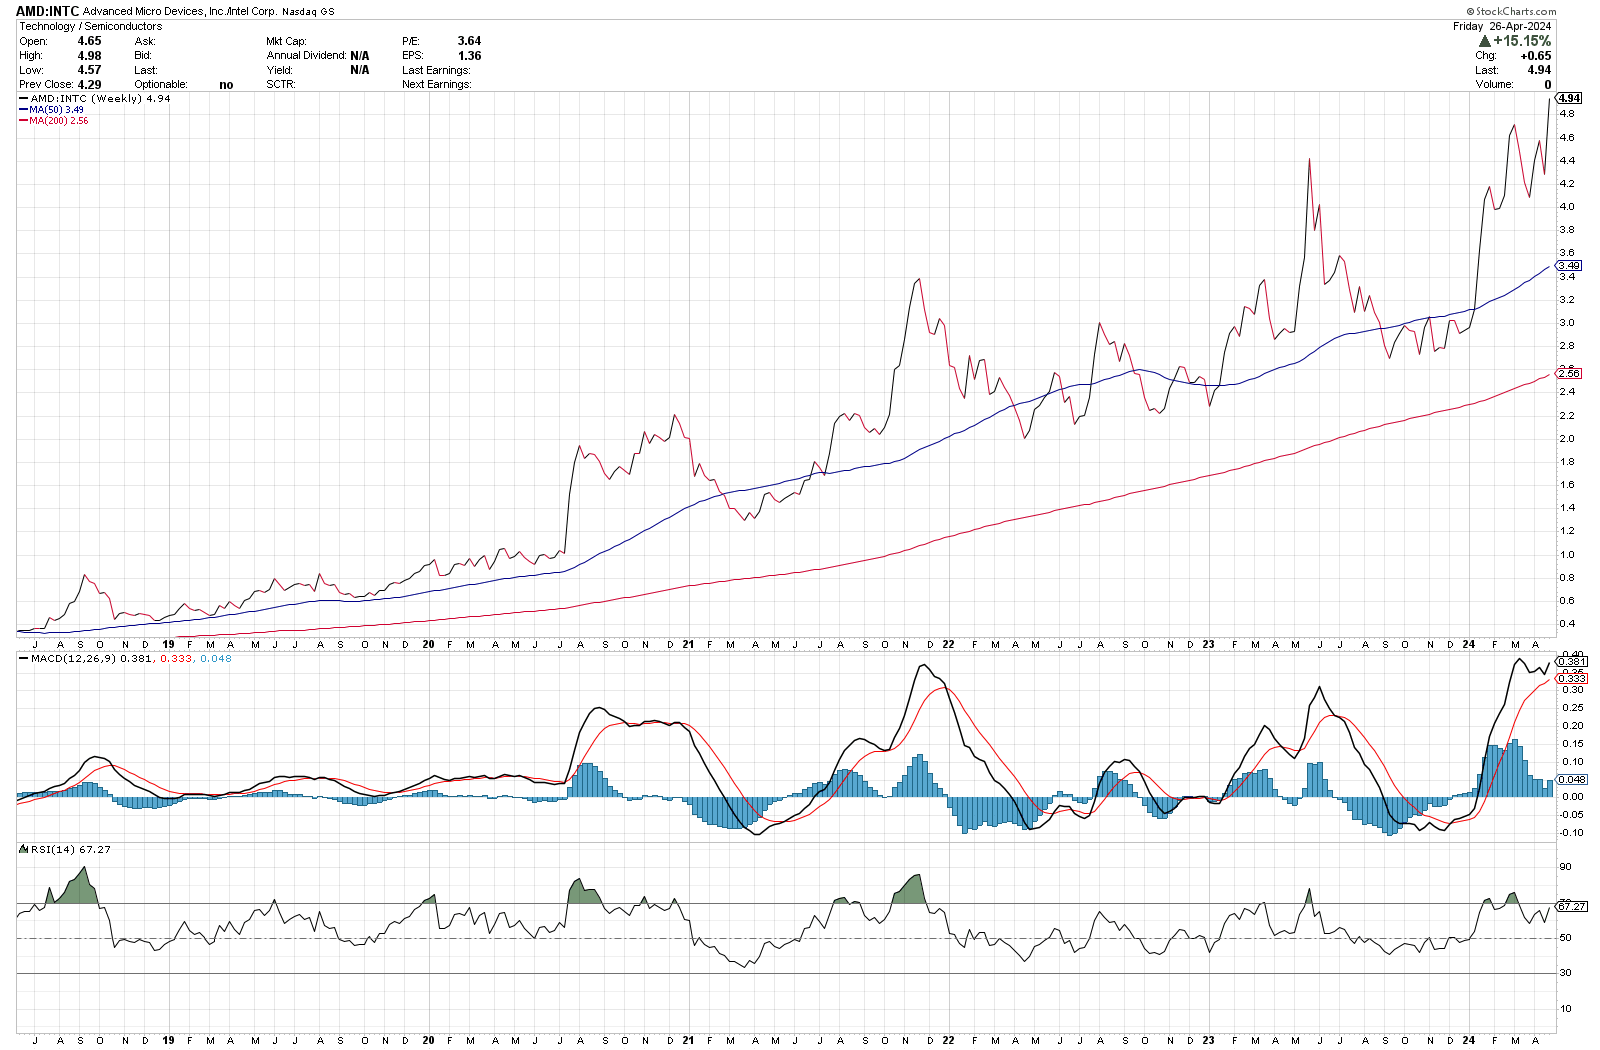
AMD competes with NVDA in the GPU space and with INTC in CPUs. How do those comparisons look?


AMD/NVDA and AMD/INTC
NVDA has been a monster lately, and AMD has lost ground to NVDA since the beginning of the pandemic. INTC is a totally different story. AMD left INTC in the dust beginning back in mid-2020 and hasn't looked back since.
Institutions
Volume Leaders tells us where institutions are interested in trading AMD. We can see the time of the trade, the quantity, and the price, but it's up to us to determine the directionality of these trades. The YTD chart shows an incredible amount of trading at the highs, including the biggest trade ever made on AMD right around $190.

If we zoom in a bit and start the chart right on the highs from March 8th, the pattern changes a bit:

We had a blast of huge trades down from the highs which were likely new shorts or profit takers. Things were quiet until we entered April. The most recent three trades are still large, but relatively smaller than the rest. The 64th biggest trade was the most recent and AMD began trading up a bit after that one.
Are we seeing institutions pile back in with bullish trades? I'm not sure yet, but these trades have more space between them than the frantic moves at the highs. The chart certainly looks like it has better odds of a turnaround, too.
Thesis
I've been an AMD bull for quite some time. Competing with NVDA is a difficult proposition, but AMD excels when it's holding the #2 or #3 spot in just about anything. AMD CPUs have really impressed me lately with performance, capability, and efficiency. I recently bought a Lenovo Z13 G2 with an AMD Zen 4 CPU and the efficiency is unbelievable. This used to be an area where INTC would crush AMD.
As for the market data, we have plenty of signs that AMD is poised for a turnaround of some sort. Institutions are trading it differently and market participants seem to be pulling back and waiting for the earnings results.
I have short June puts at $130 and $135 on AMD. Deltas on both have moved in my favor lately, but earnings are notoriously difficult to predict. AMD's IV rank sits at 75% right now and that gives me a great opportunity to short volatility.
Good luck to everyone today! 🍀


Discussion