AMD analysis for January 10
It's my first post about AMD after my 2024 trading reset! Let's review the only thing in the stock market that won't lie to you: the chart. 📈

As I mentioned earlier this week, I'm doing a trading reset for 2024. The vast majority of my focus will now be on the charts themselves. I'll focus more deeply on fewer tickers without so much information to digest.
Thanks for joining me on this journey! 🫂
All investments come with significant risks, including the loss of all capital. Please do your own research before investing, and never risk more than you are willing to lose. I hold no certifications or registrations with any financial entity.
Let's get a look at AMD today!
Long term
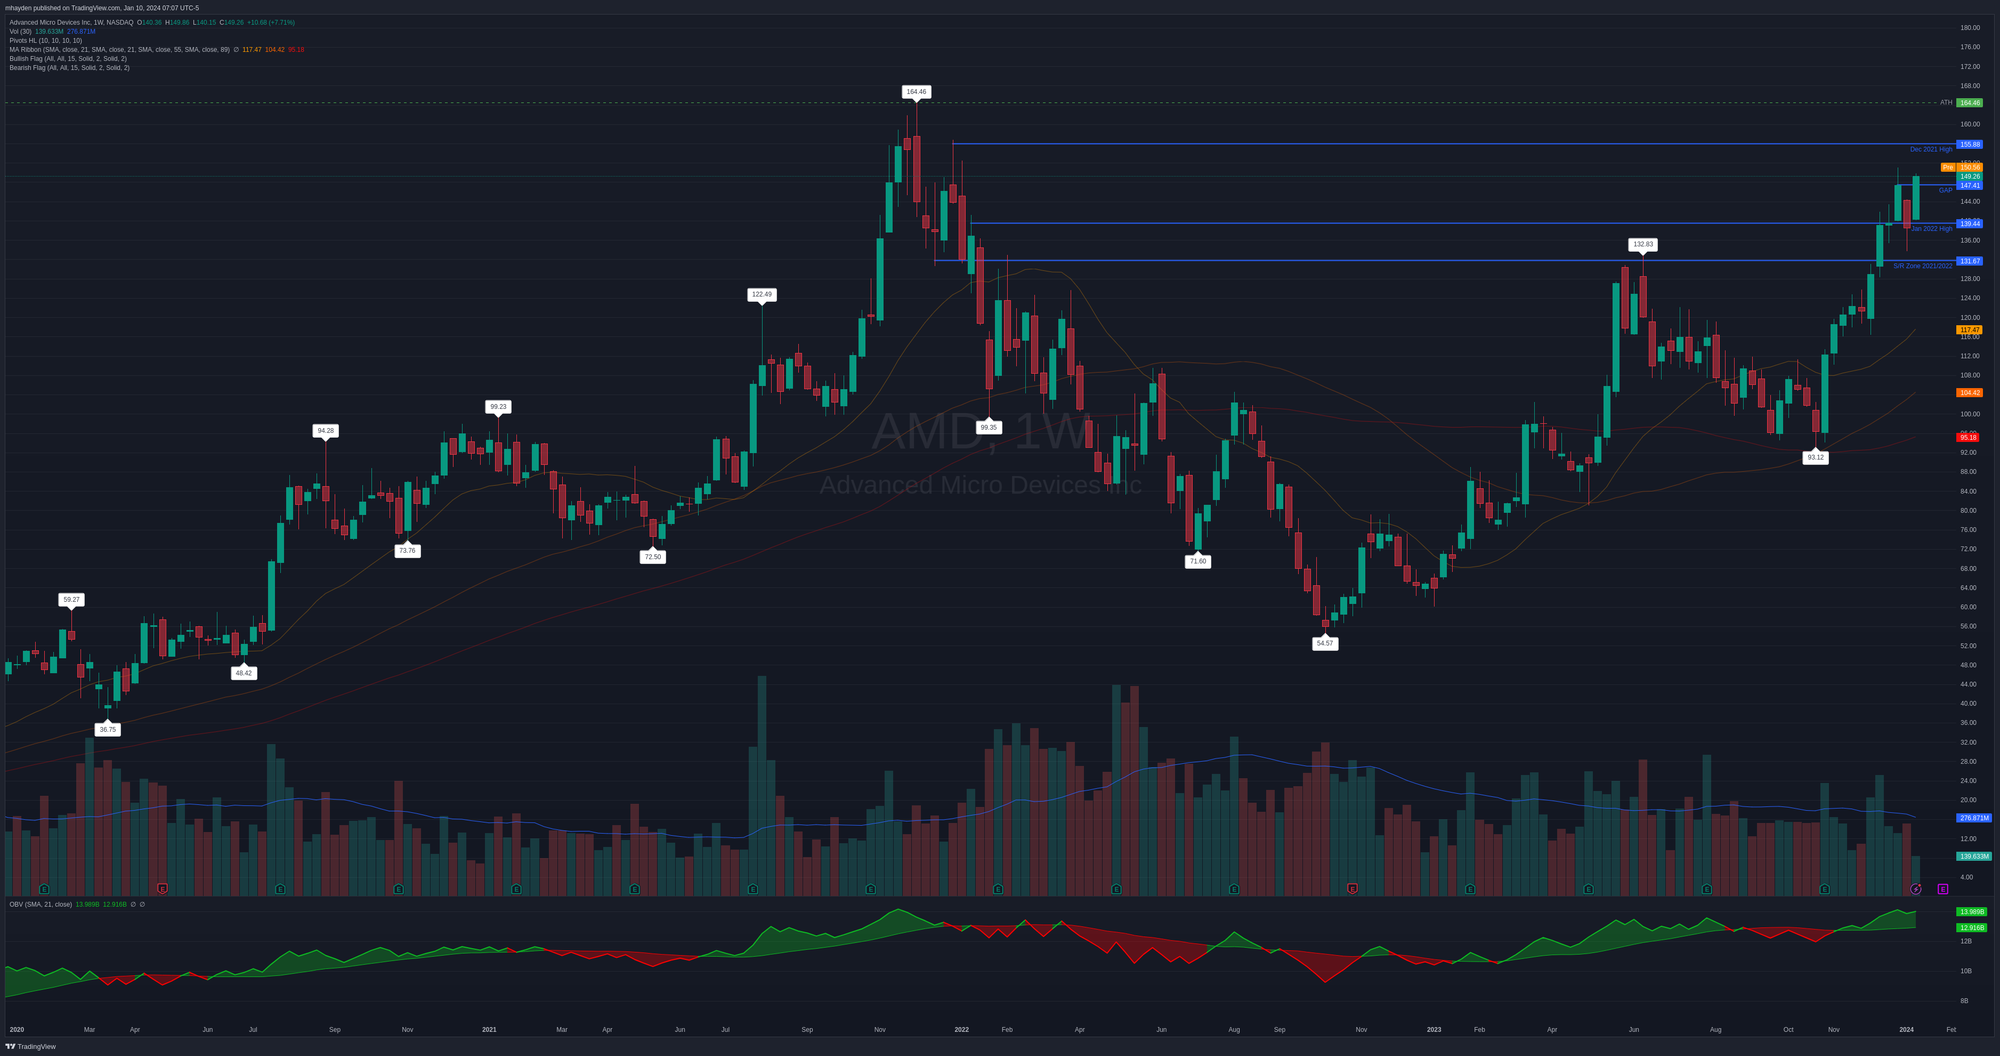
It's always a good idea to zoom out and observe the long term trends! Since COVID, AMD has rallied from the $30-$60 range up to the $160s, back to the $50s and now back to the $140s!
We're in a situation now where three moving averages (21, 55, and 89 weeks) are properly stacked and pointed upwards. Our last big cross was in October when the two longest term moving averages made a bullish cross.

The bottom indicator on this chart is a regular on balance volume indicator with a 21 period simple moving average applied. Bullish indications come from a green OBV line (the one with pointy edges) above the moving average line (the smoother one). Green indicates that most of the volume is bullish and it's bullish enough to cross the moving average. Red means the opposite.
The bear flag from 2022 erupted into a rally that saw AMD fly from $93 to $150! That move was done on strong volume, especially after the last week of November.
Medium term
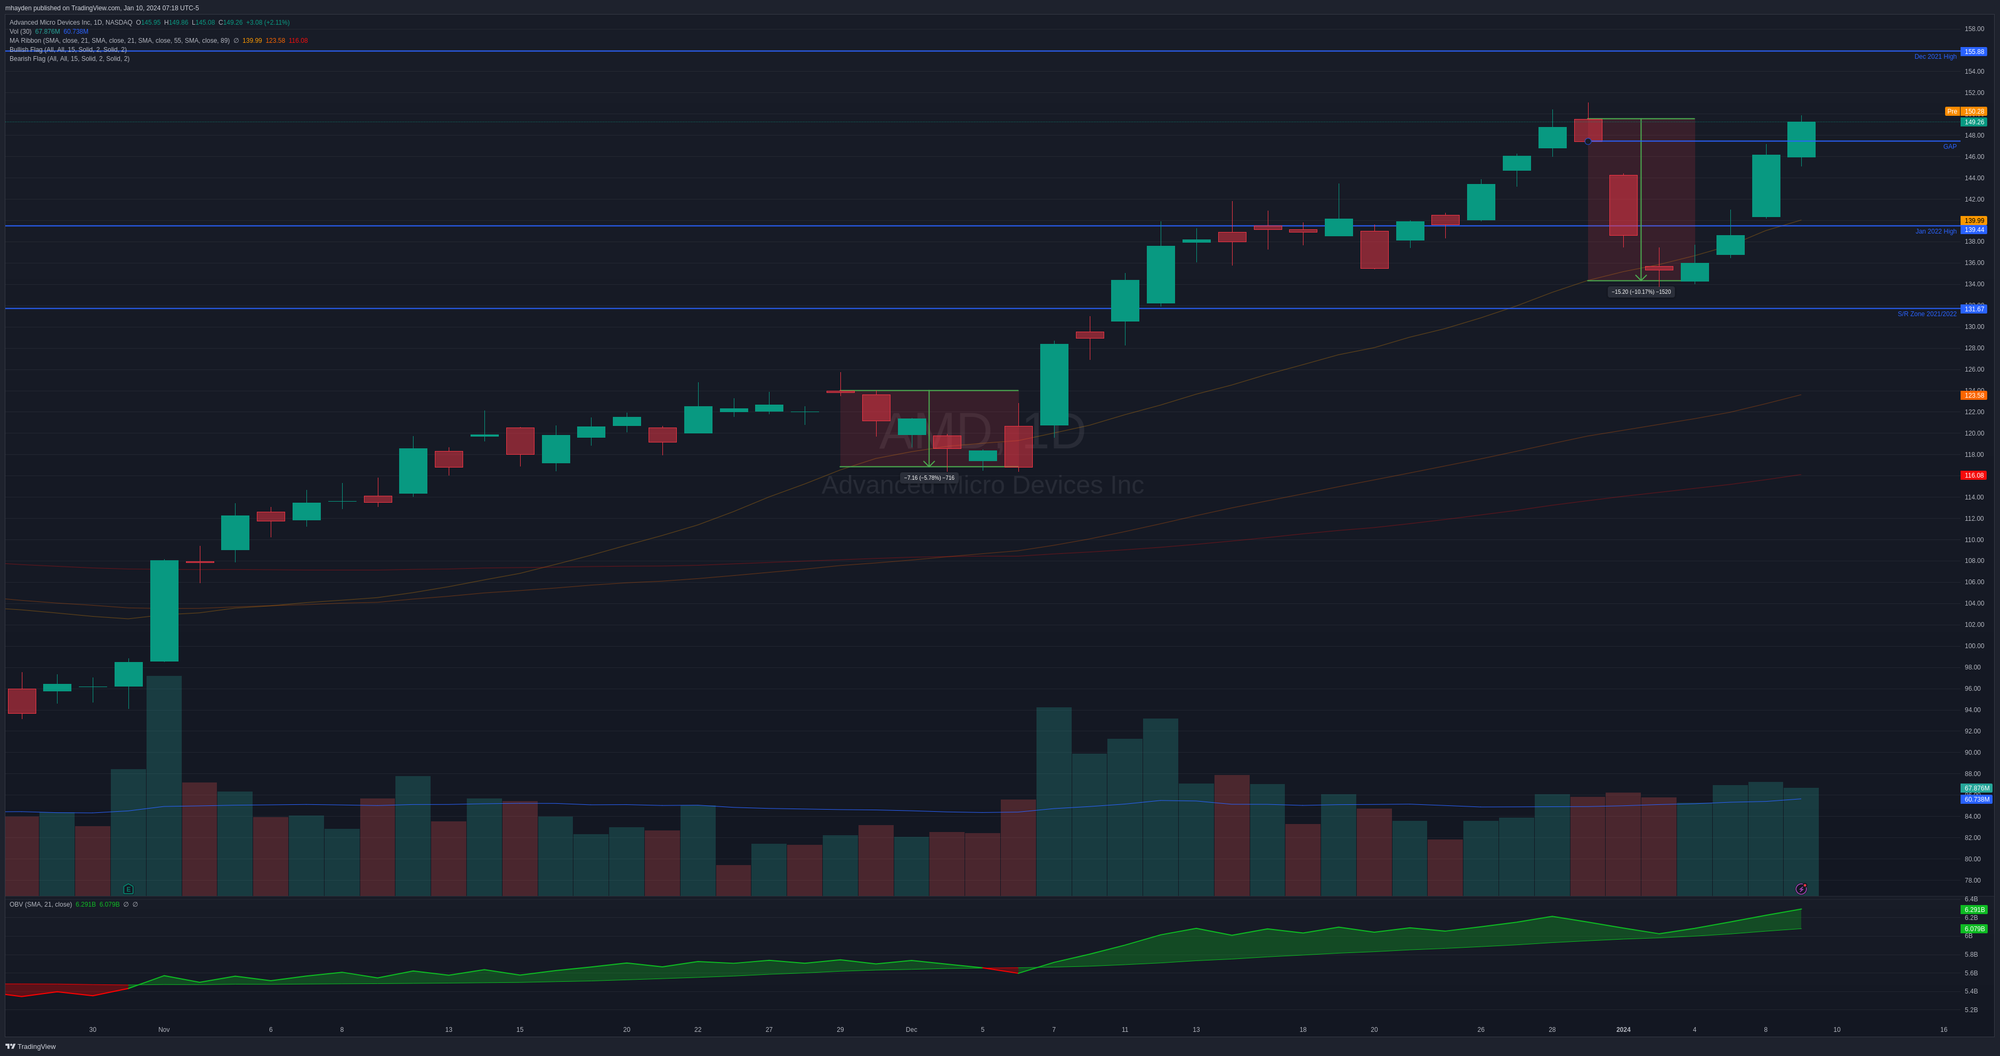
Let's analyze the moves since the Thanksgiving rally.
First, AMD consolidated around the $115-$122 range where it struggled many, many times before. I've talked about this level on the blog many times as being a level that AMD must conquer before a move higher is possible. It conquered that level on December 7th with a ton of volume.
Since then, AMD climbed over another critical level around $131, which was a support/resistance zone dating back to the end of 2021. AMD has bounced on or around this level many times before. It also crossed a January 2022 high that was hit on good volume.

AMD's volume has supported this upward move with a couple of small breaks. The early December pullback was 5.78% and the most recent one in January was 10.17%. These "breathers" in the market offer entry opportunities and they're often spots where some traders choose to take profits and/or re-balance their account.
Short term
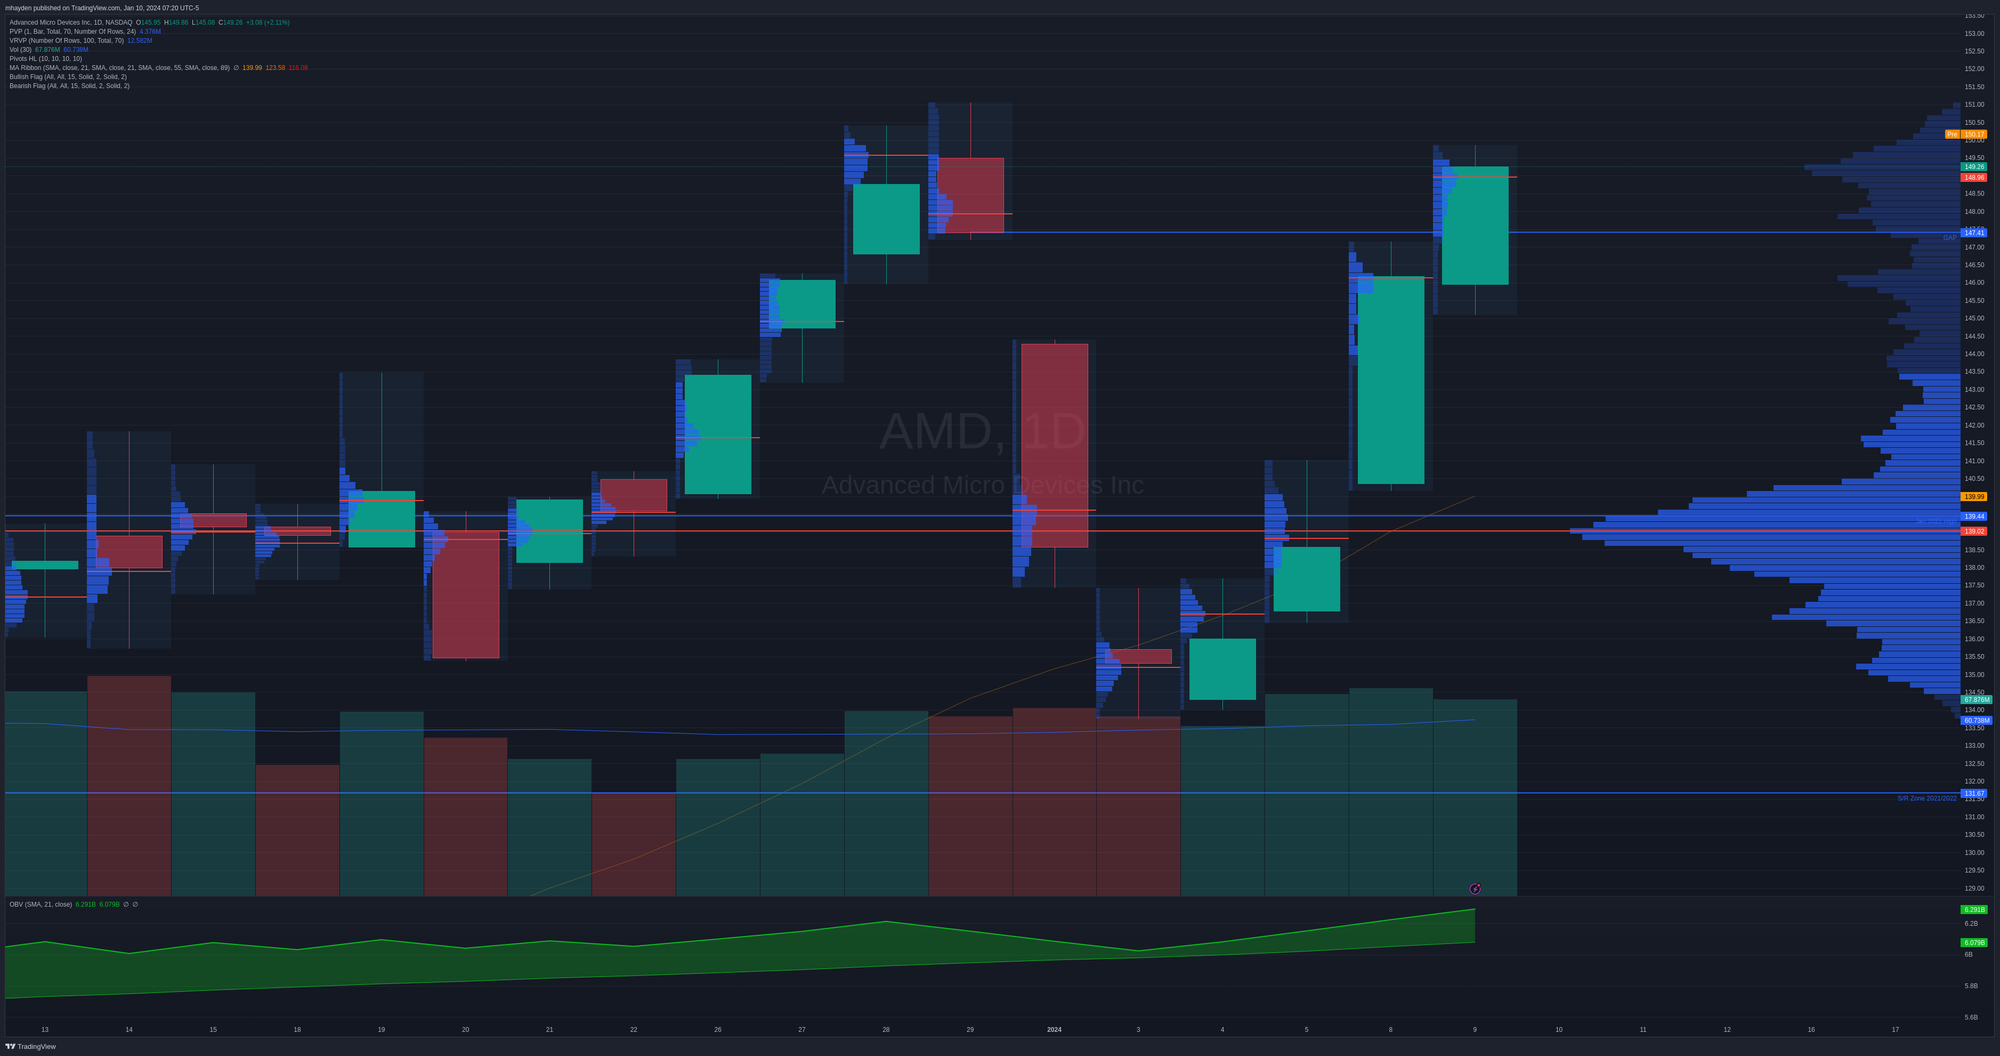
It's time for a look at the very recent moves since the December consolidation. There's a lot going on in this chart, so let's break it down step by step. Everything here revolves around volume.
First, the blue bars against the right edge of the chart tell us where the majority of the volume is focused on the bars that we can see. The bright red line is the point of control (PoC) of the volume by price (VBP) indicator. This shows where the majority of the volume is centered across all of the bars shown. This is often a good indication of where support is in the market.
The VBP indicator also shows a series of blue bars. Longer bars indicate higher volume at certain price levels. Brighter colored bars show where 70% of the volume resides and darker color bars show where the remaining 30% of the volume sits.
Put all of this together and AMD's highest volume zone is around $139 with 70% of the volume falling between $143.25 and $134.50.

How about those weird markings on the bars themselves? I'm glad you asked!
These bars have VBP indicators overlaid on them. For each bar, the red line across it indicates where the majority of the volume (the point of control) sits on each bar. If we look at the last four trading days (green bars), the PoC is either at the top of the bar or above the bar. This indicates that the majority of AMD trades are happening above the close price. The volume over the last four days exceeds the moving average of the volume bars as well.
For me, this screams strong price movement. 📣
Thesis
Now we can put all of this together:
- Weekly chart shows a sustained rally with bullish volume confirming
- Daily chart since November shows a rally with some 5-10% pull backs
- Highest daily volume since the late December consolidation is at the top of the bar or totally above the close
- AMD crossed several critical levels over the past month and crushed the last December gap yesterday
So what's next? If we cross the recent Dec 2023 high of $147.41 (which looks likely), our next stop is $155.88. That high takes us all the way back to Dec 2021! The only stop after that is $164.46 – the all time high. There are no landmarks to examine after that.
How am I trading this one? I've been picking up shares gradually (buying into strength as Tom suggests!) and I have several short puts and a short call.

I've been picking up shares during the move up as well over the past few days:

My shares are up 3.43% so far and I have a 2% trailing stop applied on them. I'm up almost 10% across the board on the short puts, but my $165 short call is not looking great. I sold that one out of frustration before my trading reset and I'm not happy with it. This might be a loss I cut soon.
I don't really have a profit target set for the long stock trade yet. I'll monitor price and volume closely to see if the current trend is weakening. As for the options trades, I exit those at 50% since I set the closing order immediately after selling those options.
Good luck to everyone today! 🍀


Discussion