AMD analysis for September 21

AMD fell to a support level overnight. Where is it headed now? Let's dig into the data. 📈

Good morning! 🌄 We received the news yesterday that the Federal Reserve plans to keep rates steady for September and the initial reactions to that news and the following news conference were mixed.
Then everyone seemed to head for the exits. 📉
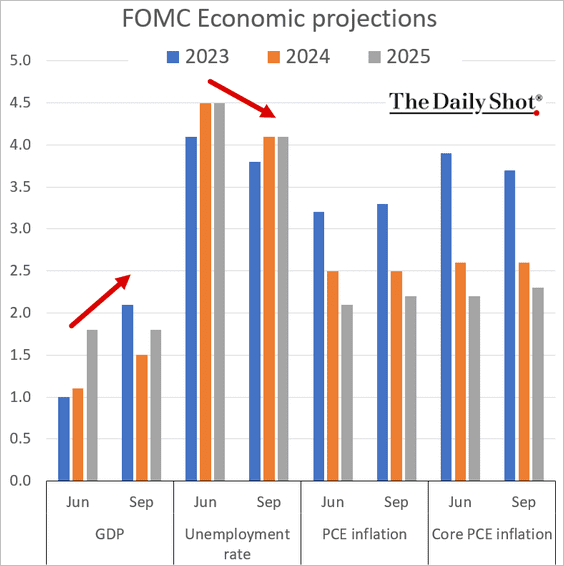
Most of my watch list is in the red today but they're lingering around some critical support levels. At first glance, a pause in raising rates seems good for the market, but the projections indicate that we're likely not finished with hikes and interest rates may remain high for a longer term:

On the bright side, the Fed's predictions for the economy were a little more optimistic:
All investments come with significant risks, including the loss of all capital. Please do your own research before investing, and never risk more than you are willing to lose. I hold no certifications or registrations with any financial entity.
Let's get back to AMD and see what's going on today.
Options flow
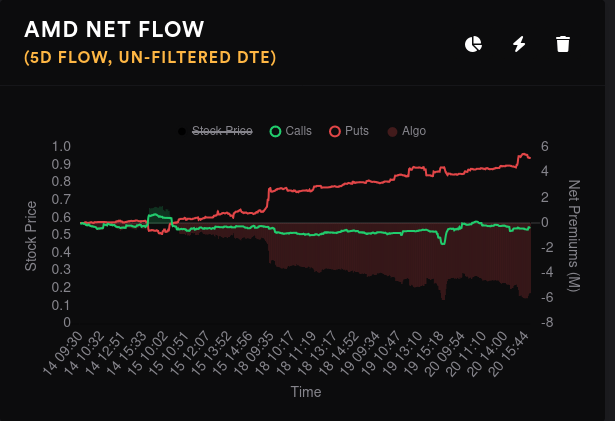
AMD's flow started some bearish moves on September 15th and continued since then. Note that calls have not really sold off much as puts have increased.
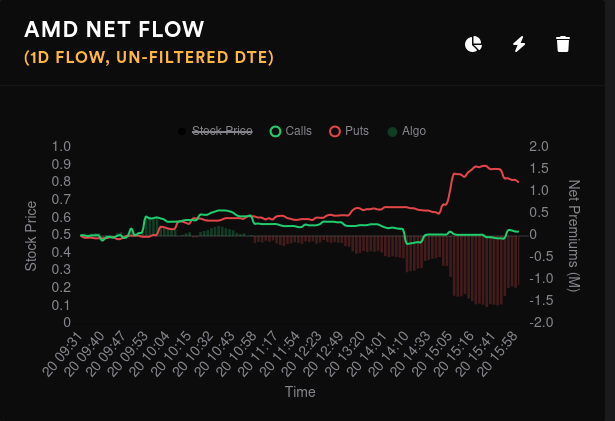
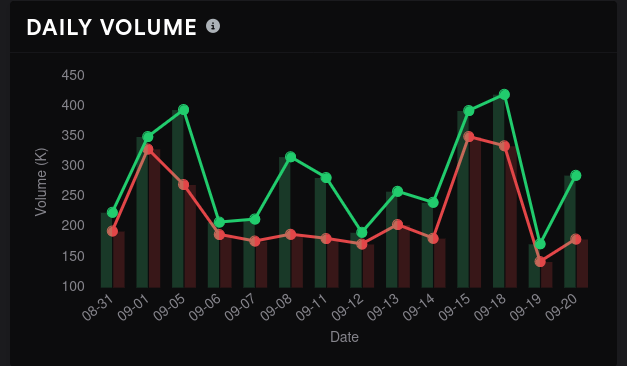
As you might expect, traders had their bets pretty much lined up earlier this month and volume increased yesterday as traders adjusted their positions. Open interest fell off like a rock from Friday to Monday, but we had the big quarterly OPEX on Friday. Traders got right back into the mix with more contracts starting Tuesday.

Vanna
I've talked about it for quite a while on this blog, but AMD has had positive vanna for quite some time. As a reminder:
- Positive vanna + contracting implied volatility = bullish price pressure
- Positive vanna + expanding implied volatility = bearish price pressure
My assumption was that IV would crush after the Fed's release, but there was a chance of IV expansion if they released something unexpected. The possibility of higher rates for a longer period, the possibility of another hike, and Powell's comments on the "soft landing" likely had some impacts on the VIX.
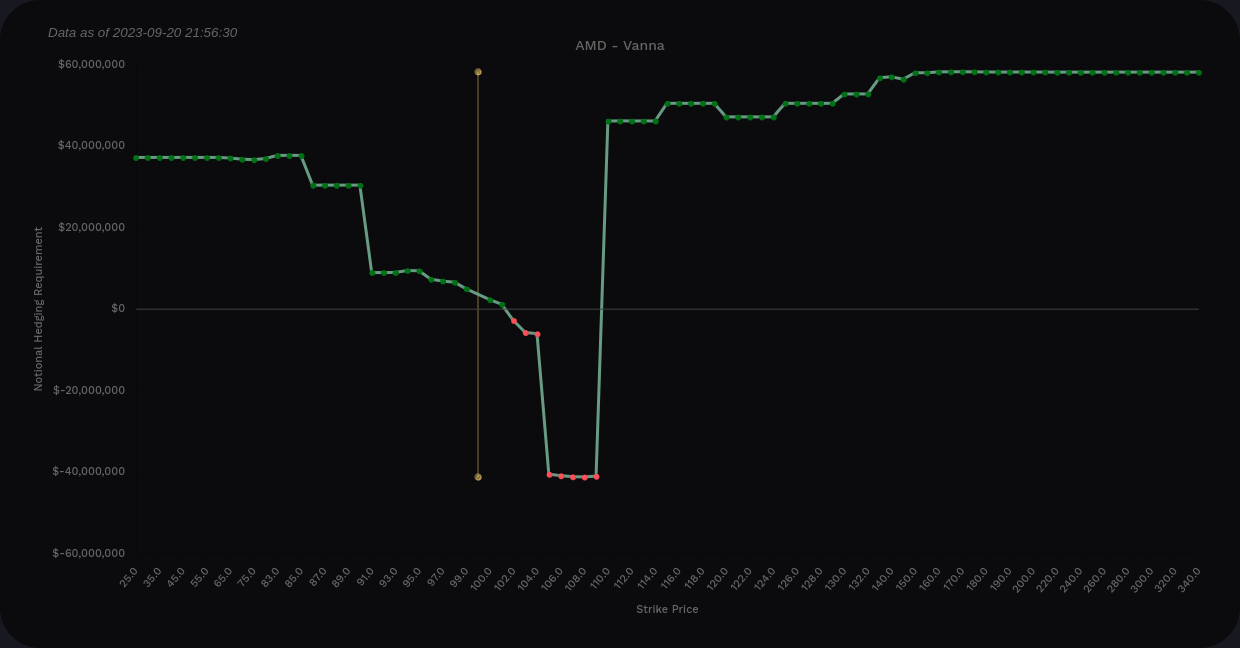
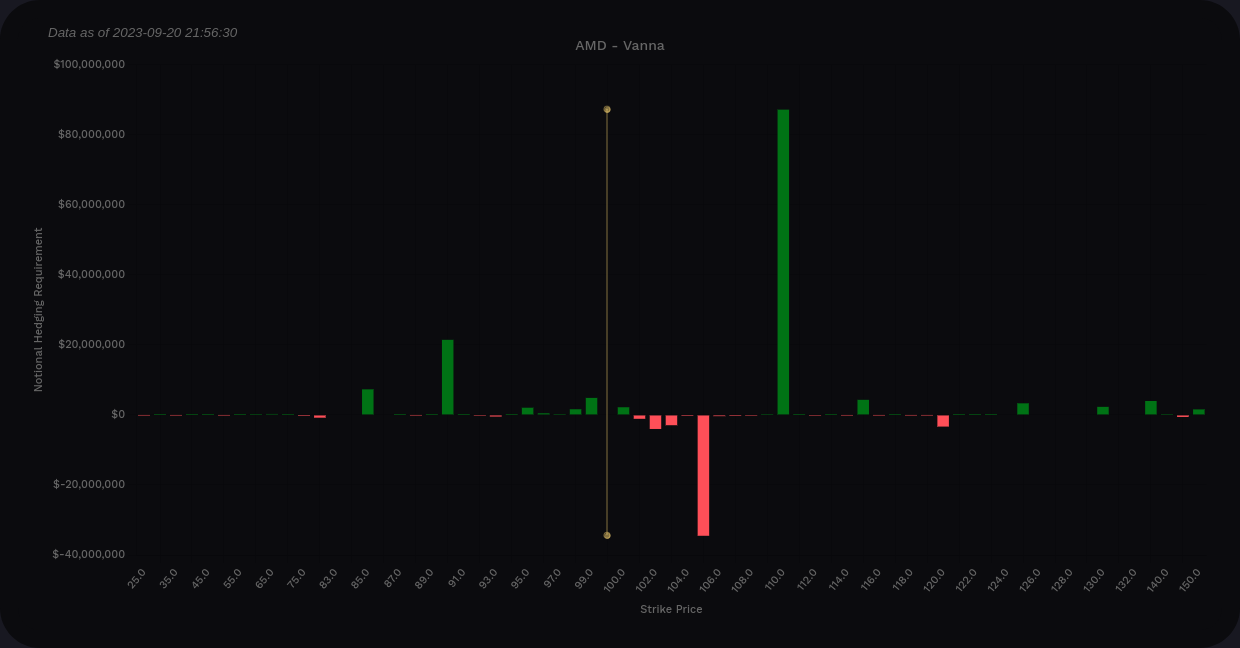
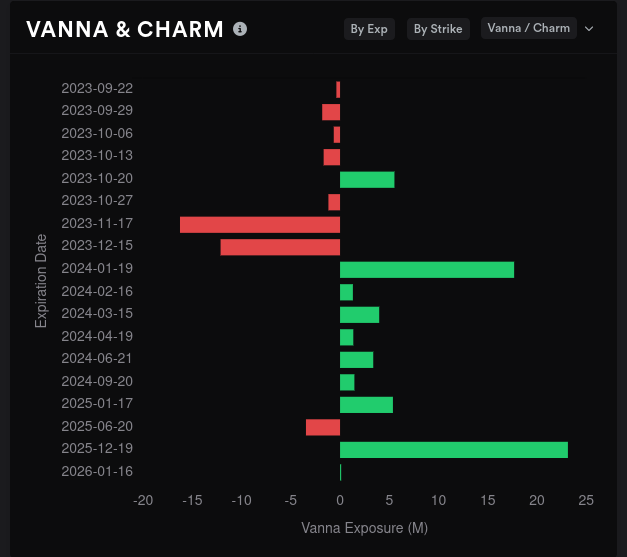
Volland's vanna charts show overall positive vanna with $110 as a potential price target if IV contracts. $105 will work against that move and may provide some temporary resistance to a move to the upside even if we get a significant IV contraction.
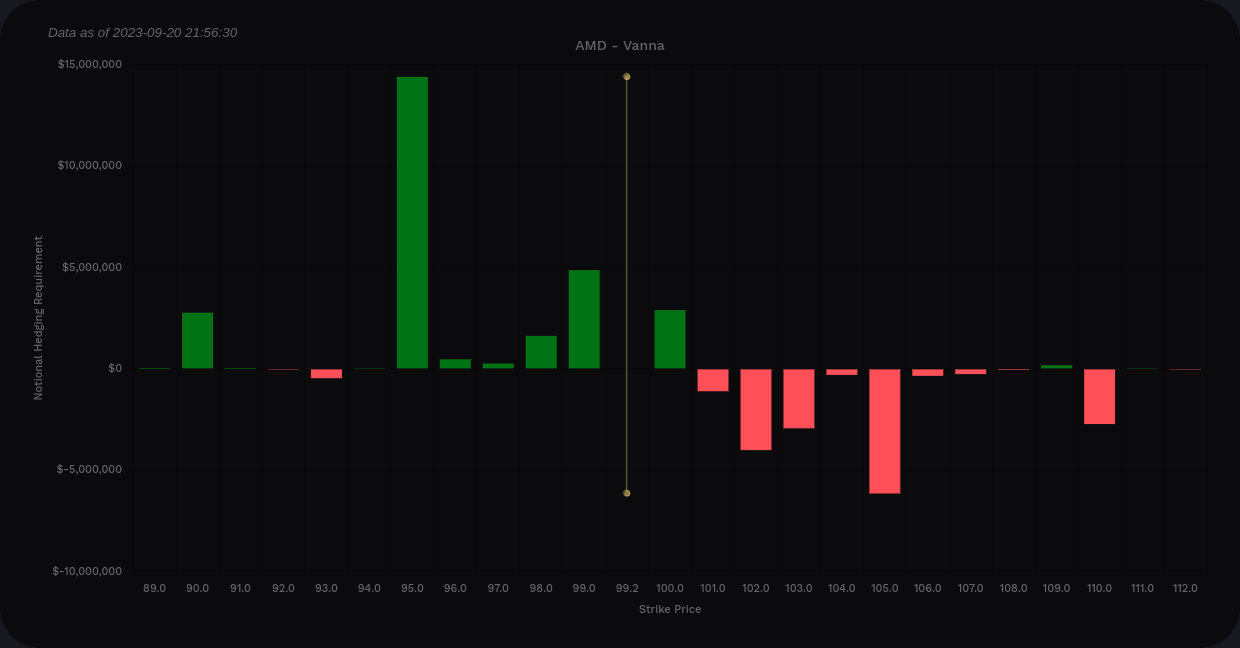
AMD's vanna from now through 10/20 suggests prices will be pinned in between $95-$105 at the extremes. The biggest bar is a negative one at $105. There's not a lot here that gives me a strong bullish feeling.

11/17 adds a little more bullishness to the chart, but not by much. Vanna is positive by about a 5:3 ratio here with a strong positive level at $95 but this chart suggests some sideways trading to me. Bear in mind that this expiration is after AMD's 10/31 earnings call. 🎃
Gamma exposure
So far, vanna suggests we're stuck in a $95-$105 range for the next two months. Can GEX confirm that or will it suggest something different? 🤔
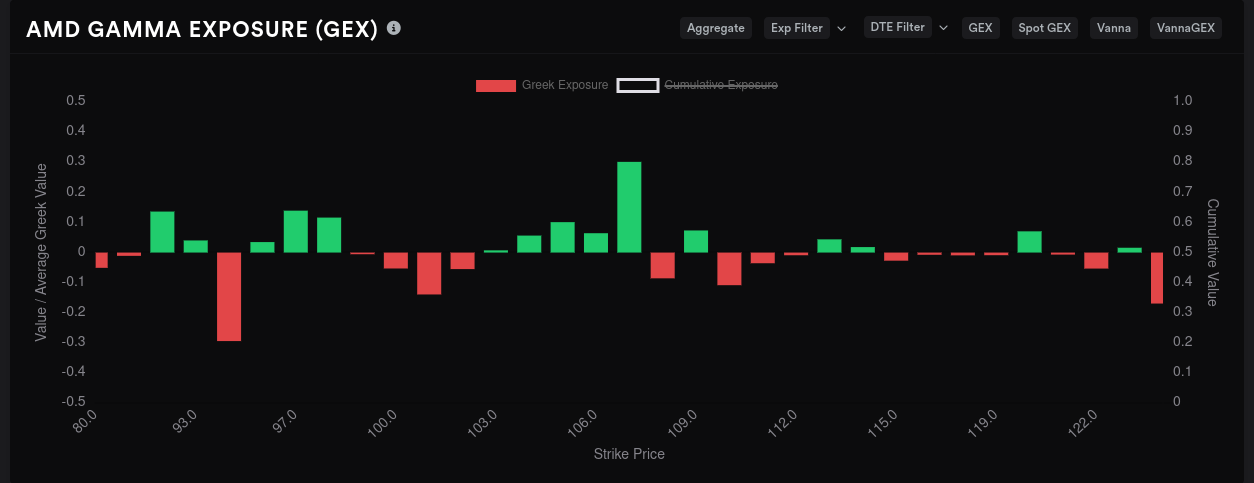
Aggregate GEX shifted down to $95 as the biggest target and our $115 level nearly disappeared. A resistance zone from $103-$107 could slow an upside move.
Our biggest GEX expirations are 11/17 and 10/20.

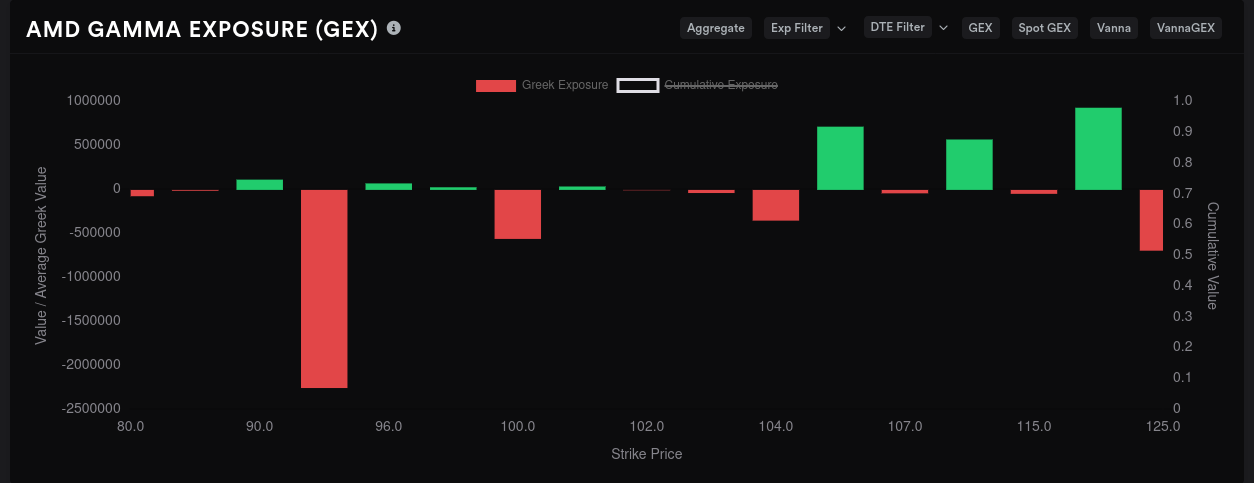
10/20 GEX suggests $95 as the price target without any other levels coming close. Our familiar resistance level around $105 is back.
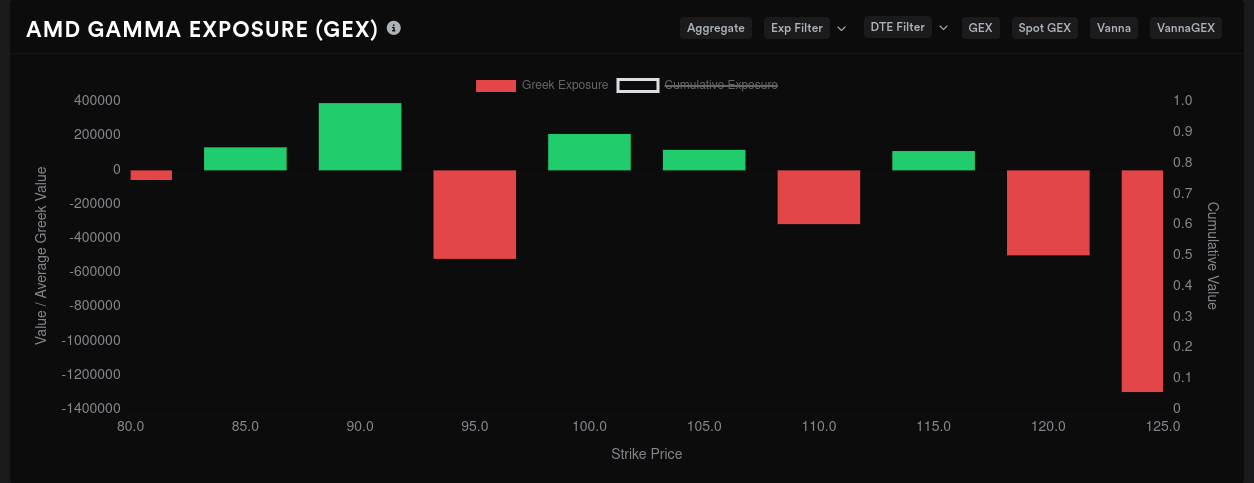
11/17 still has a decent amount of negative GEX at $95, but the top end opens up here after the earnings call. $125 is the biggest magnet for price with $95 and $120 tied for second place. Resistance is light, but this expiration date is still fairly far away.
Other options data
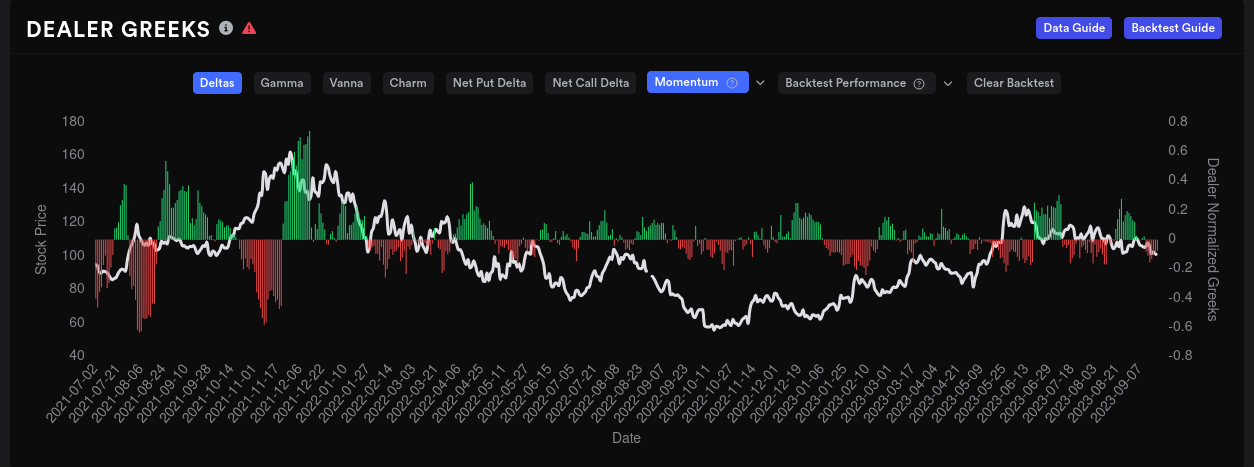
Even with yesterday's drop, dealer delta buildup is still short and that suggests customers who are long are still there. Calls have not sold off aggressively yet but put premiums have increased.
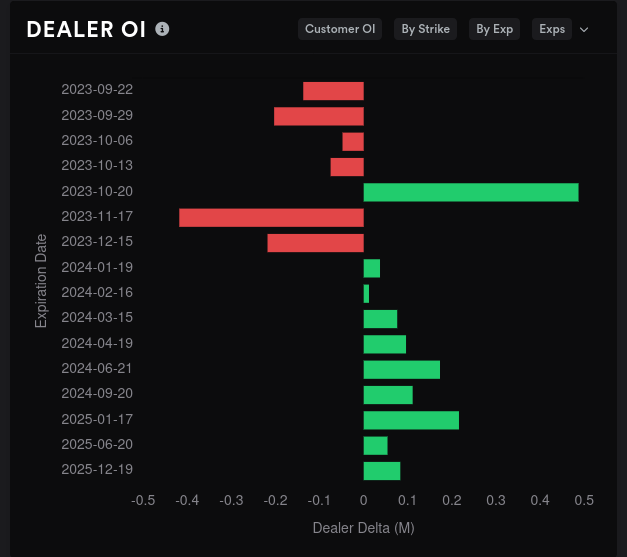
Dealer OI shows plenty of indecision across the board and x-axis is very small for AMD. Nobody seems to be taking a big position or big bets in either direction. However, we're tilting bullish until 10/20 and then we tilt bullish again through the remainder of the year.
Vanna is largely positive across the board with some negative vanna showing up for 11/17 and 12/15.
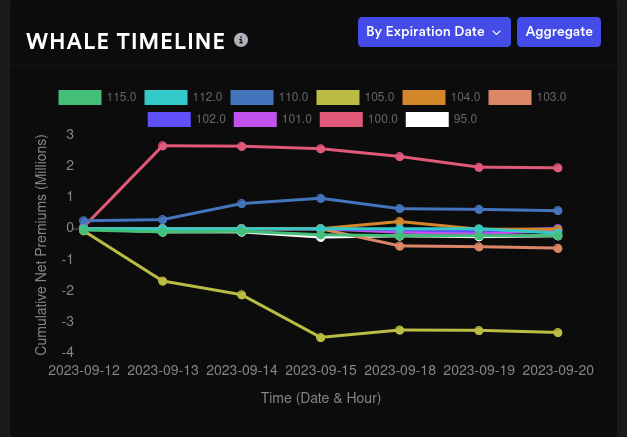
Whales are doing some interesting things with AMD. Traders went bearish on $100 and $105 yesterday and that's not a surprise. What did surprise me is that some traders made big bullish bets on $110 on 9/13 and increased those holdings yesterday.

Whale trades for 10/20 show bullish movement on $100 and bearish movement on $105. These bets were made before the Fed release rates and neither side seems to have budged much from their holdings here.
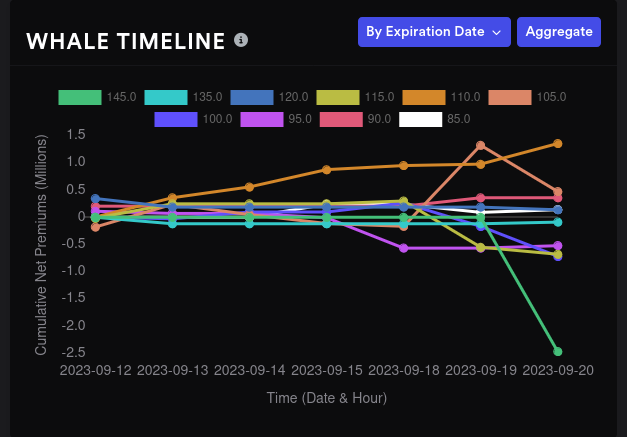
11/17 shows a relatively large bearish bet on $145 and a steady increase in bullish bets on $110. This is after earnings, so the $145 could be some type of hedge. I do like seeing a slow and steady increase in bets for $110 here.
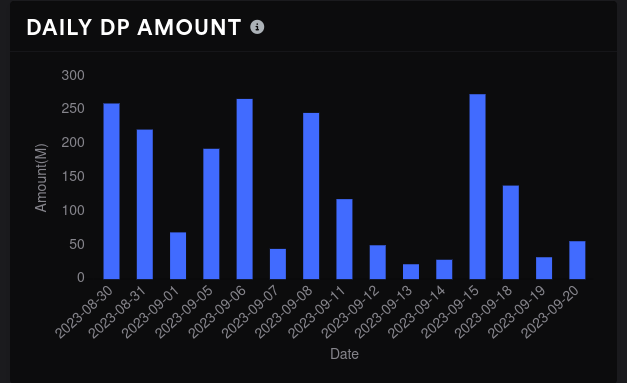
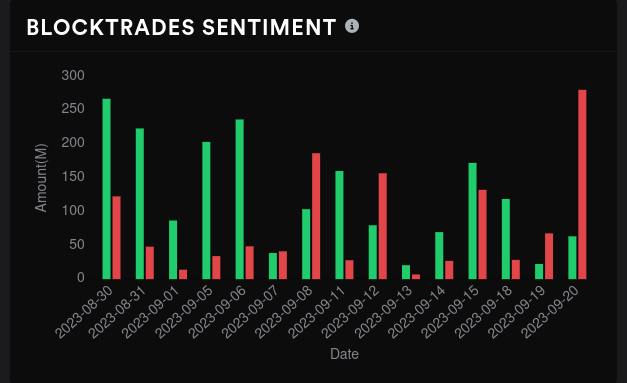
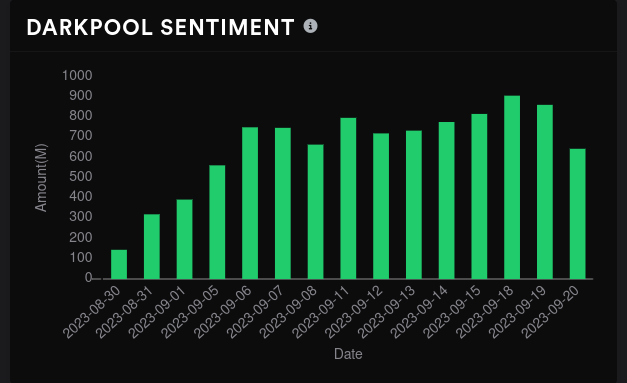
Dark pool data
Dark pool trades aren't something I really hang my hat on for AMD but I do like to see if they correlate some of my other findings. It's really important to look at these four charts in context.
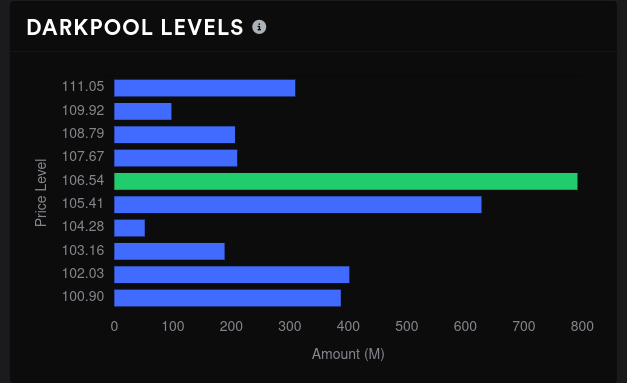
Bears won yesterday's dark pool trading by a huge margin, but be sure to look at the volume relative to most days. Dark pool volume was very low. Sentiment remains quite bullish and our $105-$106 range still has a ton of volume. We have another volume shelf at $100 that could provide some support. I can't see what's below that level for now.
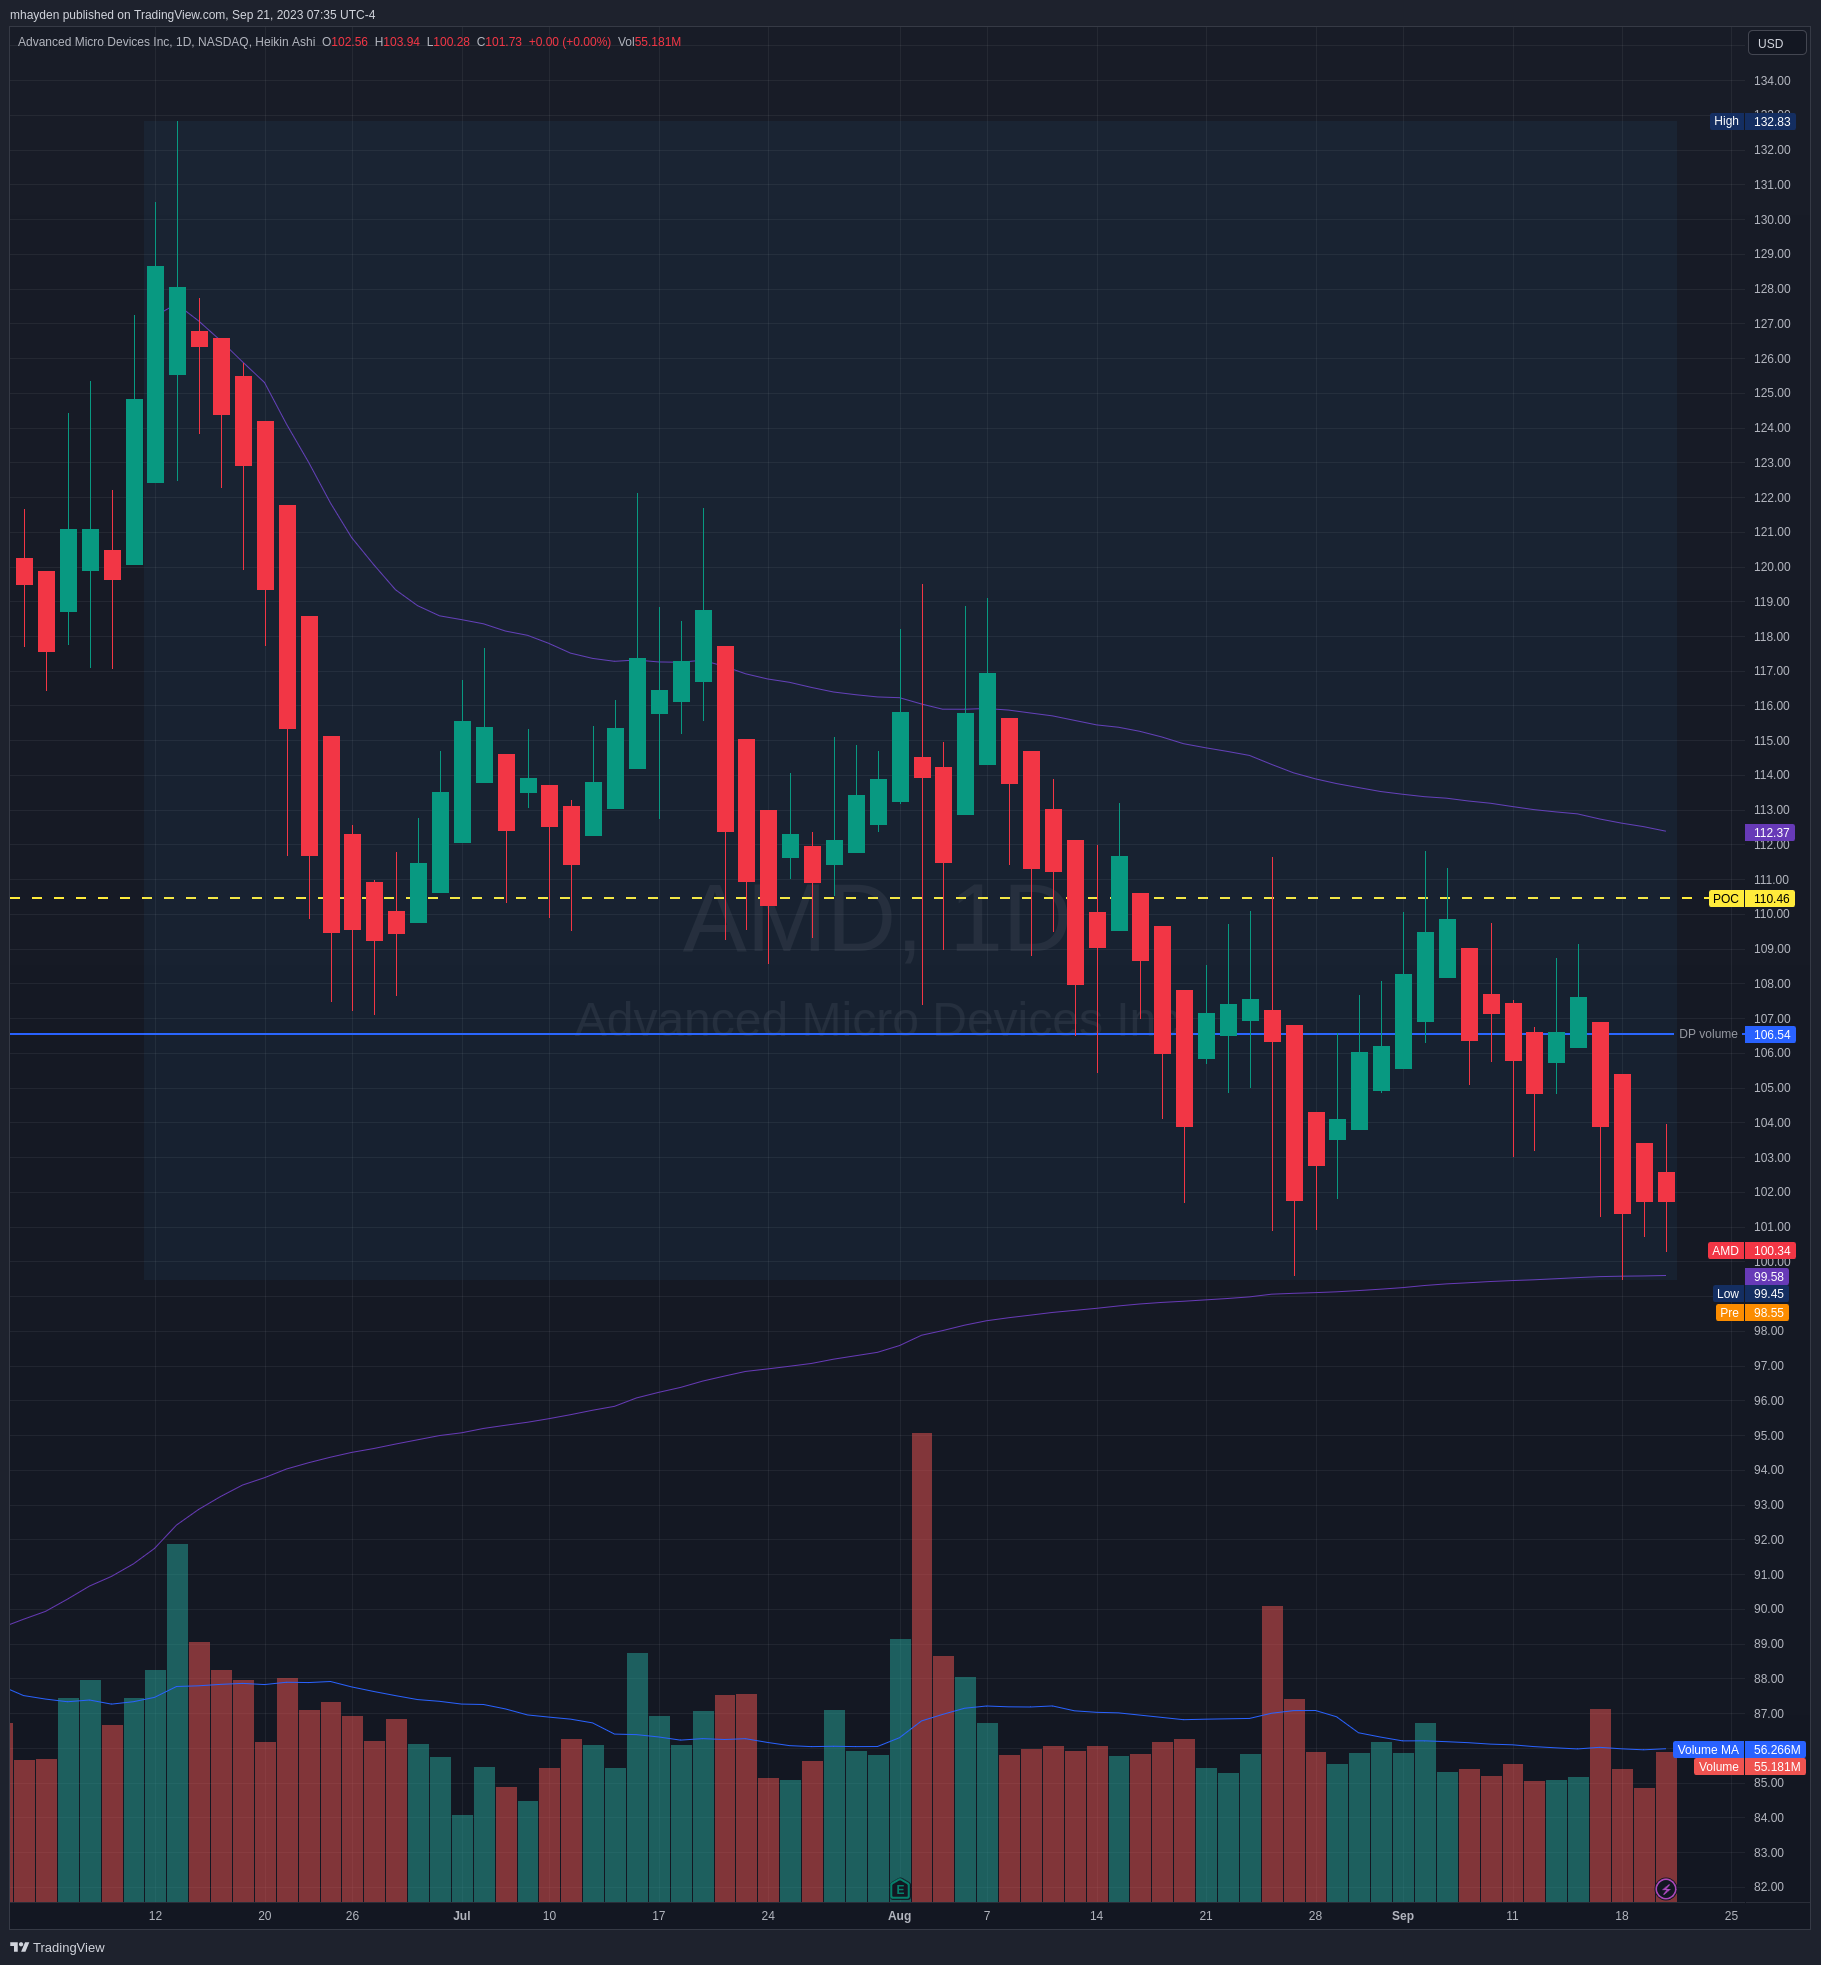
Chart
AMD is sitting below its lower VWAP before the market opens today. That VWAP came up from the January 2023 pivot and AMD has bounced off this line multiple times. Will it do it again?
The point of control from the volume by price indicator has not budged much from the recent high even as AMD sank. $110 has been a constant volume level for weeks and that's a good sign. Also, the highest dark pool volume level moved up to $106.54 from yesterday's $105 level.
Thesis
AMD is at the bottom of its range right now and there are plenty of indicators that suggest we could find ourselves in the $95-$100 range soon with a potential bounce. What has me really perplexed is that dark pool volume is not moving down and the highest volume since the recent high remains firmly around $110. The highest volume since the pivot in January is also right around $110. 🤔
Sideways trading might be the plan through at least 10/20 with a possibility for opening up after earnings on 10/31. Aggressive traders might like to play the $95-$105 range as long as the contract ends before AMD's earnings.
More consevative traders could play the $90-$110 range as $90 sits below the largest GEX and vanna lines. $110 seems like a fairly strong resistance zone from dark pool data and volume on the chart.
As for me, my current cost basis on AMD sits around $86. I have some short puts at $101 and $104 for this Friday where I'll likely be assigned. I have another short $100 put for 10/20.
Good luck to everyone out there. 🍀
Discussion