AMD analysis for January 22
Eight days remain until AMD's earnings call, but where will it go before then? Let's take apart some charts and data to make a plan. 📈

Good morning! AMD continued to move higher through last week's volatility and options expiration dates. Earnings are coming up on January 30. TSM had a good quarterly report and SMCI recently said they were raising their guidance for their upcoming earnings report.
All investments come with significant risks, including the loss of all capital. Please do your own research before investing, and never risk more than you are willing to lose. I hold no certifications or registrations with any financial entity.
Let's get a look at AMD's charts and data.
How far AMD has come
AMD finished last week up over 17% and it's up 157% since January 20th of last year. 🤯

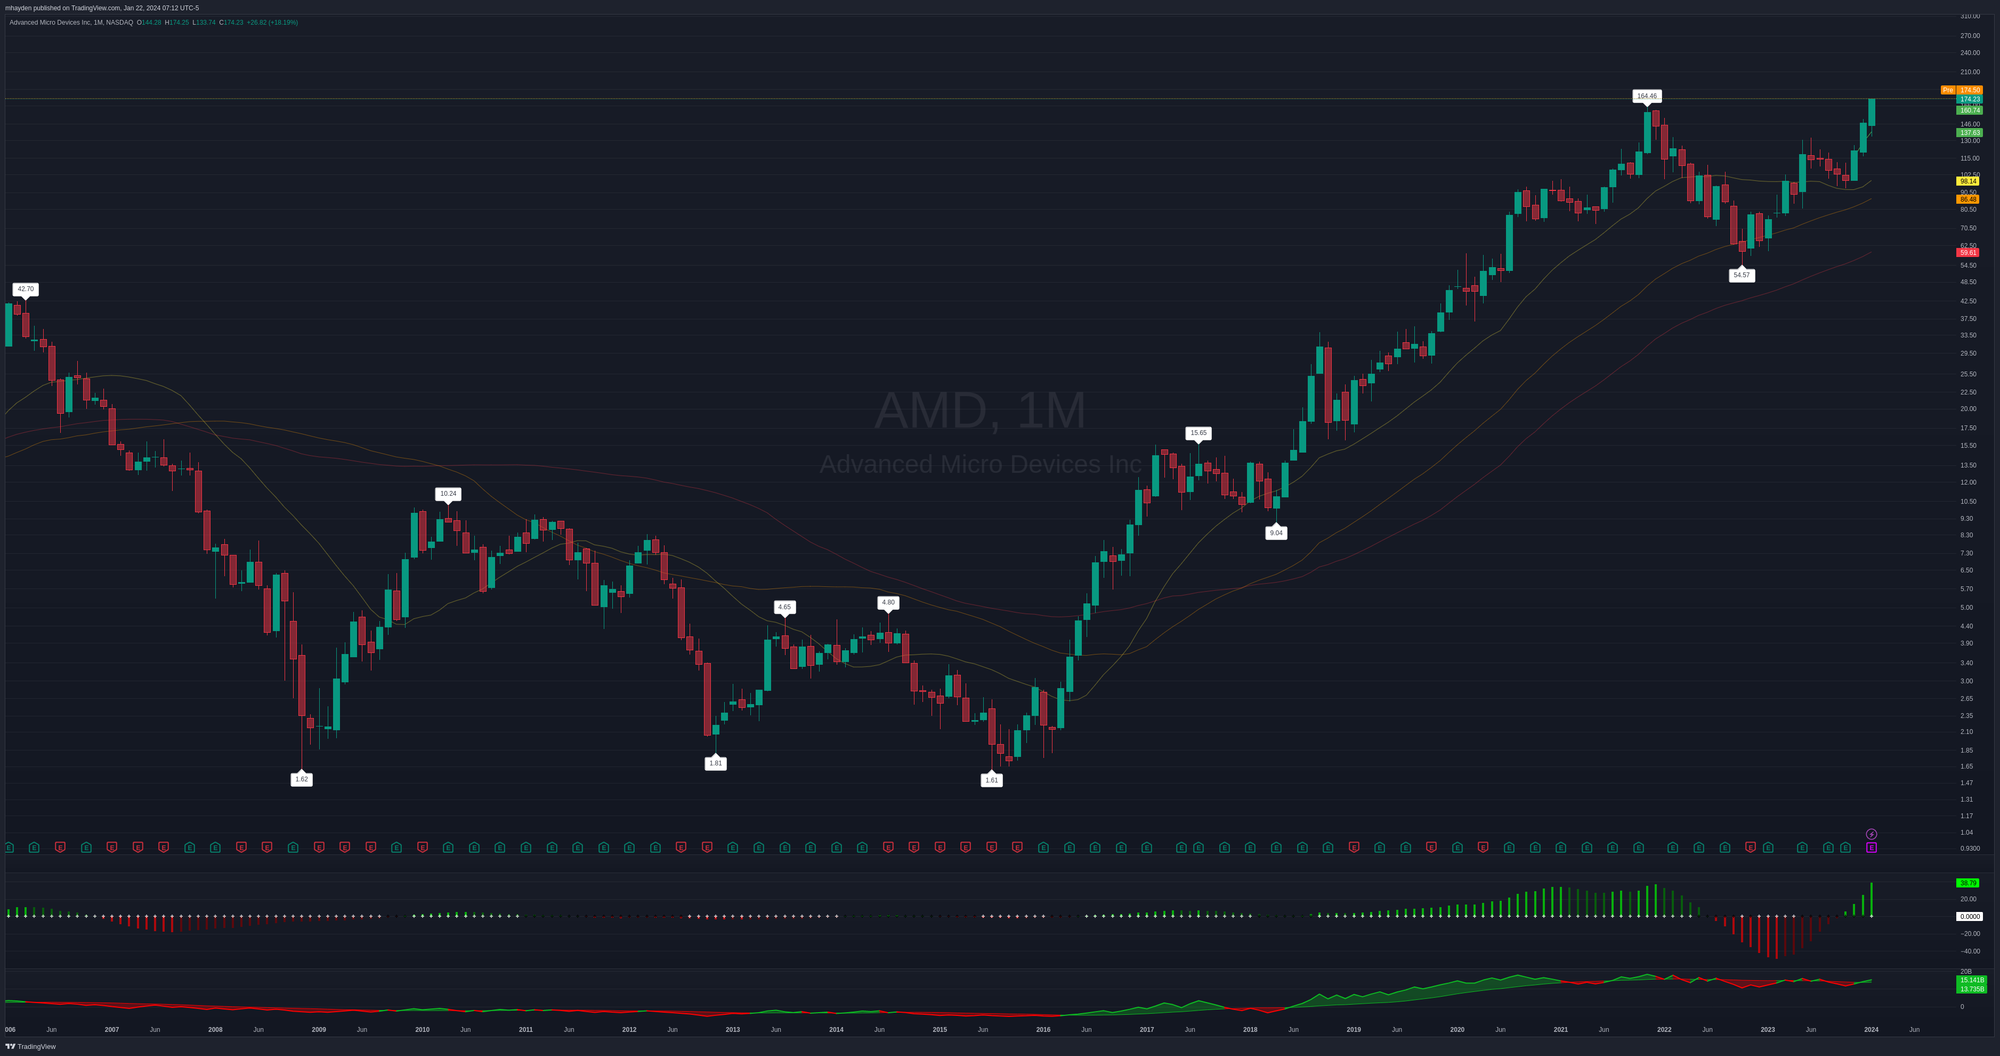
Past returns don't dictate what happens in the future, but these numbers are incredible. A monthly AMD chart since 2006 also tells a similar story:

AMD sits above all three moving averages (21/55/89 months) and recently made a new all time high. The last three months are all green following a slow slide down in the summer and fall of 2023.
Could we be looking at another leg of a bull run? Or, are we looking at a double top?
Let's zoom in a bit.
Since last earnings
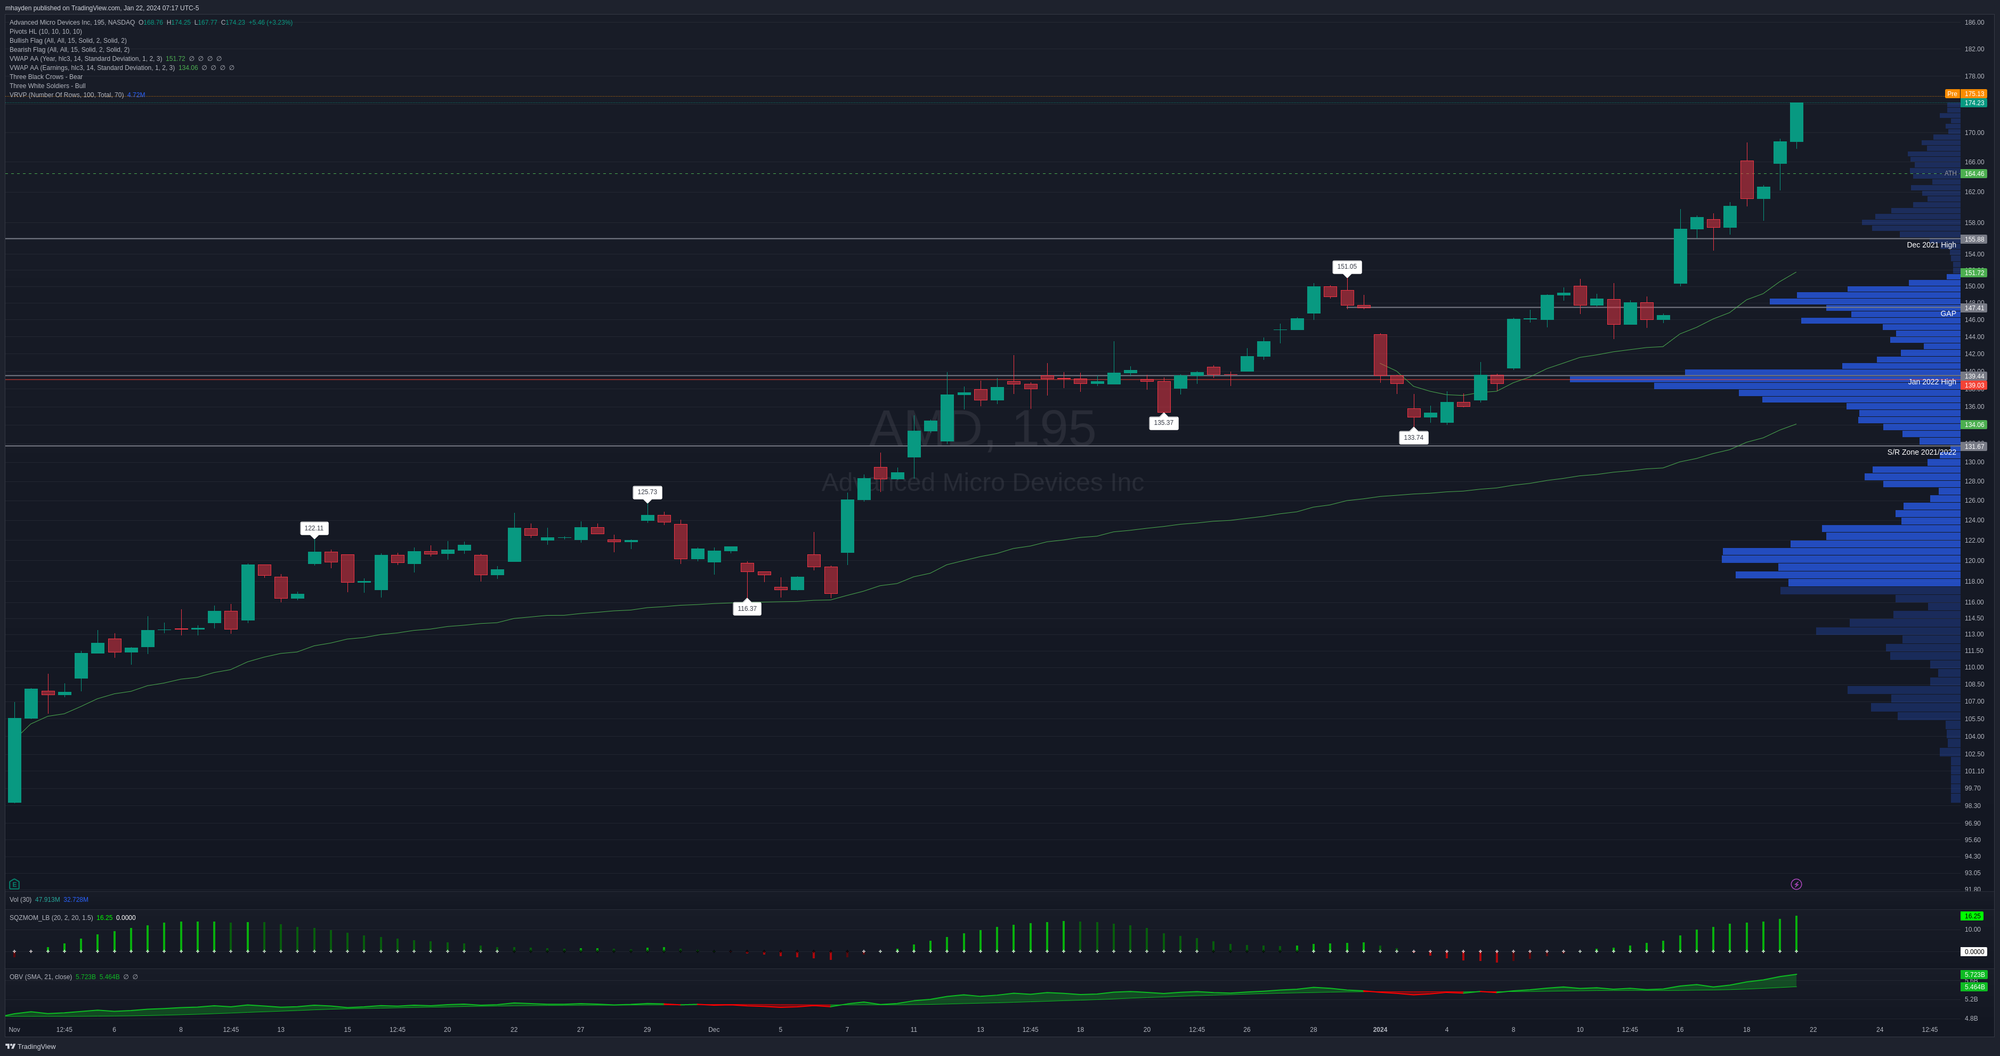
This next chart shows us the price action since AMD's last earnings call in November 2023. It's on a 195 minute time frame, which is about four hours. Each market day is 6.5 hours long, and 195 minutes is 3 hours and 15 minutes. This ensures that each bar measures the same amount of time during the trading day.
You'll see two thin green lines on the chart. One is a VWAP since January 1, 2024 and the other is a VWAP since the last earnings call. AMD found support on the earnings VWAP line back in December and then never touched it again. The YTD VWAP was broken on the first week of December, but then AMD rocketed above it and never looked back.
Both VWAP lines are tilted upwards and price continues to ride away from them. Seeing an extension here above the line is a strong bullish sign, but that extension can be difficult to maintain over time without more buyers joining in.

Volume by Price (VBP) on the right side shows the price where most of the trading occurred. The point of control (PoC) notes where the highest volume sits since earnings and that's around $139. That's also very close to AMD's January 2022 high.
We're well above any previous levels that AMD has set in the past, including the all time high around $164. If AMD were to retrace a bit, we pick up support at a few different levels:
- $164: ATH
- $151-$155: December 2021 high, low volume zone, YTD VWAP
- $143: Low volume zone
- $139: January 2022 high and VBP PoC
On the upside, it's difficult to determine where AMD might stop. Just have a look at the chart for SMCI for last week and think about trying to pick a top there. 👀

I'm reminded of a quote from Tom Hougaard's book here:

Institutional trades
Volume Leaders tracks large trades likely made my institutional trades for many ETFs and stocks. Here are the top five trades made since the last earnings call on November 1, 2023:

The site maintainer notes that even numbered share amounts in a particular trade often signal the opening of a new position, either long or short, while odd amounts often signal profit taking or adding to an existing position. All of the trades above are odd amounts except for #20 at the end of November. That one shows 4,460,400 shares traded. 🤯
These charts don't show directionality. That's left up to us to infer based on the charts and other data we can find. However, these big trades signal areas where institutions are interested in the price. They are good spots to mark on a chart.
AMD's yearly chart shows that we are certainly in uncharted territory:

Thesis
If you asked me what I thought AMD's chart in 2023, I would have been extremely fearful. Going long feels horrifying since AMD is up so high. Going short feels equally horrifying since there's no real way to guess where AMD might stop.
However, after reading Best Loser Wins, I'm approaching this differently. AMD shows strength in the current price movement and volume, so I'm going to buy into that strength and set a point where I'll exit my bullish trades if AMD does a meaningful retrace downwards. I'm going into the trade thinking I'll be wrong but I'll be happy to be proven right.
My exit point for the moment will be around $150-$155 for a few reasons:
- There's a VWAP line there from January 1st
- Volume is low from $150-$155 and this may act as support
- December 2021's high at ~ $156 was crushed and lightly tested afterwards
I had a bunch of short puts scattered from $135-$145 last week and I've rolled them up to $150 with an expiration date of March 15th. That's about 53 days away and it allows me to collect a decent amount of theta while also giving me a little more time to be right.
One of the lessons I learned last year is that although trading weeklies can be a lot of fun and the returns come through quickly, the increased gamma swing can wreck a short options trade in a hurry. I thought I could make money faster that way, but it turns out I can make just as much at 45-60 DTE with much less stress. 🌴
Good luck to everyone today! 🍀


Discussion