AMD at the 6/16 OPEX

As we approach the 6/16 OPEX, are we headed over a cliff? I'll break down the data I can see to make some conclusions.

This week brought us plenty of news that I figured would have shaken up the markets a bit more than it did. Also, we're at the quadruple witching point and that normally causes some odd price action.
Perhaps my normal for the market is a bit skewed by 2022, but it felt like the market took all of this churn with a much calmer approach than I expected.
However, Twitter is full of people screaming that we're going over a cliff. Cem Karsan got the internet all fired up about a potential downturn. Others are calling for pullbacks as breadth looks a bit euphoric and market participants are buying less insurance (puts).
The question I'd like to answer today is: are we headed towards a cliff?
All investments come with significant risks, including the loss of all capital. Please do your own research before investing, and never risk more than you are willing to lose. I hold no certifications or registrations with any financial entity.
Charts
Much of my trading is focused on AMD and SPY. AMD is more of my speculation play while SPY is usually something I buy and hold for longer periods.
Let's take a look at AMD on the daily chart with Heikin Ashi candles:
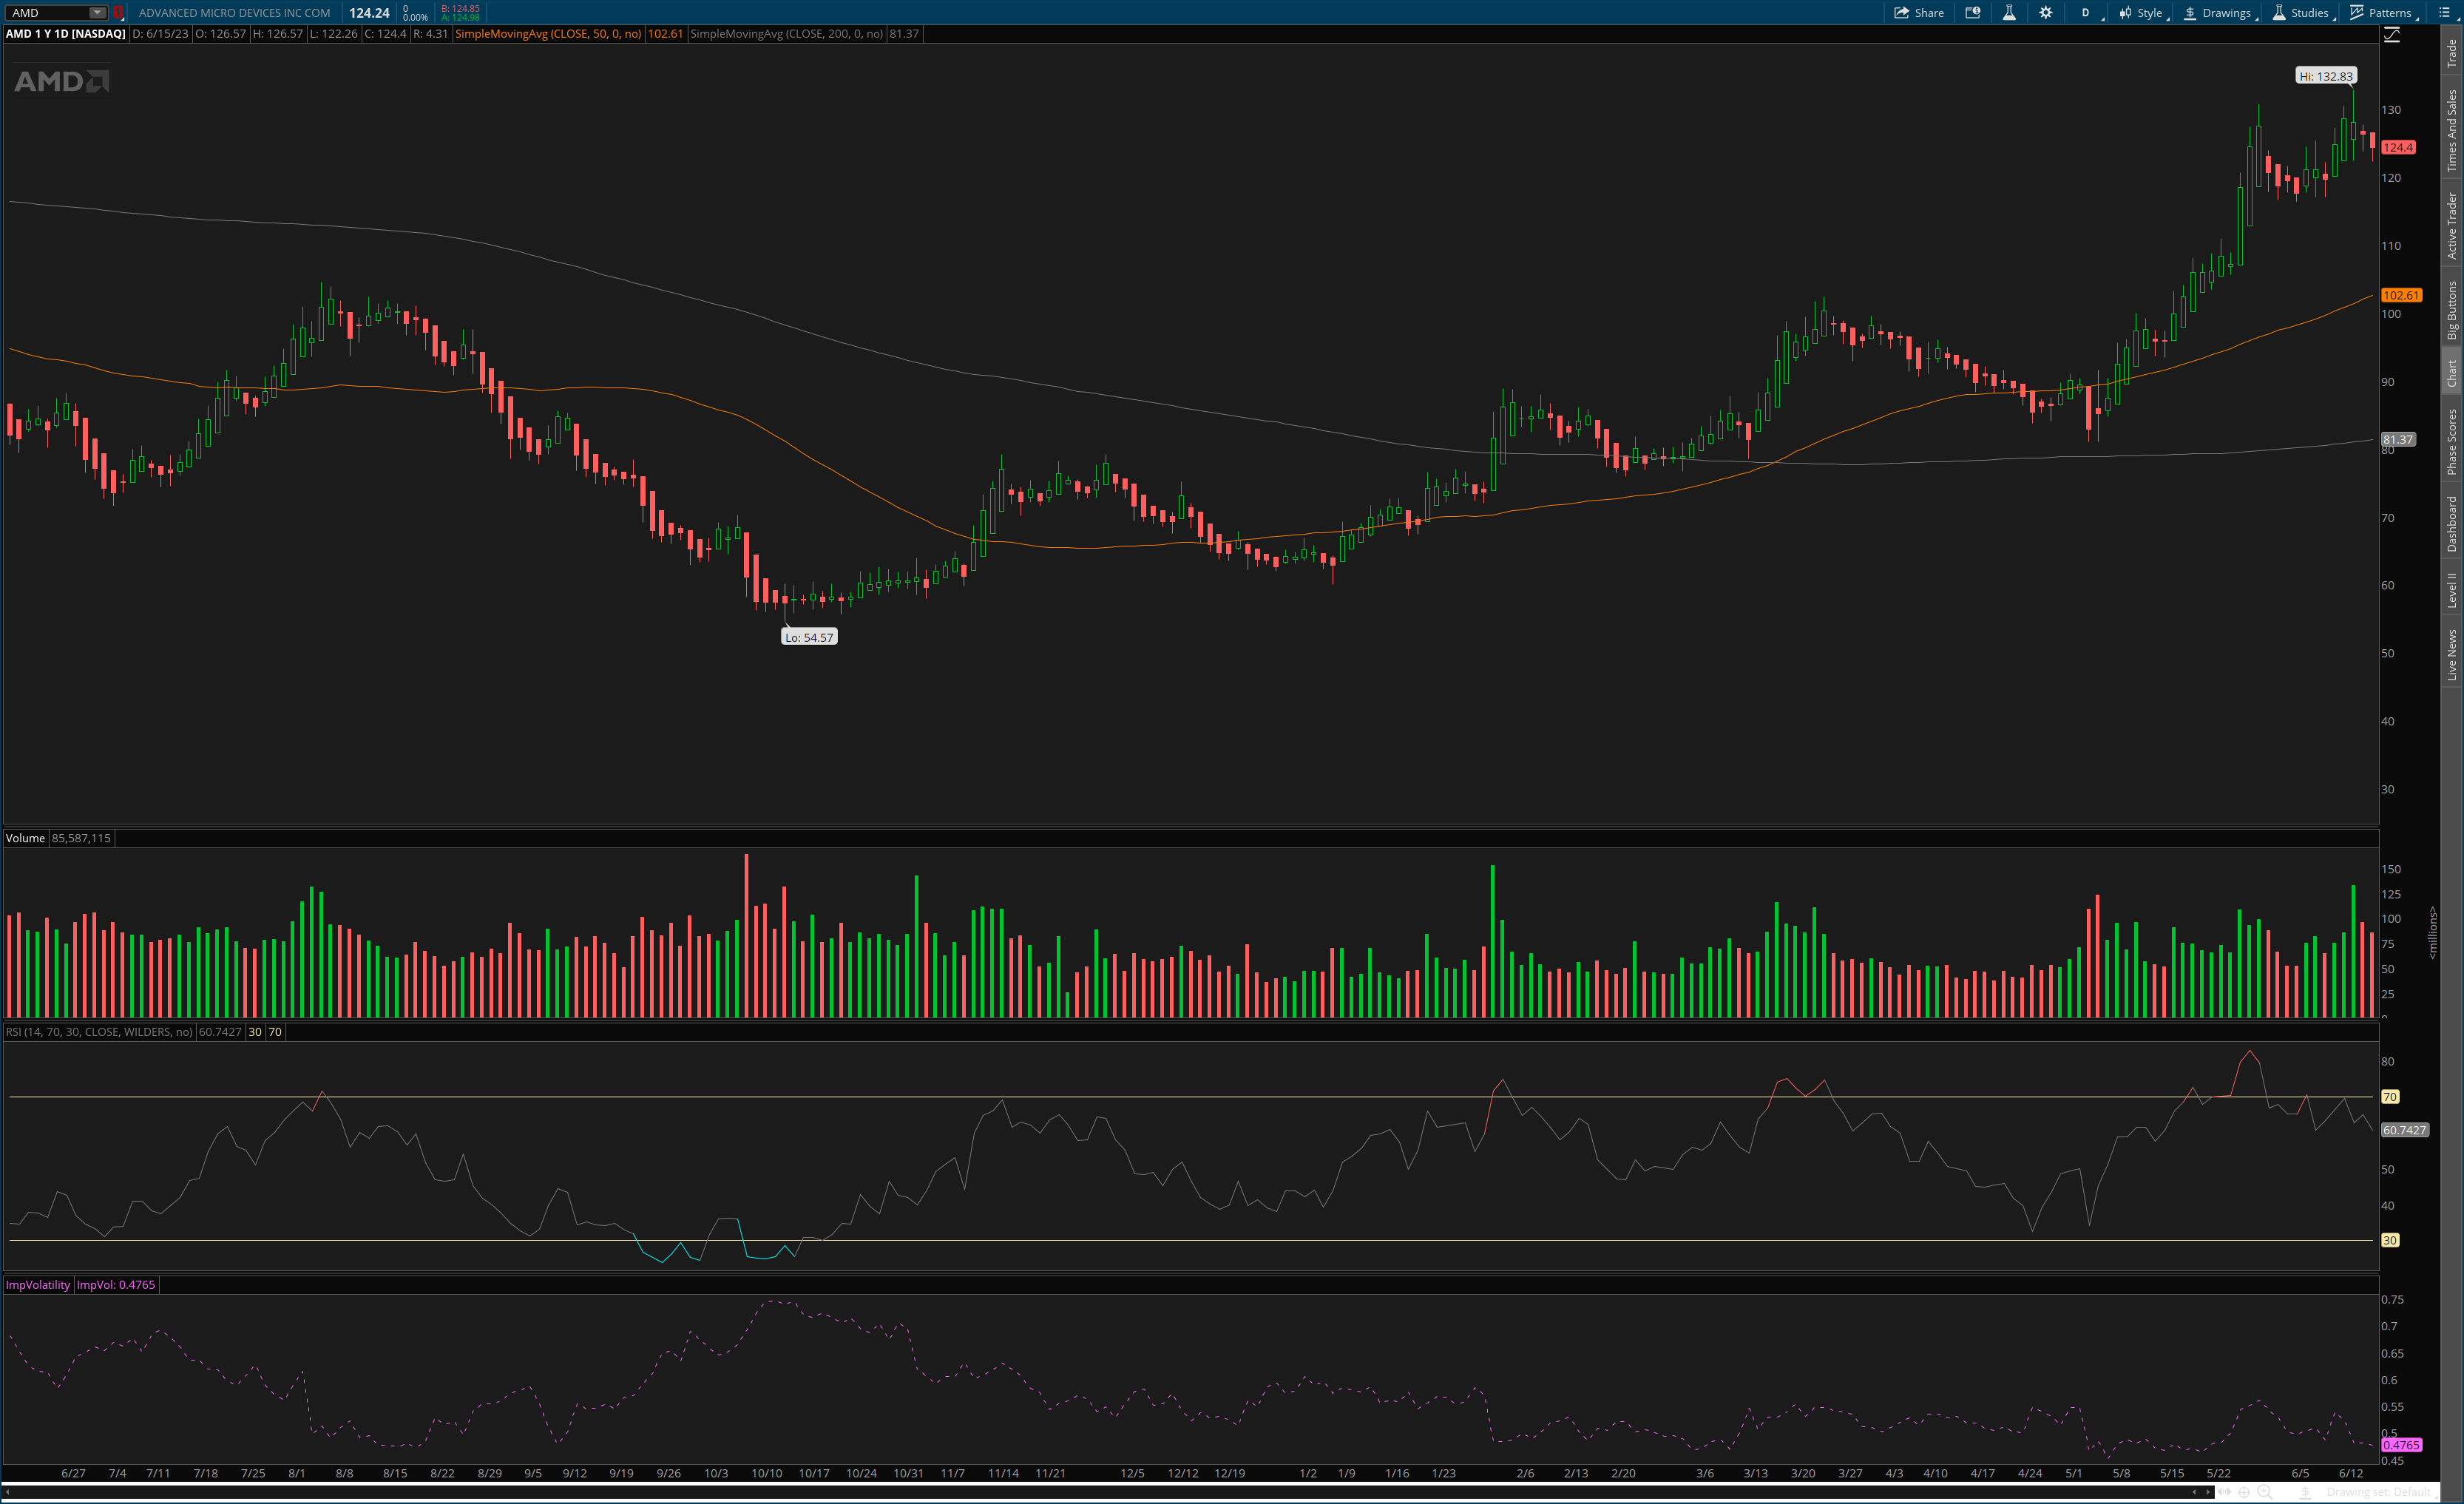
Here's what I see:
- We've had a fairly steep climb since May 5 with the price action catching its breath a bit in June.
- We have a liquidity problem above $130 since we've touched that level at least three times but didn't get enough momentum to get over it.
- Bullish days since the recent pullback have increasing volume.
- RSI has recovered from an overbought zone to a more reasonable level.
- IV is at 47.65%. The lowest IV in the past year was 45.23% on May 5 and that marked the first day of the massive rally from $85 to $130. (AMD had very positive vanna at the time and this was a very bullish setup.)
Smart traders always check another time frame for confirmation, so let's check the weekly for AMD over 5 years, too:
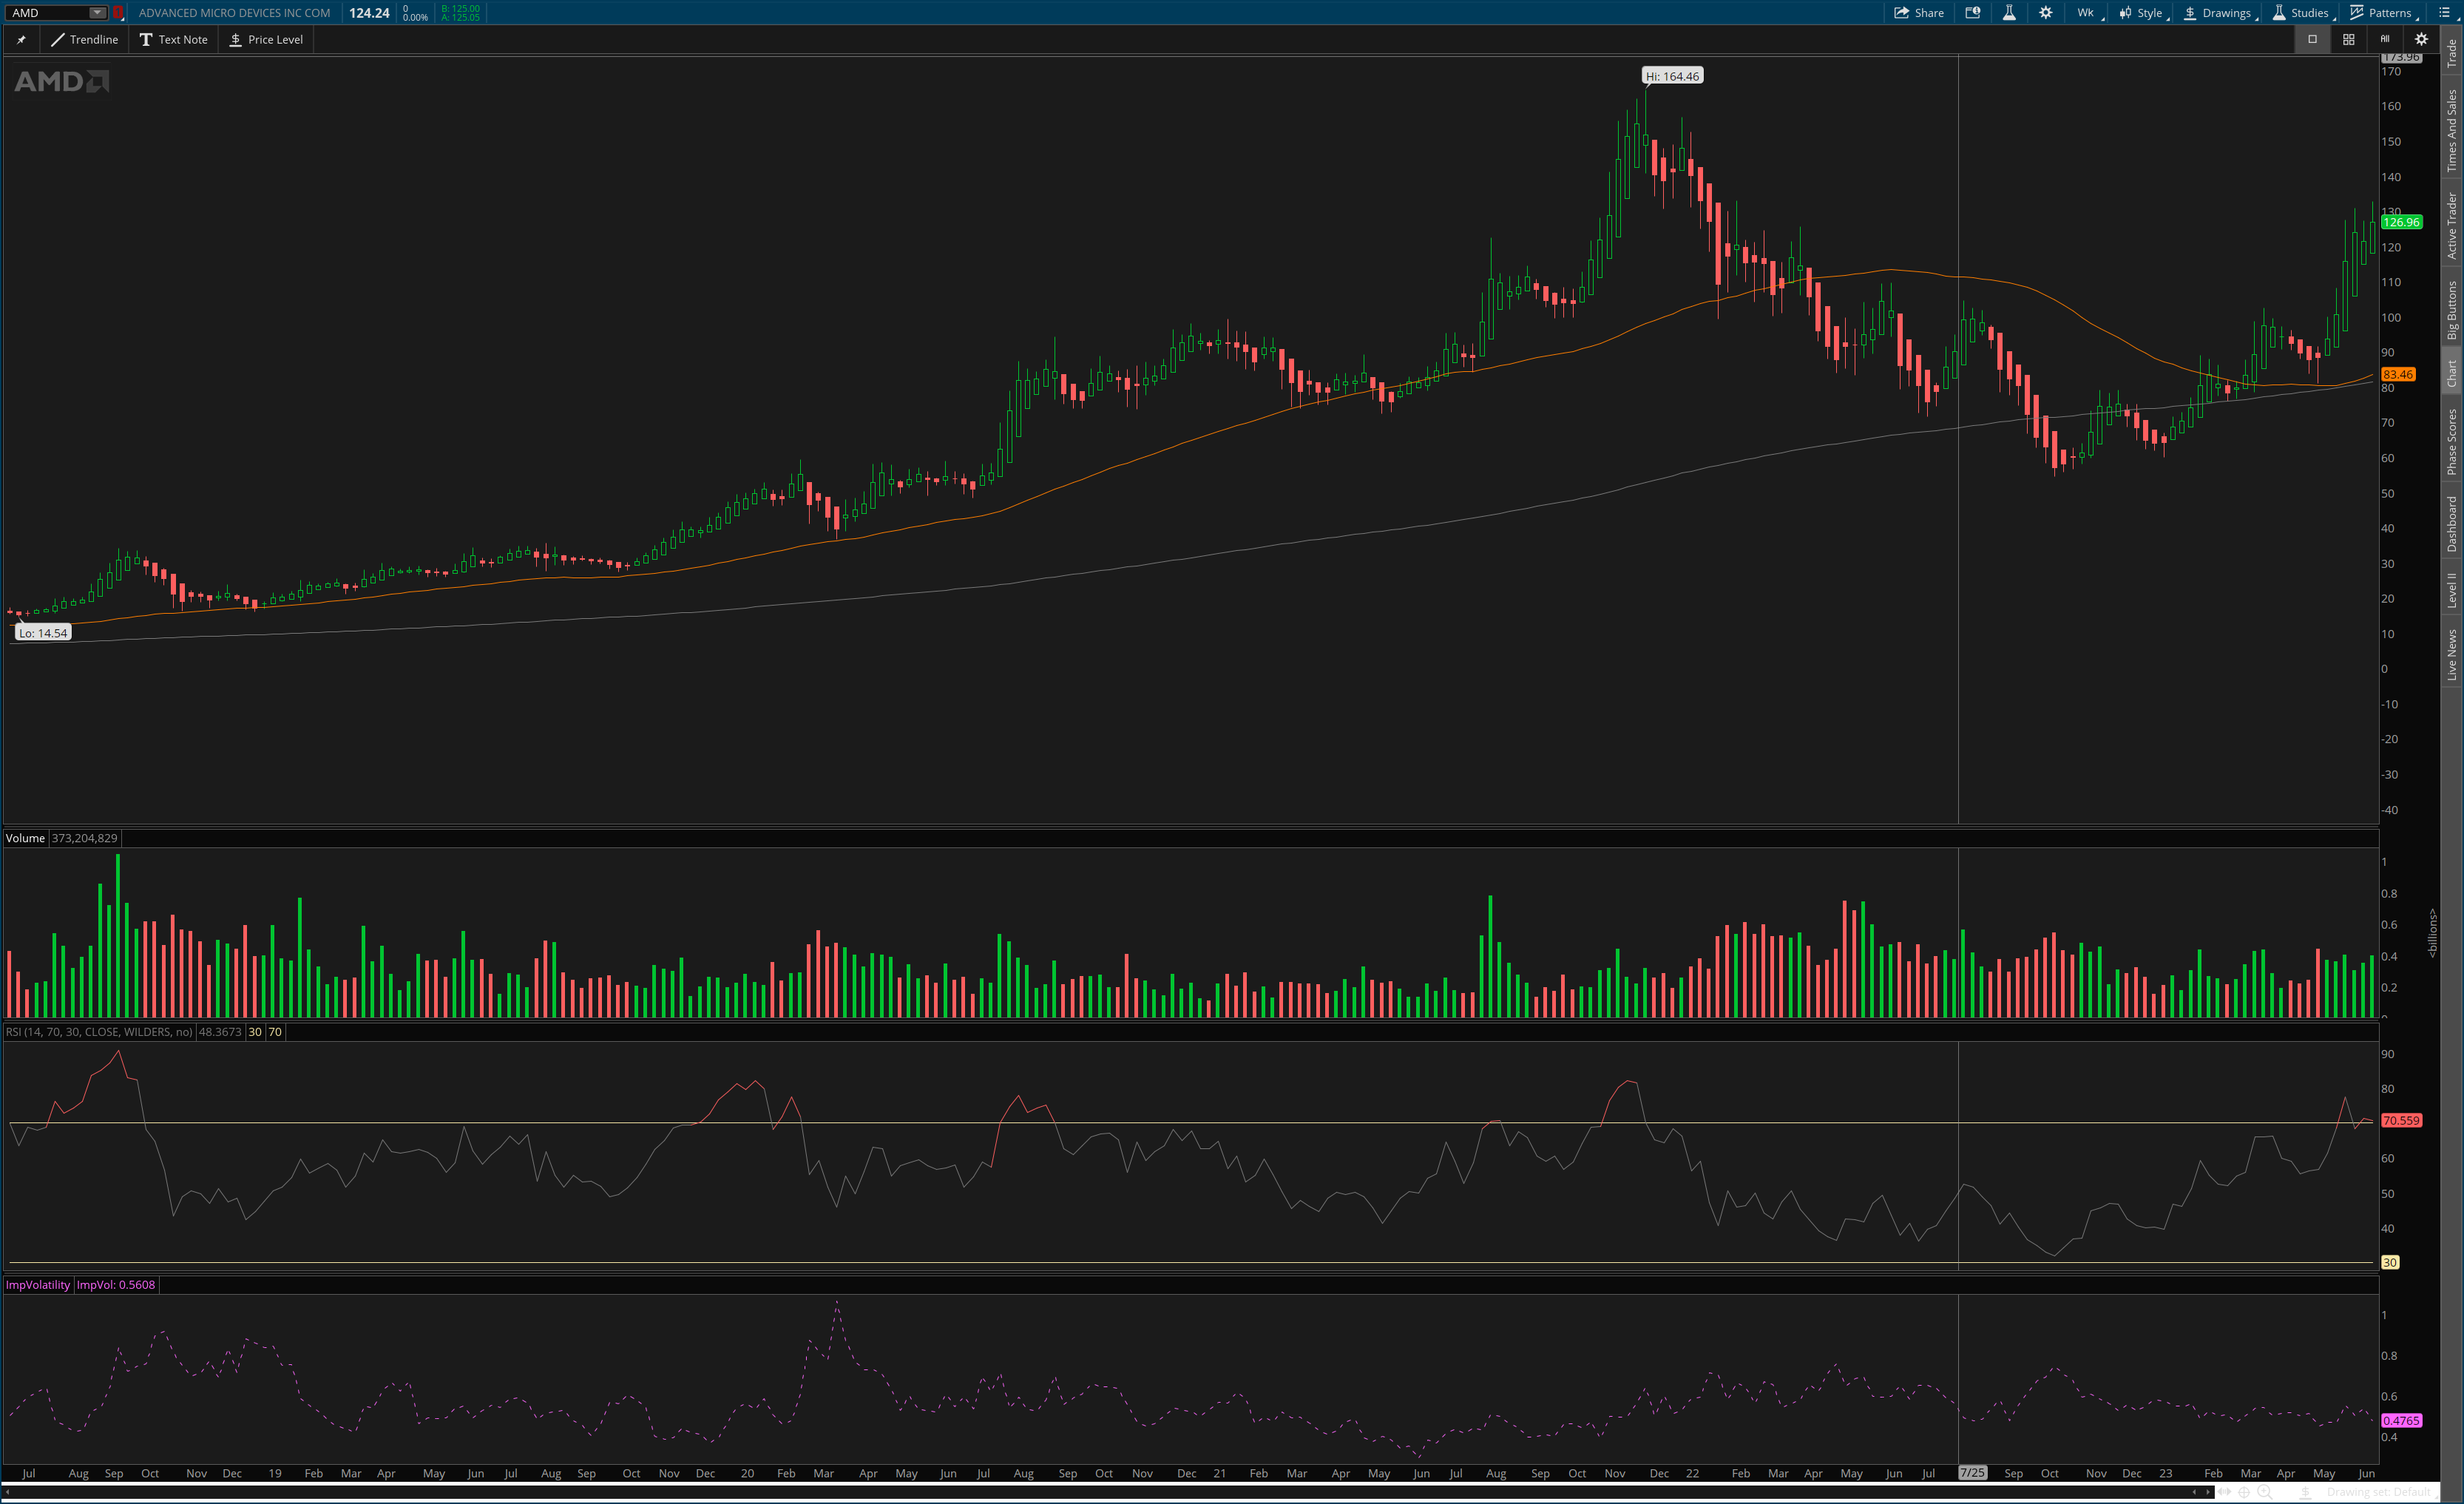
What's different here?
- We see small rallies starting in late October 2022 just before the most recent May rally.
- RSI is on the cusp of oversold territory at 70% and our IV is in the bottom quartile for AMD over the past five years.
Look at the late 2021 rally just before the all time high at $164.46. It looks a lot like our current one, doesn't it? Our current rally has slightly better volume and RSI has not spiked like it did back in late 2021. We have three smaller rallies before our most recent large one, but the one from late 2021 only had two smaller rallies just prior. IV at the beginning of the 2021 rally was 47%. IV at the beginning of the most recent rally was around 45%.
This rally feels slightly more sustainable than the previous rally, but we can easily see how the one from 2021 ended.
Are we due for a correction? Likely so. RSI is running hot, we have liquidity issues at $130, and this rally has run longer than the last two.
Will it be as violent as the one from 2021? That remains to be seen. Interest rate jitters are much different now than they were in 2022 and supply chain problems are closer to normal than they were immediately after the COVID pandemic.
Options positioning
How are dealers positioned? That's what I love to know.
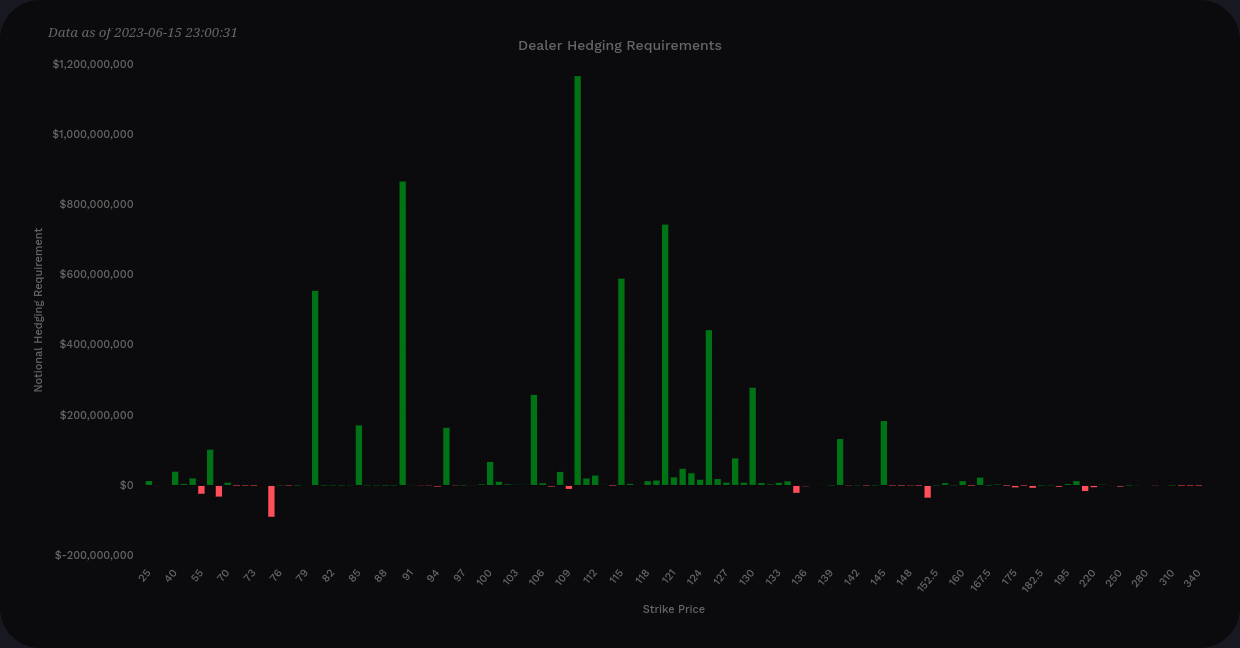
Vanna
Let's take a look at vanna:
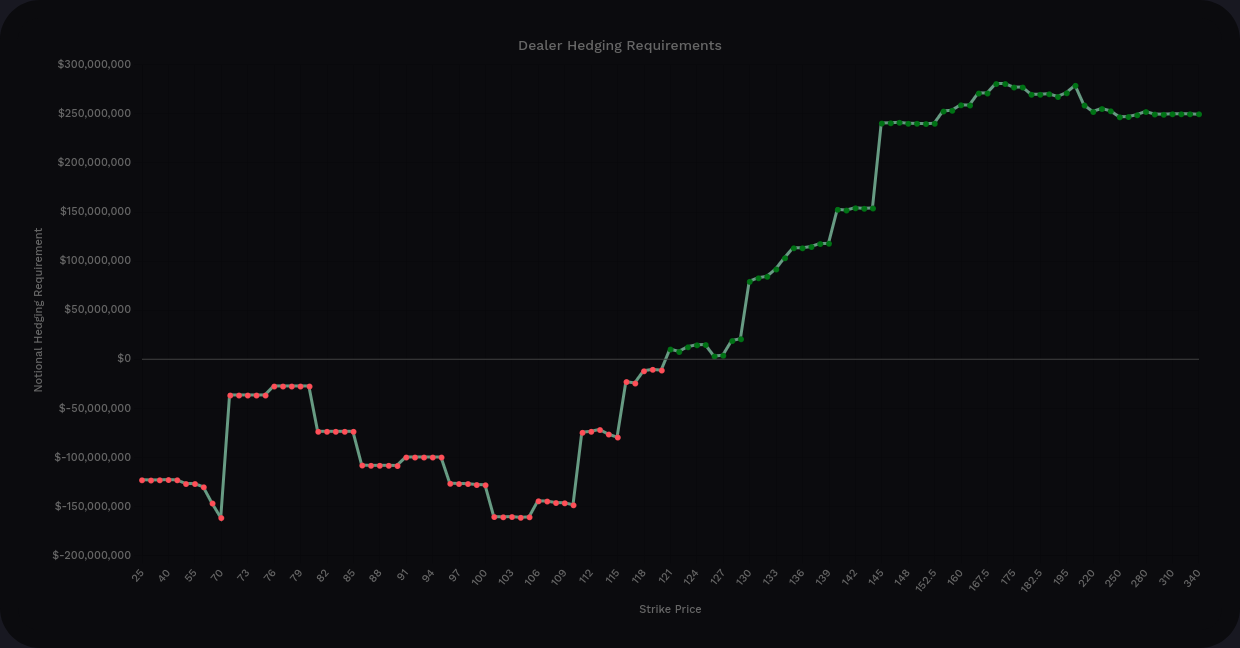
Excluding the massive $70 LEAPS hedge, our vanna lines are struggling to touch $100M of notional value. We had some massive bars recently but these seem tame in comparison. Yes, the vanna curve still has a positive bias (by about 2x), but then again, our IV is at one of the lowest points in the past 52 weeks.
Our biggest area of positive vanna is between $140-$145 and that could be a price magnet if IV remains calm or keeps dropping. If IV does creep up, we might expect price to slow down around $110 to $115 from looking at vanna alone.
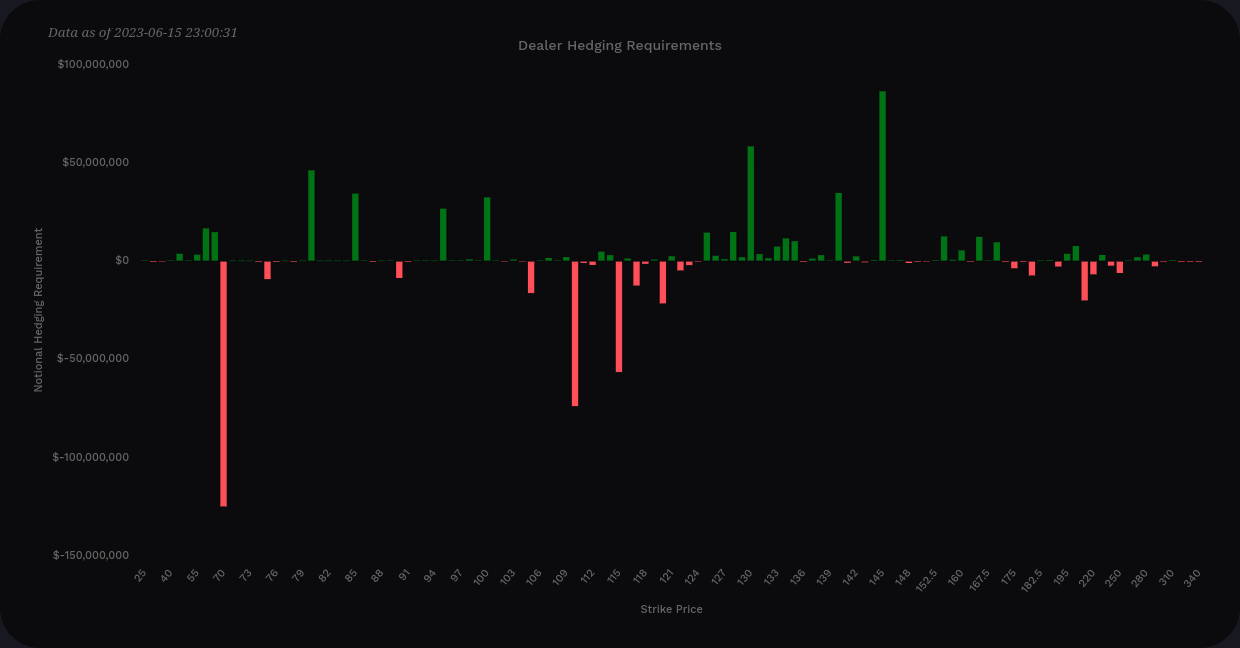
Gamma (DAG)
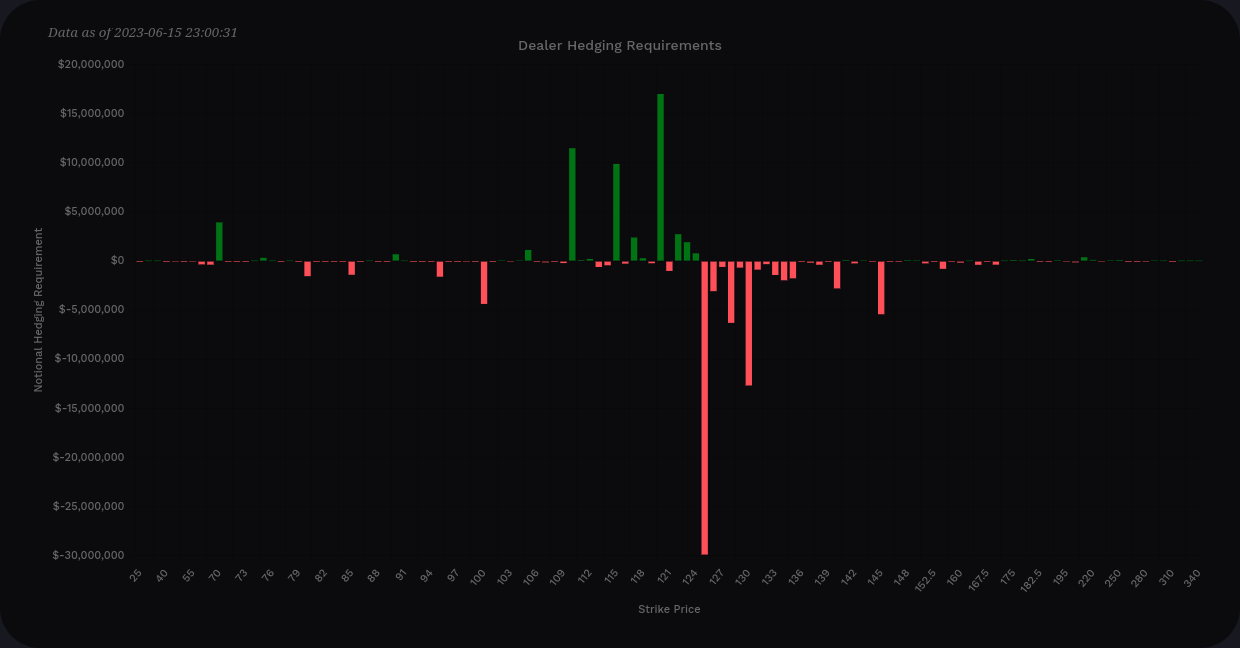
We were talking about $100M on the y-axis for vanna, but we're looking at slightly smaller numbers here. DAG is fiercely negative by almost a 4x margin and our biggest issue seems to be $125.
Gamma might provide us a little bit of support on the 5's from $110-$120, but these bars are fairly small. The $125-$130 zone looks like a brick wall for price movement and this lines up with the lack of liquidity past $130 that we saw on the chart.
Delta
Where are people lined up with puts?
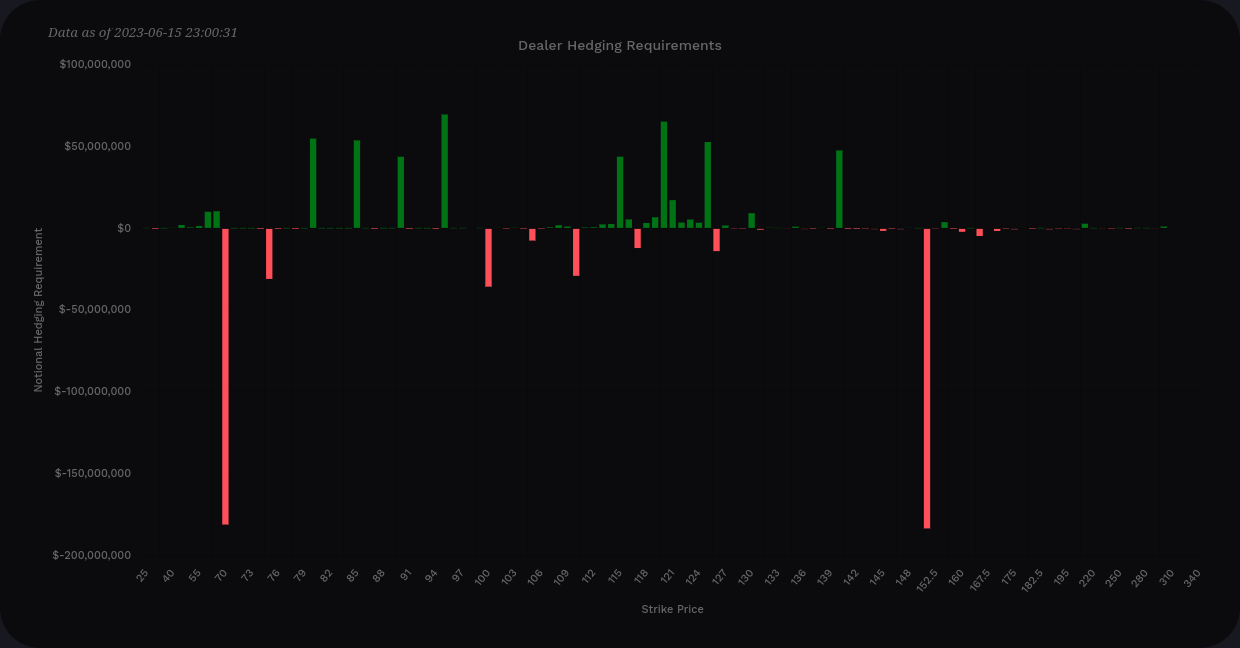
This chart had some very tall green lines recently (denoting sold puts), but those shrank dramatically as AMD's IV came down. We have two very well defined points at $70 and $150 that look quite difficult to cross.
And calls:
Nobody wants to short calls right now on AMD. Perhaps this is due to potential upside being worth more than capturing call premium in a low IV environment? AMD had this pattern for at least the last 4-6 weeks. Most people are stacking their bullish bets at $110.
Other data
Some of the charts on Tradytics help to correlate the data I'm seeing and I found a few that are helpful today.
First off, here's the net options flow for the week:
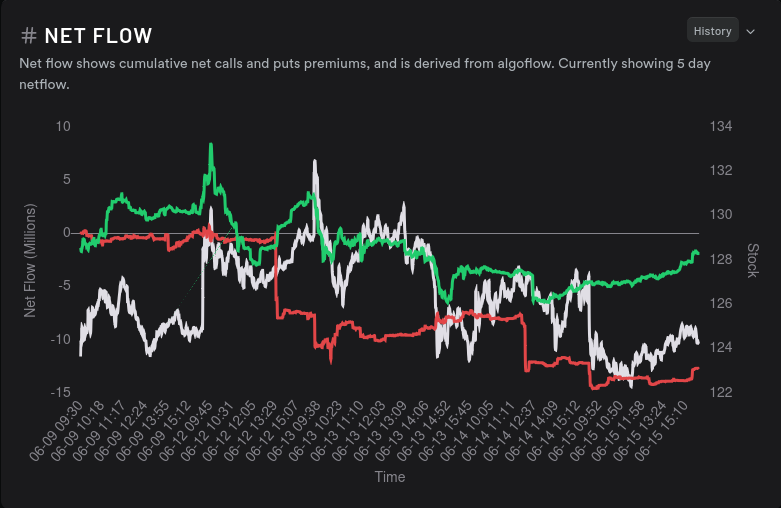
Puts sold off all week long. This could be long put holders selling back their contracts, or it could be net new short puts. However, after seeing that put delta chart from Volland showing shorter green bars, this leads me to think that these are likely hedges being bought back.
Some might say "Oh, buying back hedges? That's crazy bullish." Sometimes, yes. In this situation, I'd like to see hedges on the chart since that gives us some points where we might take a rest if we do enter a correction.
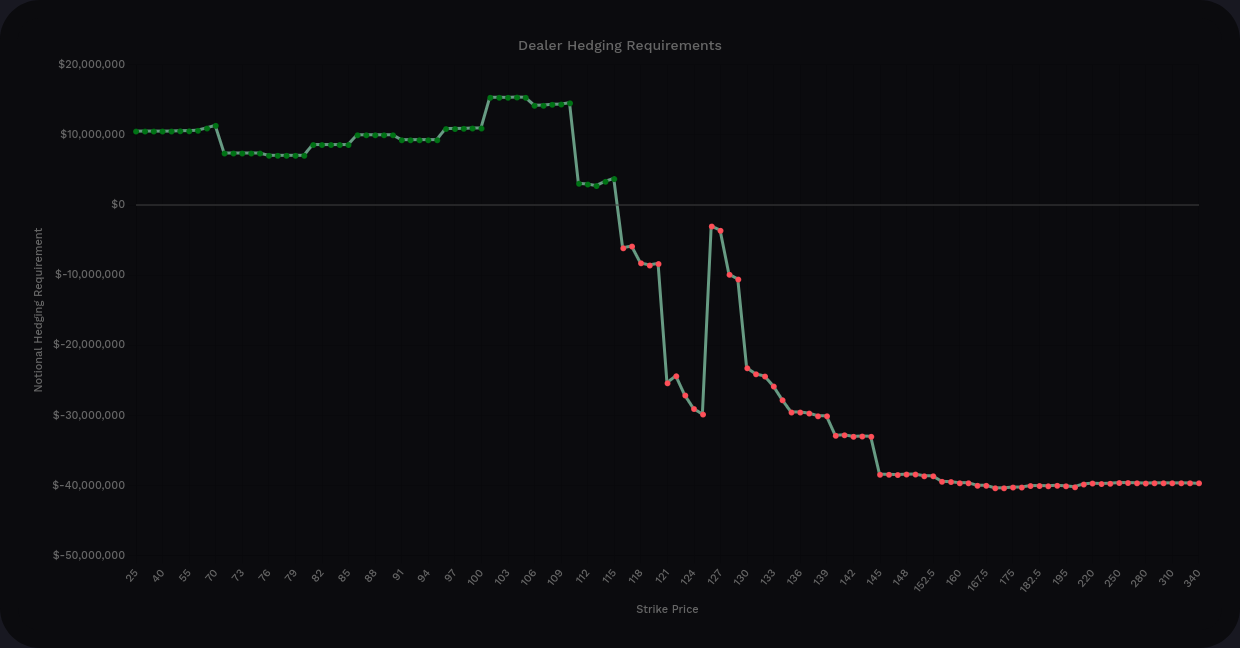
Let's look at how dealers are positioned:
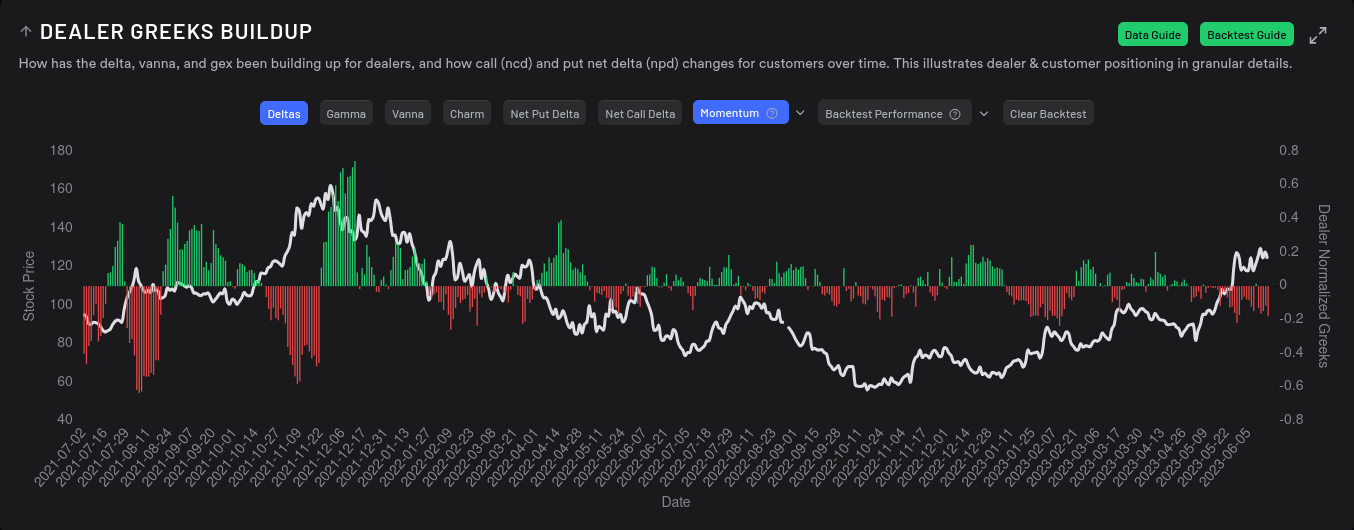
The chart above shows a 15 day momentum of dealer deltas. Dealers are currently sitting on short contracts which means market participants are likely holding bullish contracts (bought calls, short puts). The momentum is still pretty strong on the short side, which is a bullish sign.
A backtest of the 15 day momentum chart shows 128% gains since July 2021 versus 31.2% for just buying and holding AMD during the same period. That would require you to sell as soon as the 15 day momentum turns green (dealers long) and buy when it turns red (dealers short). Past performance doesn't dictate future performance, though.
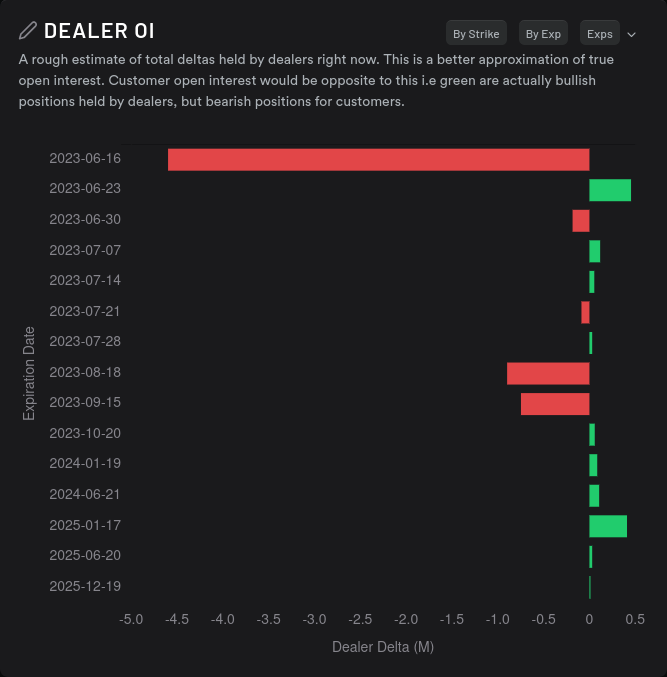
Here's another chart that leads me towards thinking we're approaching a correction. 6/16 OI is very bullish but 6/23 is growing in the bearish direction.
Thesis
Based on all of the evidence laid out above, I'm turning neutral in the short term for AMD. There's plenty of evidence that crossing $130 will be challenging. But there's plenty of support in the $110-$120 range to backstop any corrections that occur. Nobody seems to be betting on a massive drop (except that massive $70 LEAPS contract) but it seems like traders are expecting some kind of correction and likely an increase in IV.
I'm sitting on quite a few long shares right now with 2 covered calls getting assigned this weekend. I might look at selling some covered calls at $130 or above on a short term (6/23 or 6/30) but I haven't decided yet.
Good luck to all of you. 🍀
All investments come with significant risks, including the loss of all capital. Please do your own research before investing, and never risk more than you are willing to lose. I hold no certifications or registrations with any financial entity.
If you like what you see here, click the Subscribe button at the top right and you'll get email updates from my latest posts as soon as they're published – all free.
Of course, if you find this information useful and you want to support my efforts, you can become a supporter with a small monthly or yearly contribution. 💙
Discussion