AMD chart review for September 8th

As AMD drifts towards some important lows, what levels should we watch? How is it stacking up against the semiconductor sector, especially after NVDA's earning call?

It's been a little while since I did a deep dive into AMD's charts and this weekend seemed like a good time to have another look. With INTC sitting at lows not seen for a long time and NVDA stumbling after its most recent earnings call, AMD is getting my attention once again.
All investments come with significant risks, including the loss of all capital. Please do your own research before investing, and never risk more than you are willing to lose. I hold no certifications or registrations with any financial entity.
It's nerdy data time. 🤓
Semiconductor sector
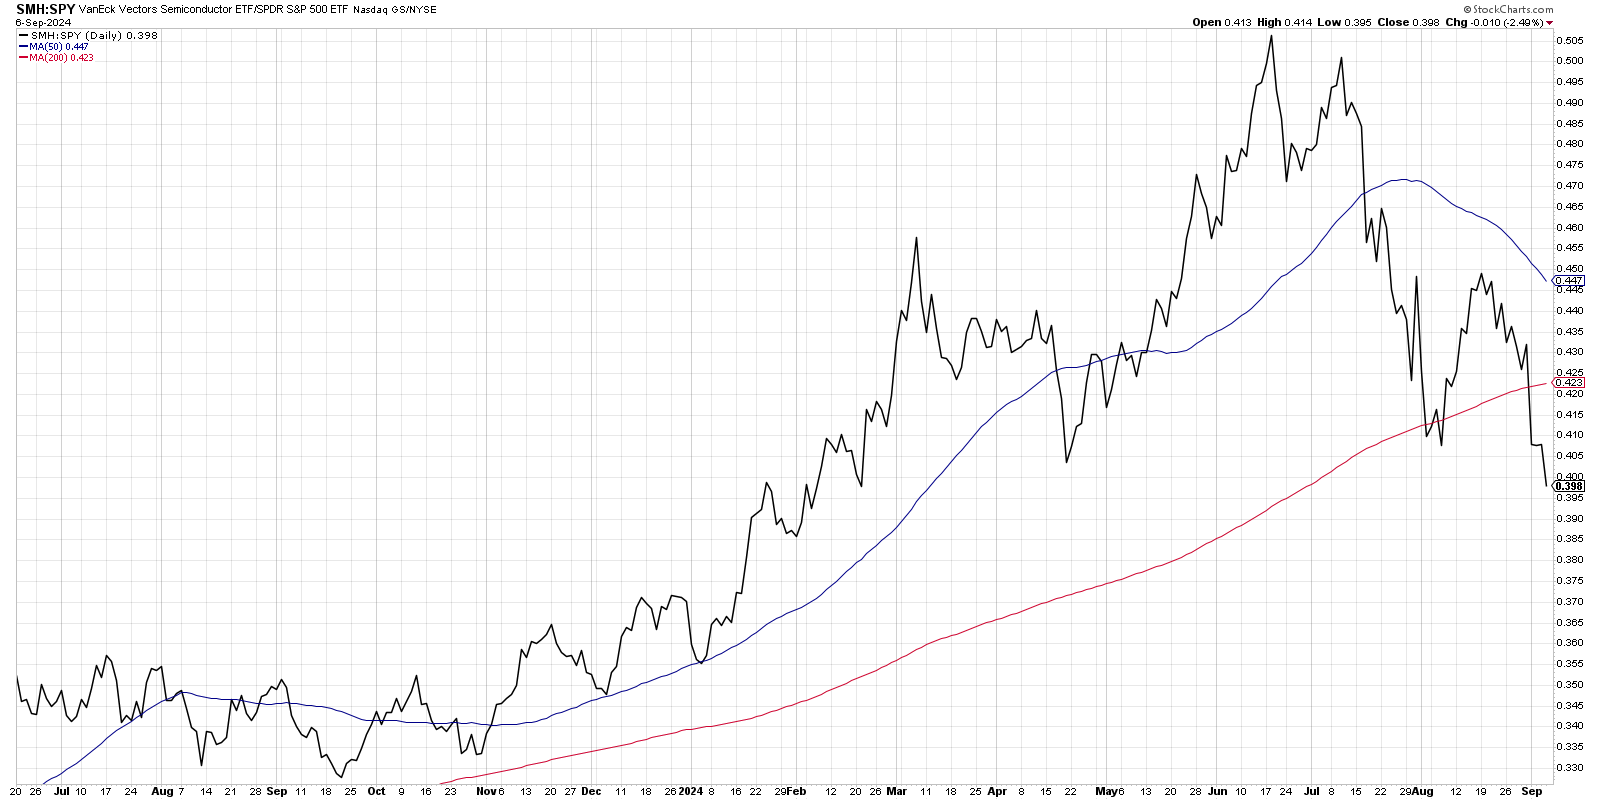
SMH is the big semiconductor sector ETF and its strength relative to SPY broke through the 50 and 200 day moving averages after making a stark double top this summer. We're back to relative strength levels from last February:
As of this weekend, NVDA is a little over 20% of SMH. AMD is only 5%. Here's a look at AMD's strength relative to SMH:
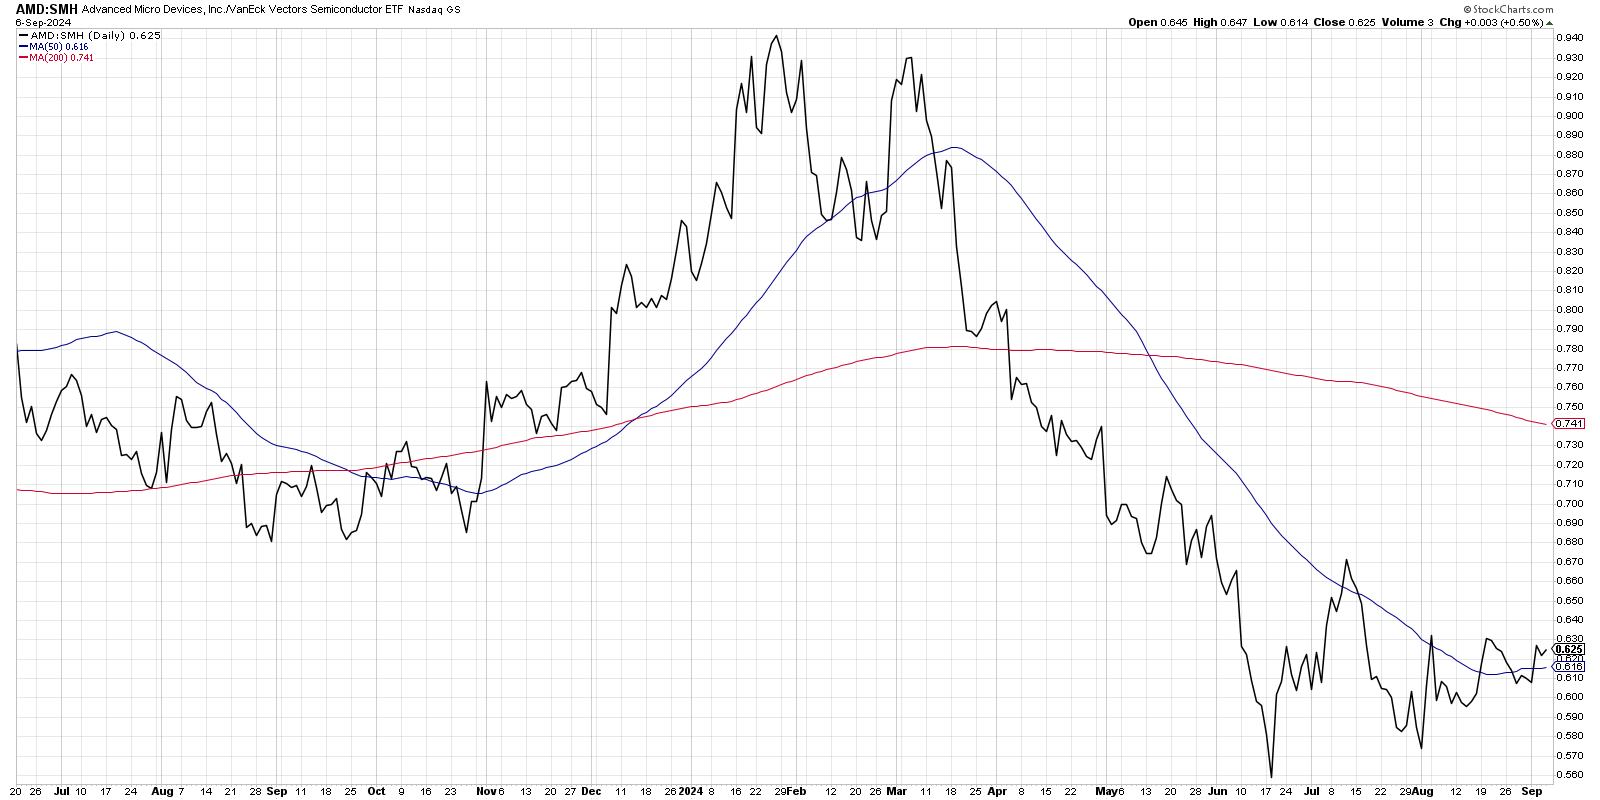
To better understand where AMD's relative strength sits today, we need a weekly chart that goes further back:
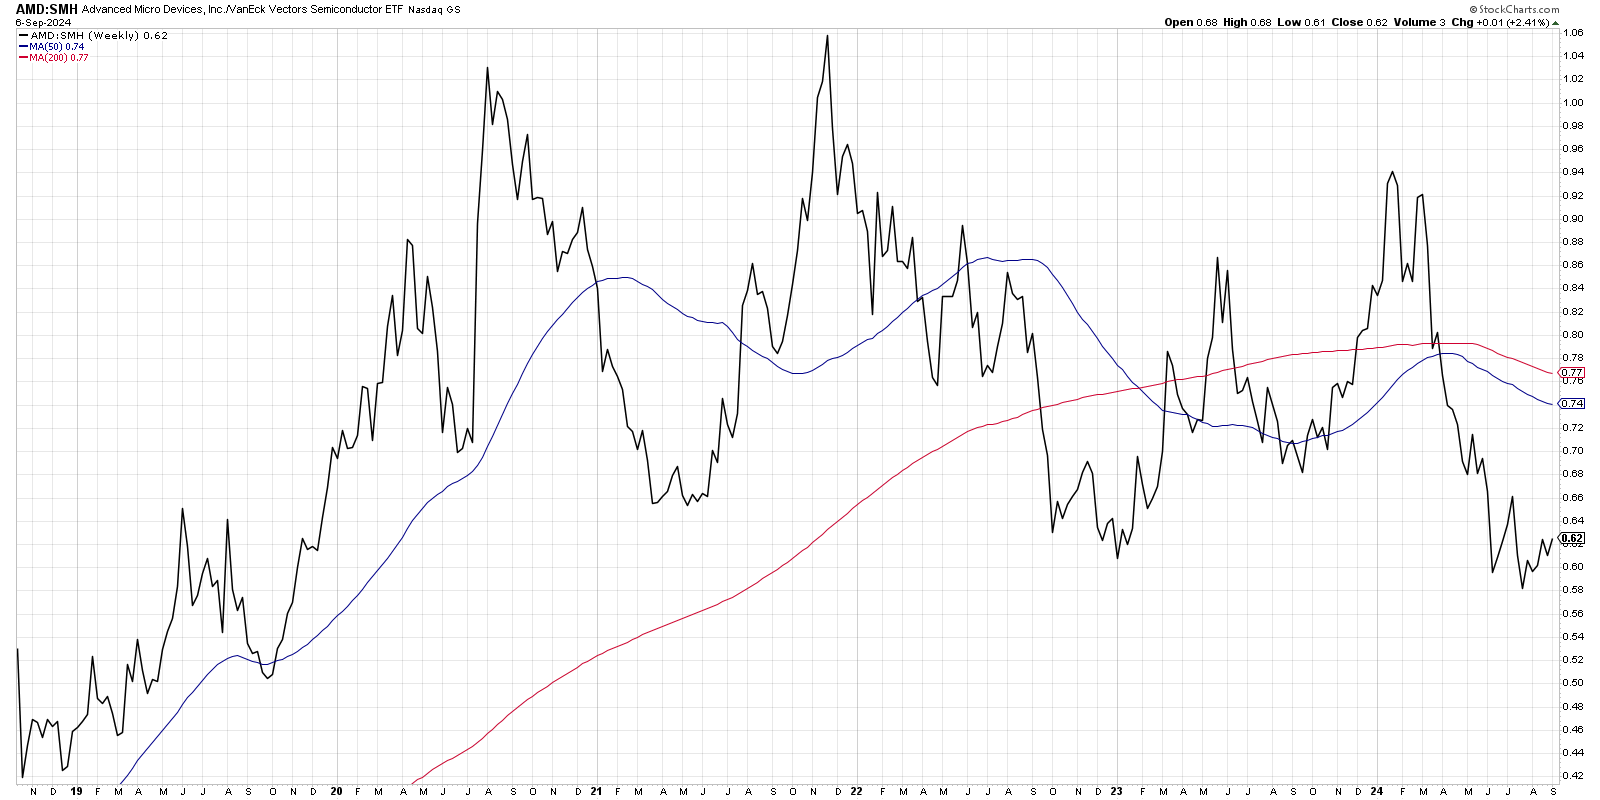
AMD's strength relative to the semiconductor sector sits at a very low level. This level was briefly touched during the 2022 bear market. Looking further back, this strength level was resistance in mid-2019 and became support later that year. AMD's relative strength is at quite a low level today.
Point and figure
My go-to first chart for just about anything these days are point and figure charts. I love them because they compress time really well, they highlight important levels, and they always have a bearish or bullish signal in play.
The 60 minute, 3 box reversal PnF chart for AMD is leaning bearish with a descending triple bottom and a price objective of $115.80. This pattern is more bearish than most, but like anything in the market, it is not a guarantee.
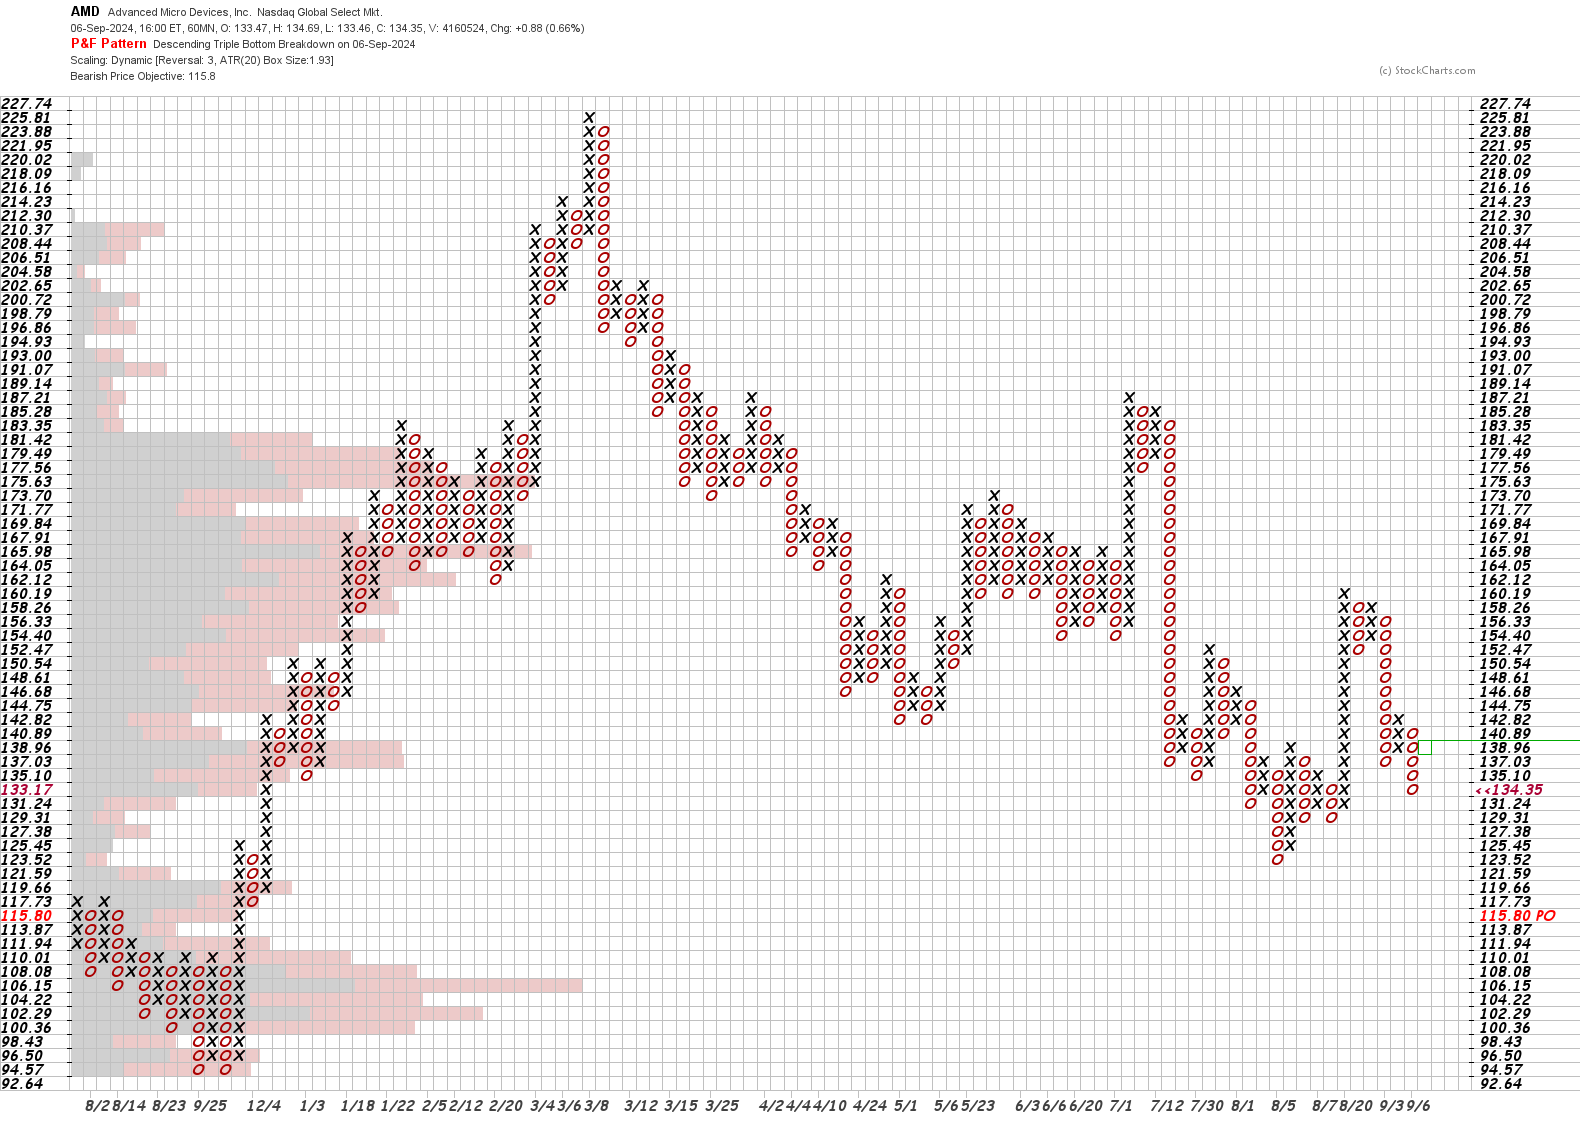
Let's crunch down to the most recent data to analyze some patterns.
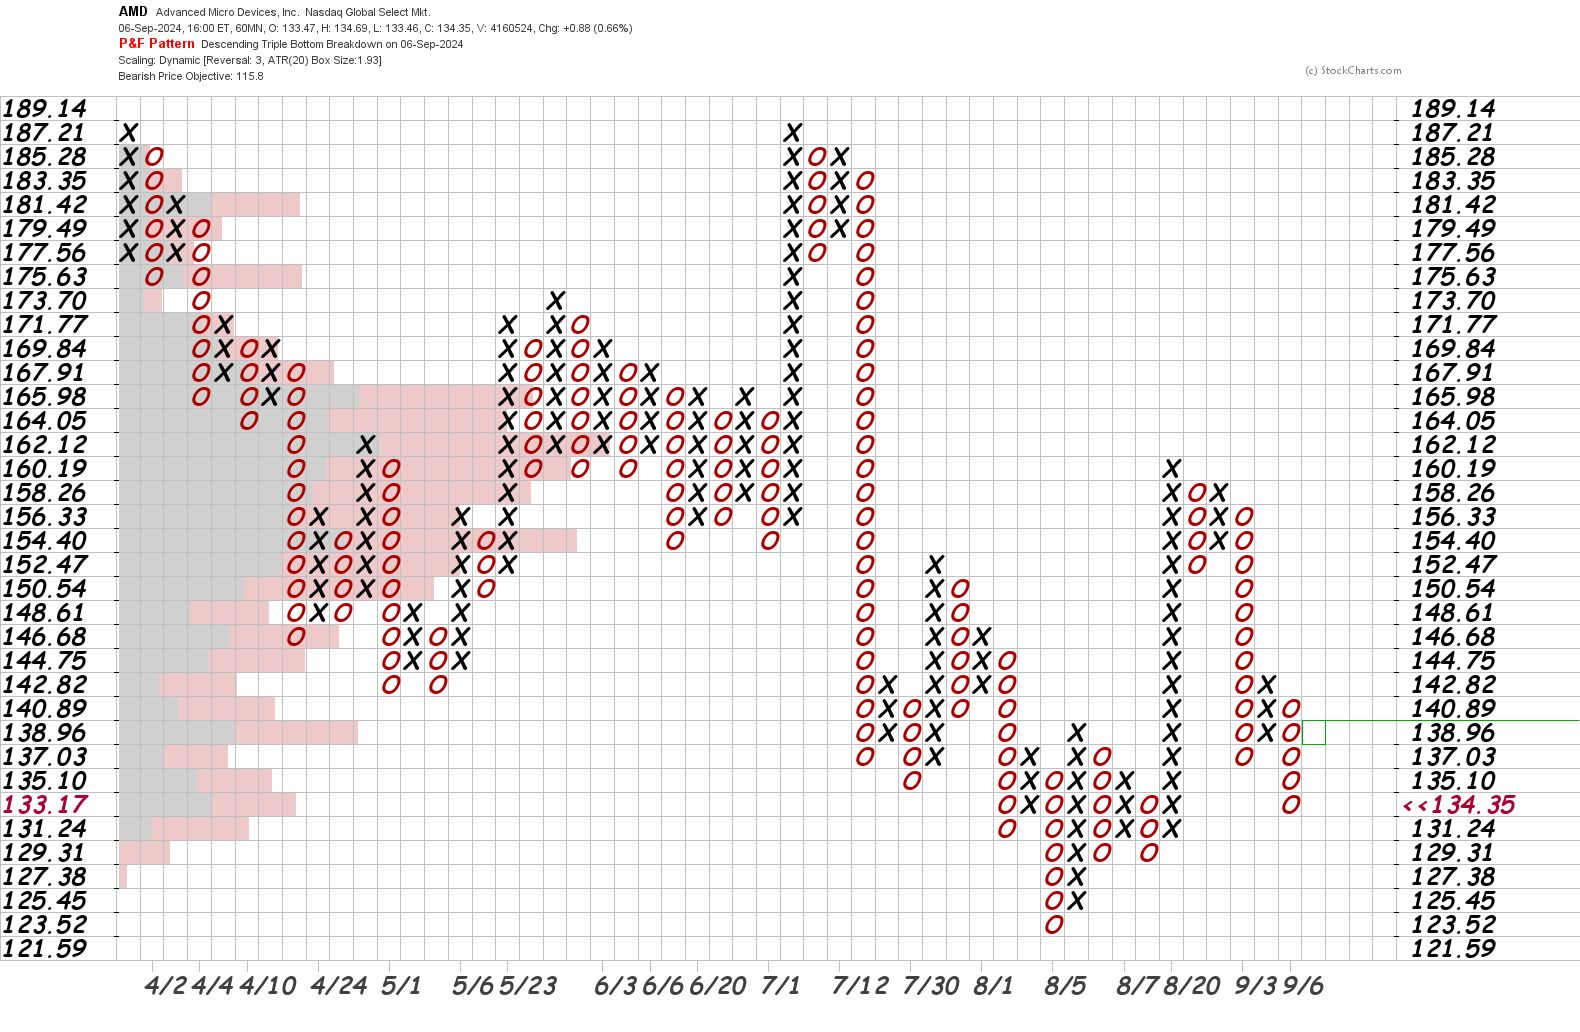
Starting from the right, we have a descending triple bottom breakout that started in August after the big run up from the $130s to $160s. We had a little consolidation before that back to July. That consolidation was gradually trending lower.
Before that, we had the big run to $187 which fell back through a bearish triangle breakout. This chart is yelling at me that nearly everything is trending lower. Consolidations are leaning downwards. Spikes to new highs aren't going as high, and new lows are getting lower.
Then again, I could make a bullish case that AMD made a stand in the $120's and hasn't revisited that level yet. If we see another drop there and more support, we could see another temporary counter trend rally. There's also plenty of volume in the $160s where price might return at some point, but that level transformed from support into resistance back in July.
Candlestick charts
Once I analyze the PnF chart, I wander over to the candlestick charts to see if it confirms my thesis. June and July saw a run-up in price to a new high, but there was some danger lurking as the money flow index (MFI) failed to make a new high. The MFI did make a higher low just before the July rally, but there wasn't enough momentum to create a sustained rally:
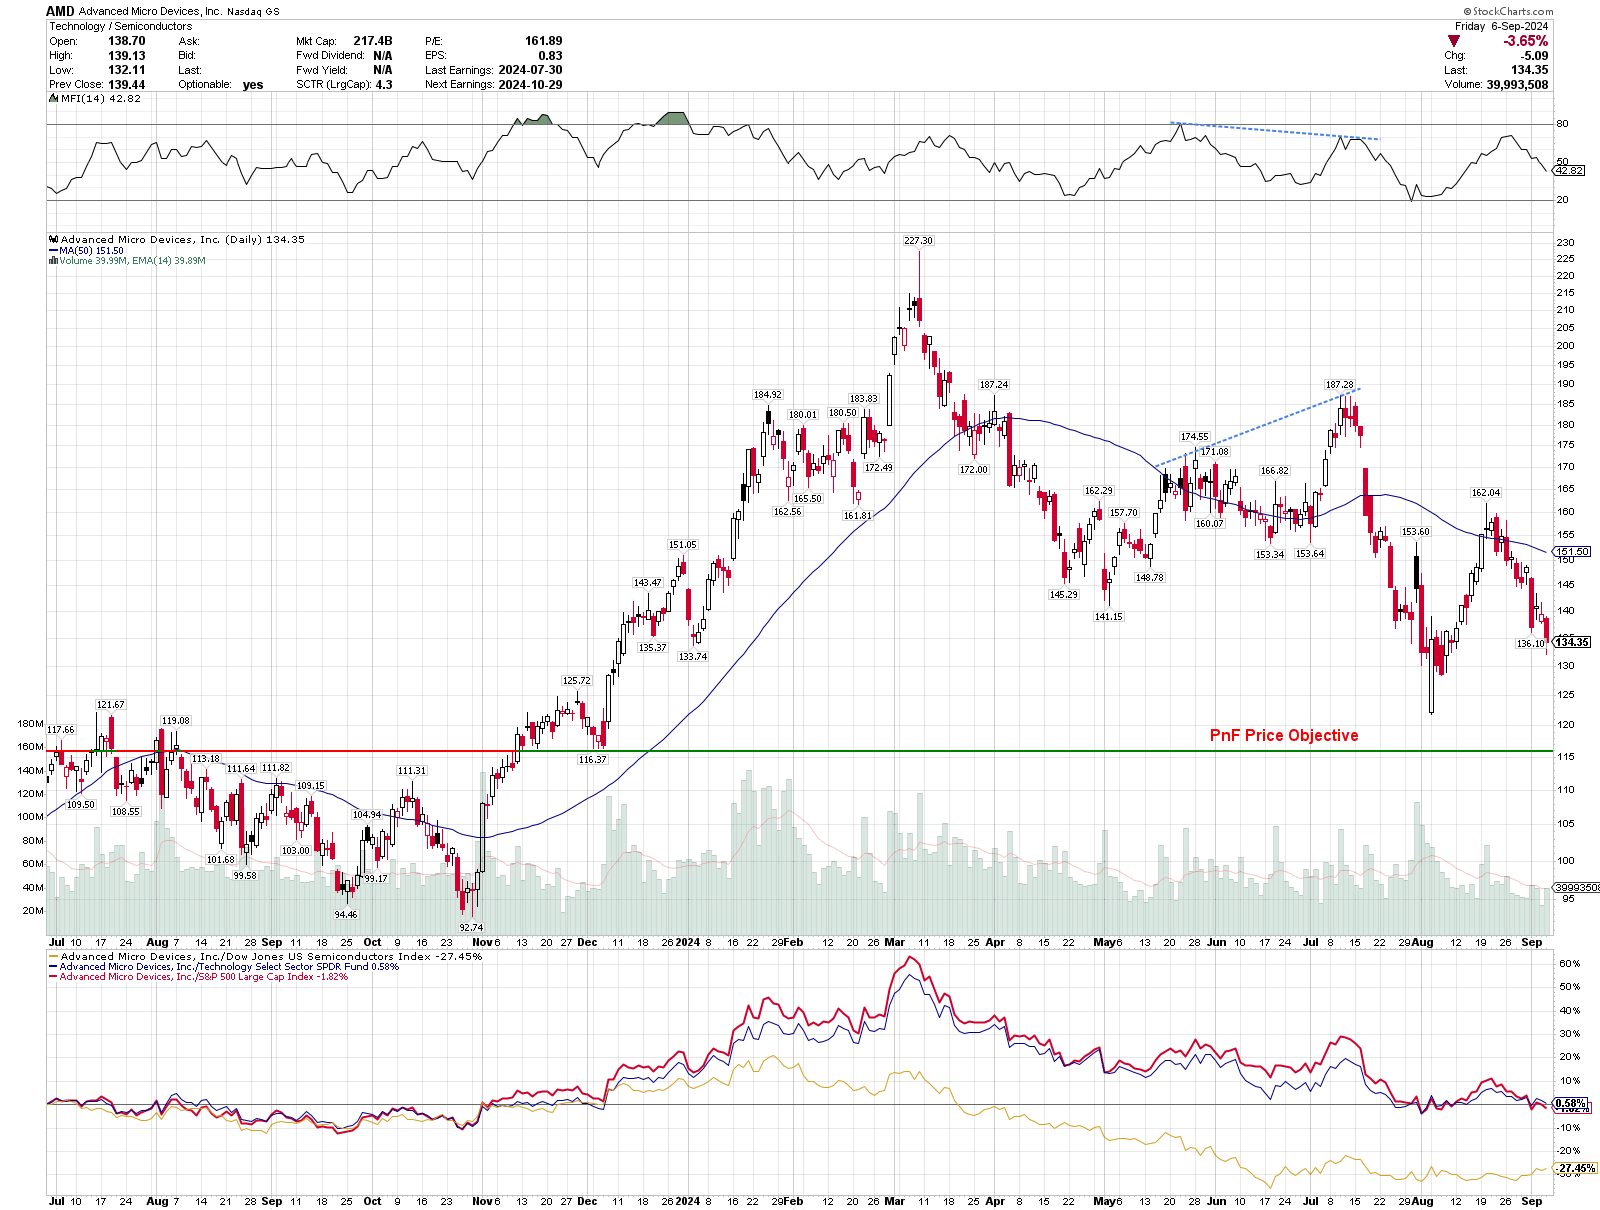
I've marked the price objective from the PnF chart and it looks like a resistance level that previously became support. AMD tried to get over it in the summer of 2023 and failed. However, the late 2023 rally sent AMD over the level and it retested it in December. It hasn't been near $115.80 since the August dip.
The bottom pane of the chart shows AMD relative to its Dow Jones sector, the S&P 500 Tech sector, and SPY itself. The relative strengths to SPY and XLK took off and peaked in March 2024, but the Dow Jones Semiconductors Index began diverging as soon as AMD lifted off the $115.80 level back in December 2023. This is a red flag that I missed.
Thesis
Fundamentally, AMD still looks expensive with a P/E ratio of 68. The same ratio for NVDA and INTC fell to 51 and 42 respectively. However, AMD has a robust and growing server CPU segment. Their GPUs haven't yet caught up to NVDA's performance and flexibility, but they might have an opportunity as NVDA's Blackwell delivery isn't happening as quickly as the market expected.
If AMD does fall to the level around $115.80, it will be a big reset in the stock's price. All of its strength relative to its sector and SPY will be reset to zero on a yearly basis. I'll be very interested to see the moves it makes if it gets there.
There's still plenty of indecision in the market as participants argue between rate cut possibilities and a potential recession. We're also in the midst of a reckoning for AI. Is it really as useful as everyone says it is? Can companies monetize AI-based services or products efficiently? There are plenty of questions left to answer.
Good luck to everyone this week! 🍀
Discussion