AMD Deep Dive for 2023-06-15

Now that CPI and FOMC volatility has passed and we're closer to the 6/16 OPEX date, let's see what's changed.

The Federal Reserve kept interest rates in place for the moment but signaled that hikes are coming at some later date. Let's see how this affected options data for AMD this week.
But first:
All investments come with significant risks, including the loss of all capital. Please do your own research before investing, and never risk more than you are willing to lose. I hold no certifications or registrations with any financial entity.
With that out of the way, let's roll on! 🛞
Vanna
The effects of vanna (and charm) wane as we approach the monthly OPEX on Friday, but they're worth looking at anyway. Much of the recent run up since May 5 has followed vanna levels closely.
After signing up for Volland's "3" plan (offers three updates per day), I've noticed that AMD's vanna curve sinks mid-day and then looks bullish again at the close. Yesterday was no different.
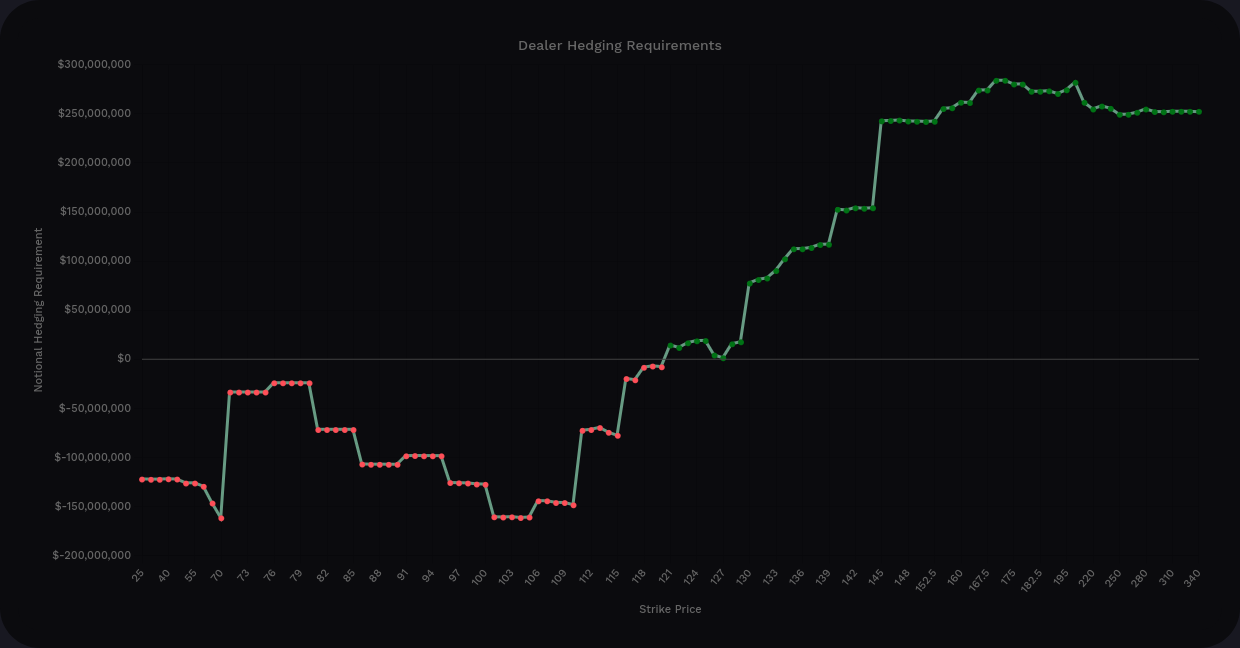
Looking at the aggregate curve, there's still a bunch of positive vanna above the current price and that should act like a magnet for price so long as IV decreases or remains steady. In addition, looking at the extreme left and right sides of the vanna curve reveals that we have almost double the positive vanna than negative.
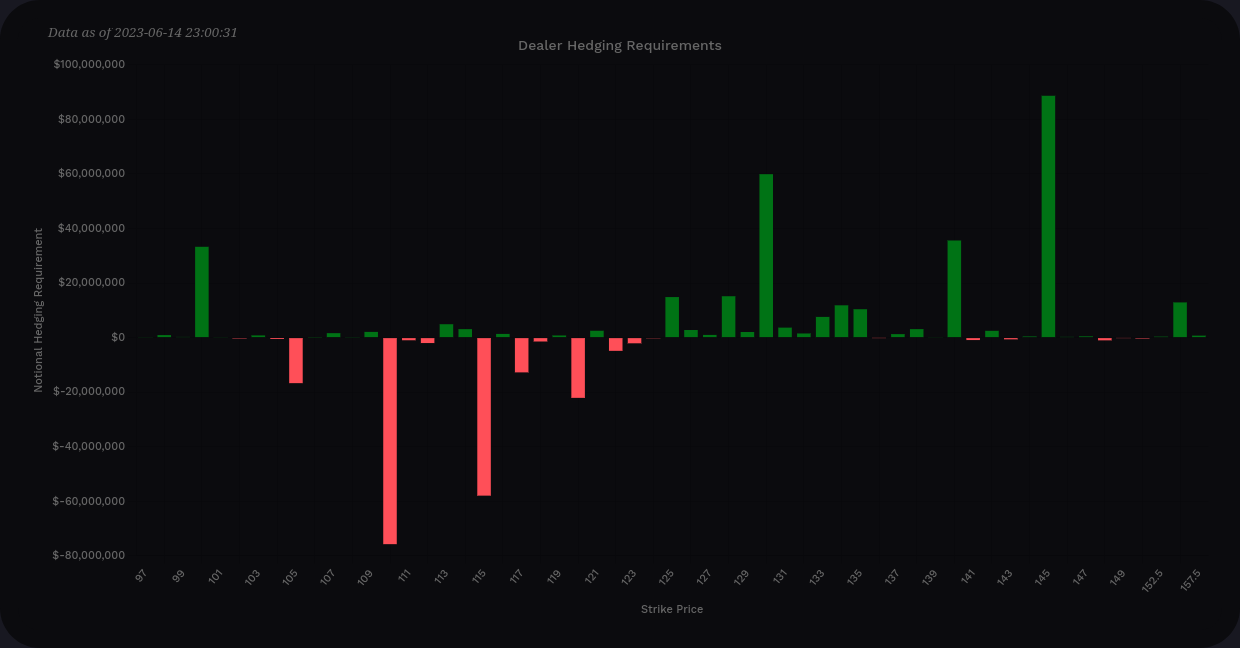
On the detailed chart with bars, there's been some interesting developments around $130 and $145. The $145 initially sprang up last week, calmed down, then increased again after the Fed announcements. At the same time, the negative vanna at $120, $115, and $110 all shrank. This could be due to investors taking profits underneath the current price or rolling their contracts up to $130 or $145.
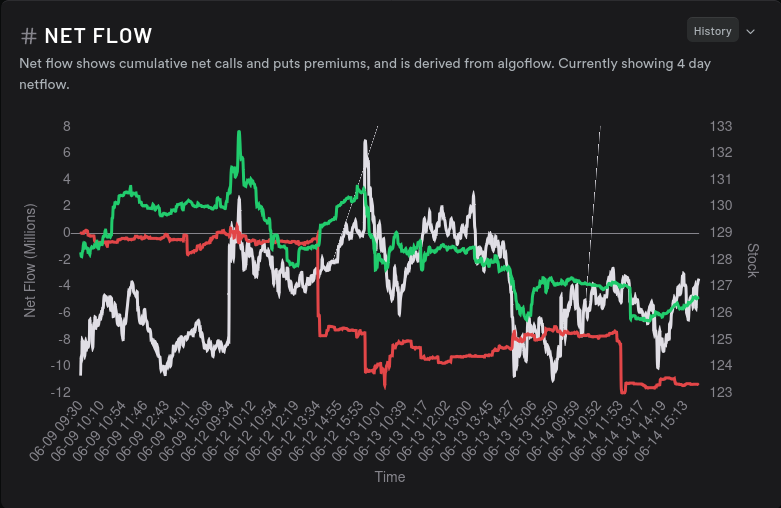
Tradytics has a net flow chart for the week that shows market participants taking profits all week long:
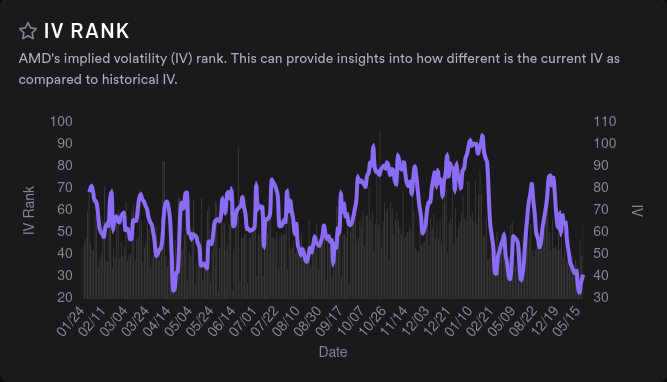
Takeaway: Vanna looks bullish for AMD as long as IV doesn't creep up. IV for AMD is around 48% and that's close to the 52-week low of 45% set on May 5th. This might have been a catalyst for the big rally from the $80's up through $130. I can't find much evidence to show that AMD has any significant headwinds before $145.
Gamma (DAG, specifically)
Volland has a handy set of charts called delta-adjusted gamma, or DAG for short. They automatically adjust the gamma levels based on deltas to show you where dealers would need to buy or sell shares based on gamma hedging at certain price points.
Remember, our goal here is to make better trades by identifying dealer positioning and knowing what actions dealers will likely take at those price points. Dealers want to remain neutral at all times. This means they must offset their options contracts buy going long or short on shares.
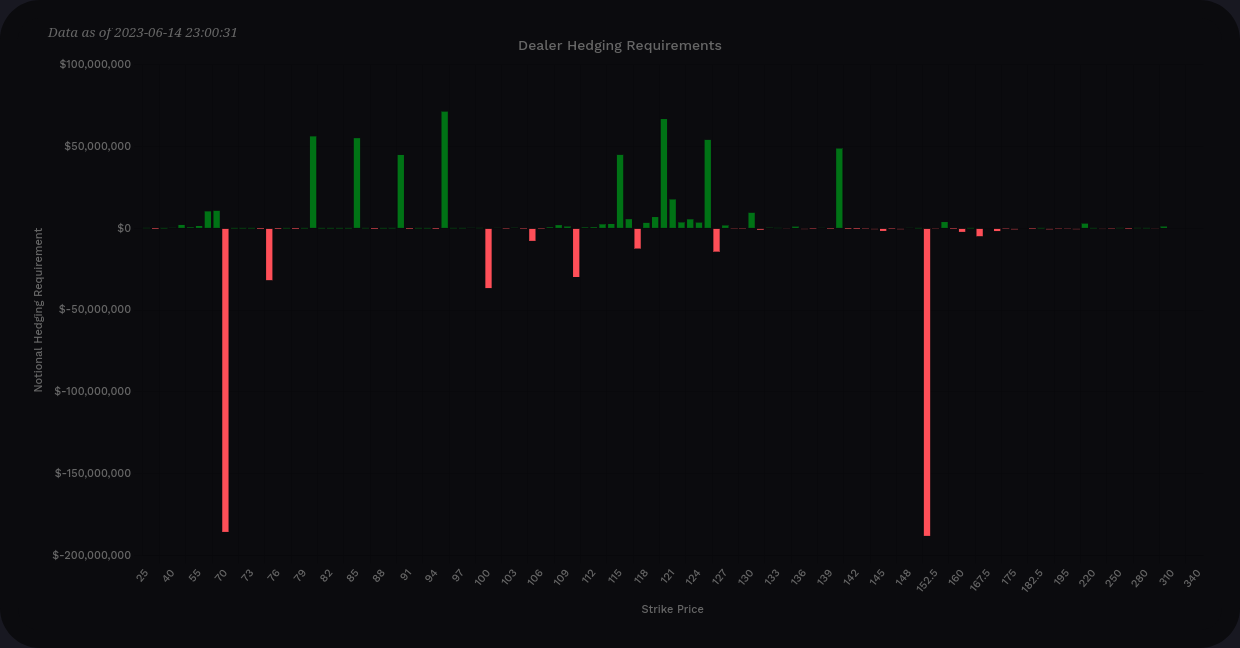
Let's take a peek at the DAG charts:
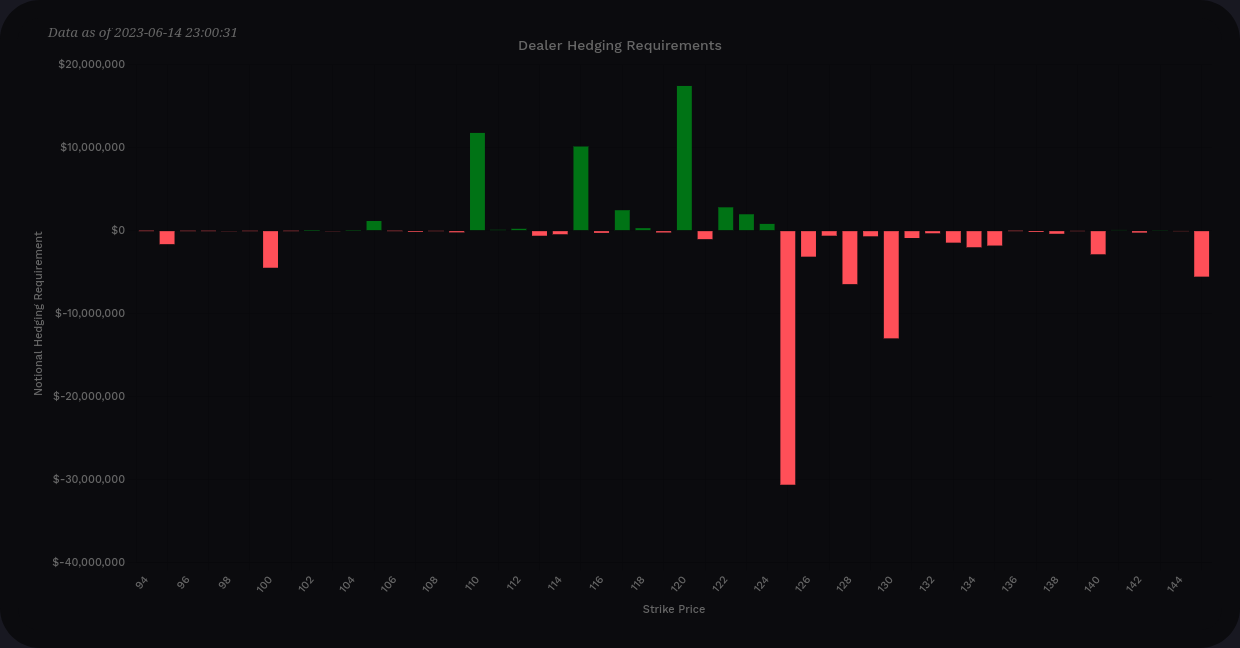
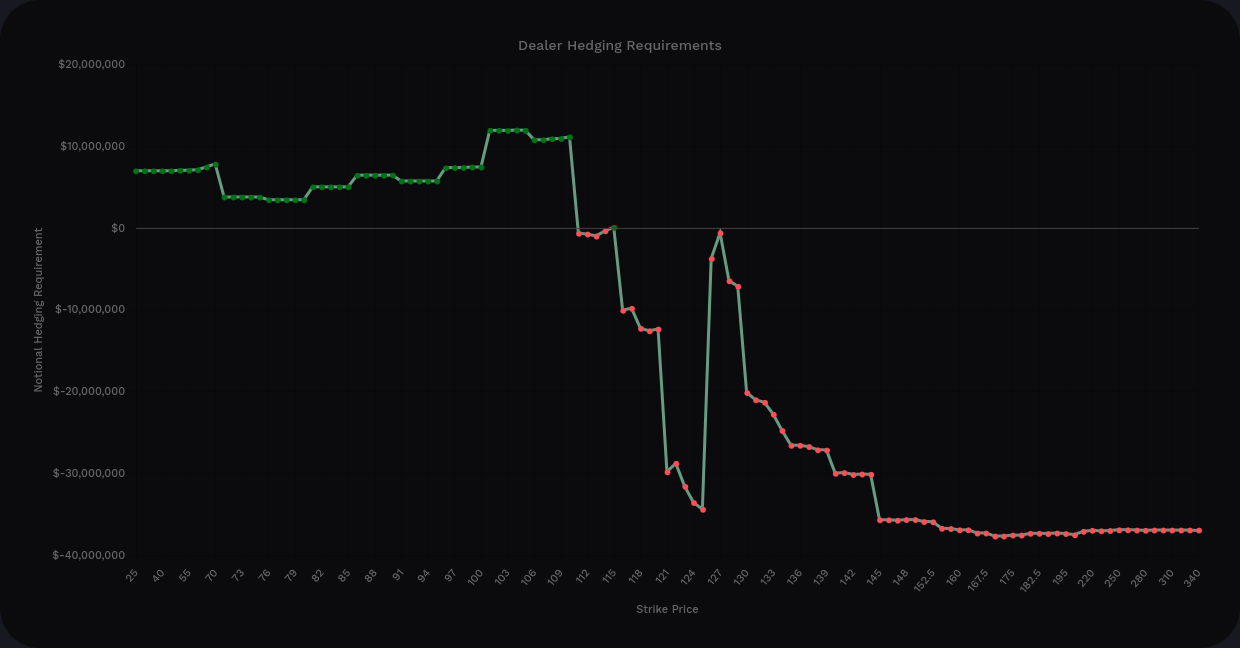
The first thing I notice on the aggregate curve is the Y-axis. Yes, we have selling pressure overall here, but the magnitude is about $35M. Our Y-axis on the vanna charts was $300M at the maximum. Although this isn't a direct translation, such as "vanna is 10x the effect of gamma", this leads me to believe that gamma is a small player in the price action right now. It might have some local effects on price but I wouldn't expect gamma to do much in the short term.
Gamma effects are strongest at $125, but that makes sense because gamma is strongest at the money:
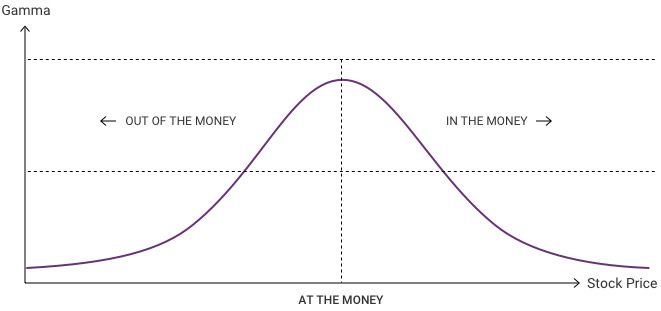
Takeaway: Gamma isn't much of a player for a while. I'll keep an eye on it.
Delta
Sometimes I have a look at delta just for fun:
The left chart shows puts, and it's pretty clear that long puts reign supreme around $150 and $70. The $70 showed up a month or two ago and someone bought up a bunch of LEAPS at the furthest available date.
The calls chart is on the right and it's quite clear that nobody wants to short calls on AMD right now. Could this be a sign that nobody wants to limit their upside right now? Possibly.
My other takeaway here is that the long call Y-axis is massive relative to the short put Y-axis. As IV comes down, it seems like more traders are buying calls since they're cheaper and we're already at very low IV levels.
Other data
Over on Tradytics, we can see that dealers are still short on a 15 day momentum:
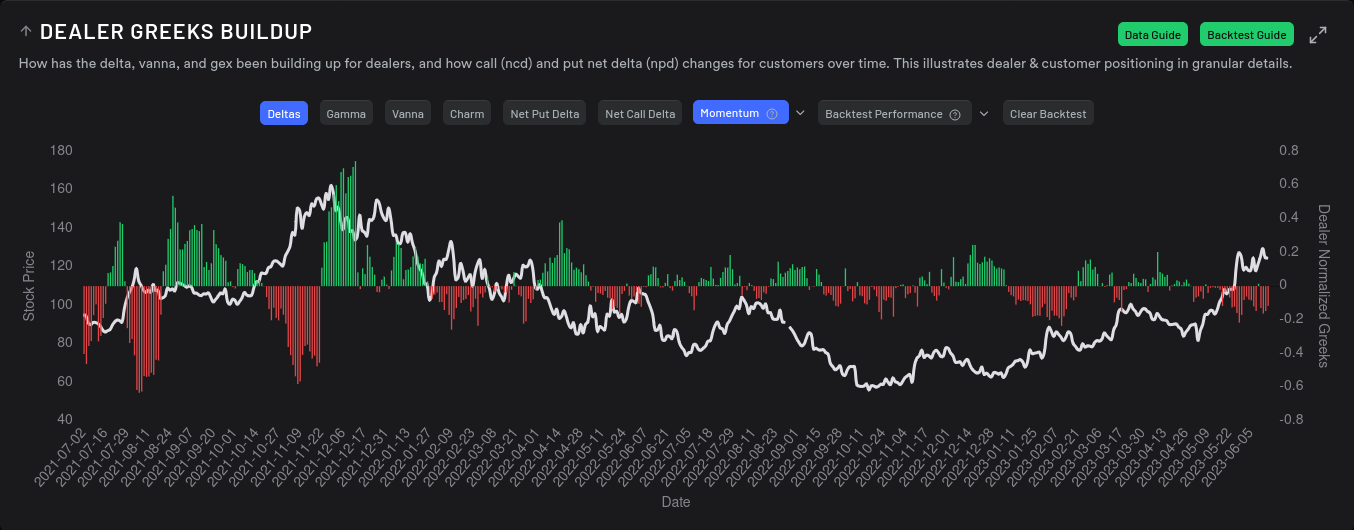
Based on what we saw earlier, this makes sense. There are a ton of bullish contracts out there held by market participants (customers).
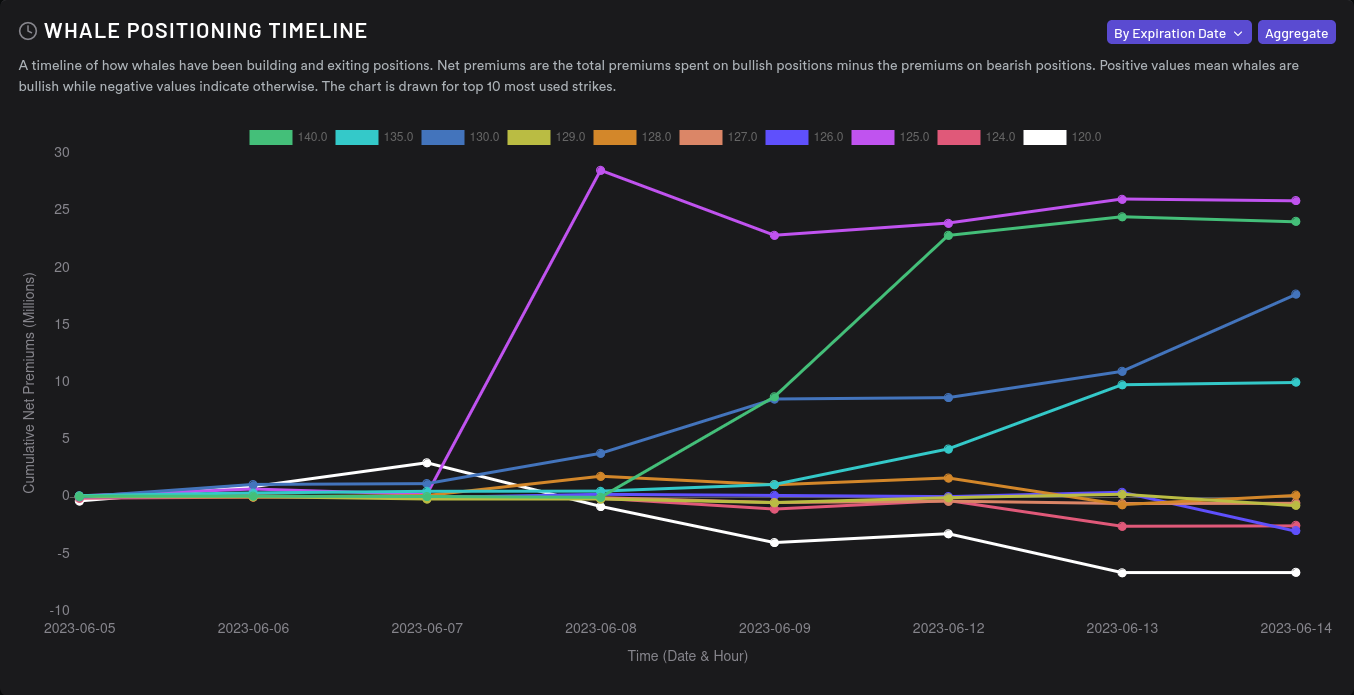
Looking at big options plays shows that many strikes went bullish last week and remain there right now:
Thesis
I'm still bullish on AMD with all of this data. Yes, we've gone up like a rocket recently and IV remains quite low. Those definitely make me feel a little cautious since AMD's current vanna setup is only bullish in the context of IV remaining steady or decreasing.
There's not much I can find that would hinder AMD's progress to $145 with the exception of an IV spike or abrupt news releases regarding supply chains or new product developments.
At the moment, I'm long 600 shares of AMD and I have two short $110 calls expiring this Friday. I sold those calls prematurely on a minor correction and I'm paying dearly for that now (but at least they're covered calls). 😭
If AMD can show some strength past $130, I'll consider adding to my position.
Good luck! Do your homework. Know your max loss. 🍀
All investments come with significant risks, including the loss of all capital. Please do your own research before investing, and never risk more than you are willing to lose. I hold no certifications or registrations with any financial entity.
Discussion