AMD options analysis for 8/25

AMD sits in an interesting spot here. Let's dig into the data and see where we might be going. 📈

Good morning! 🌄
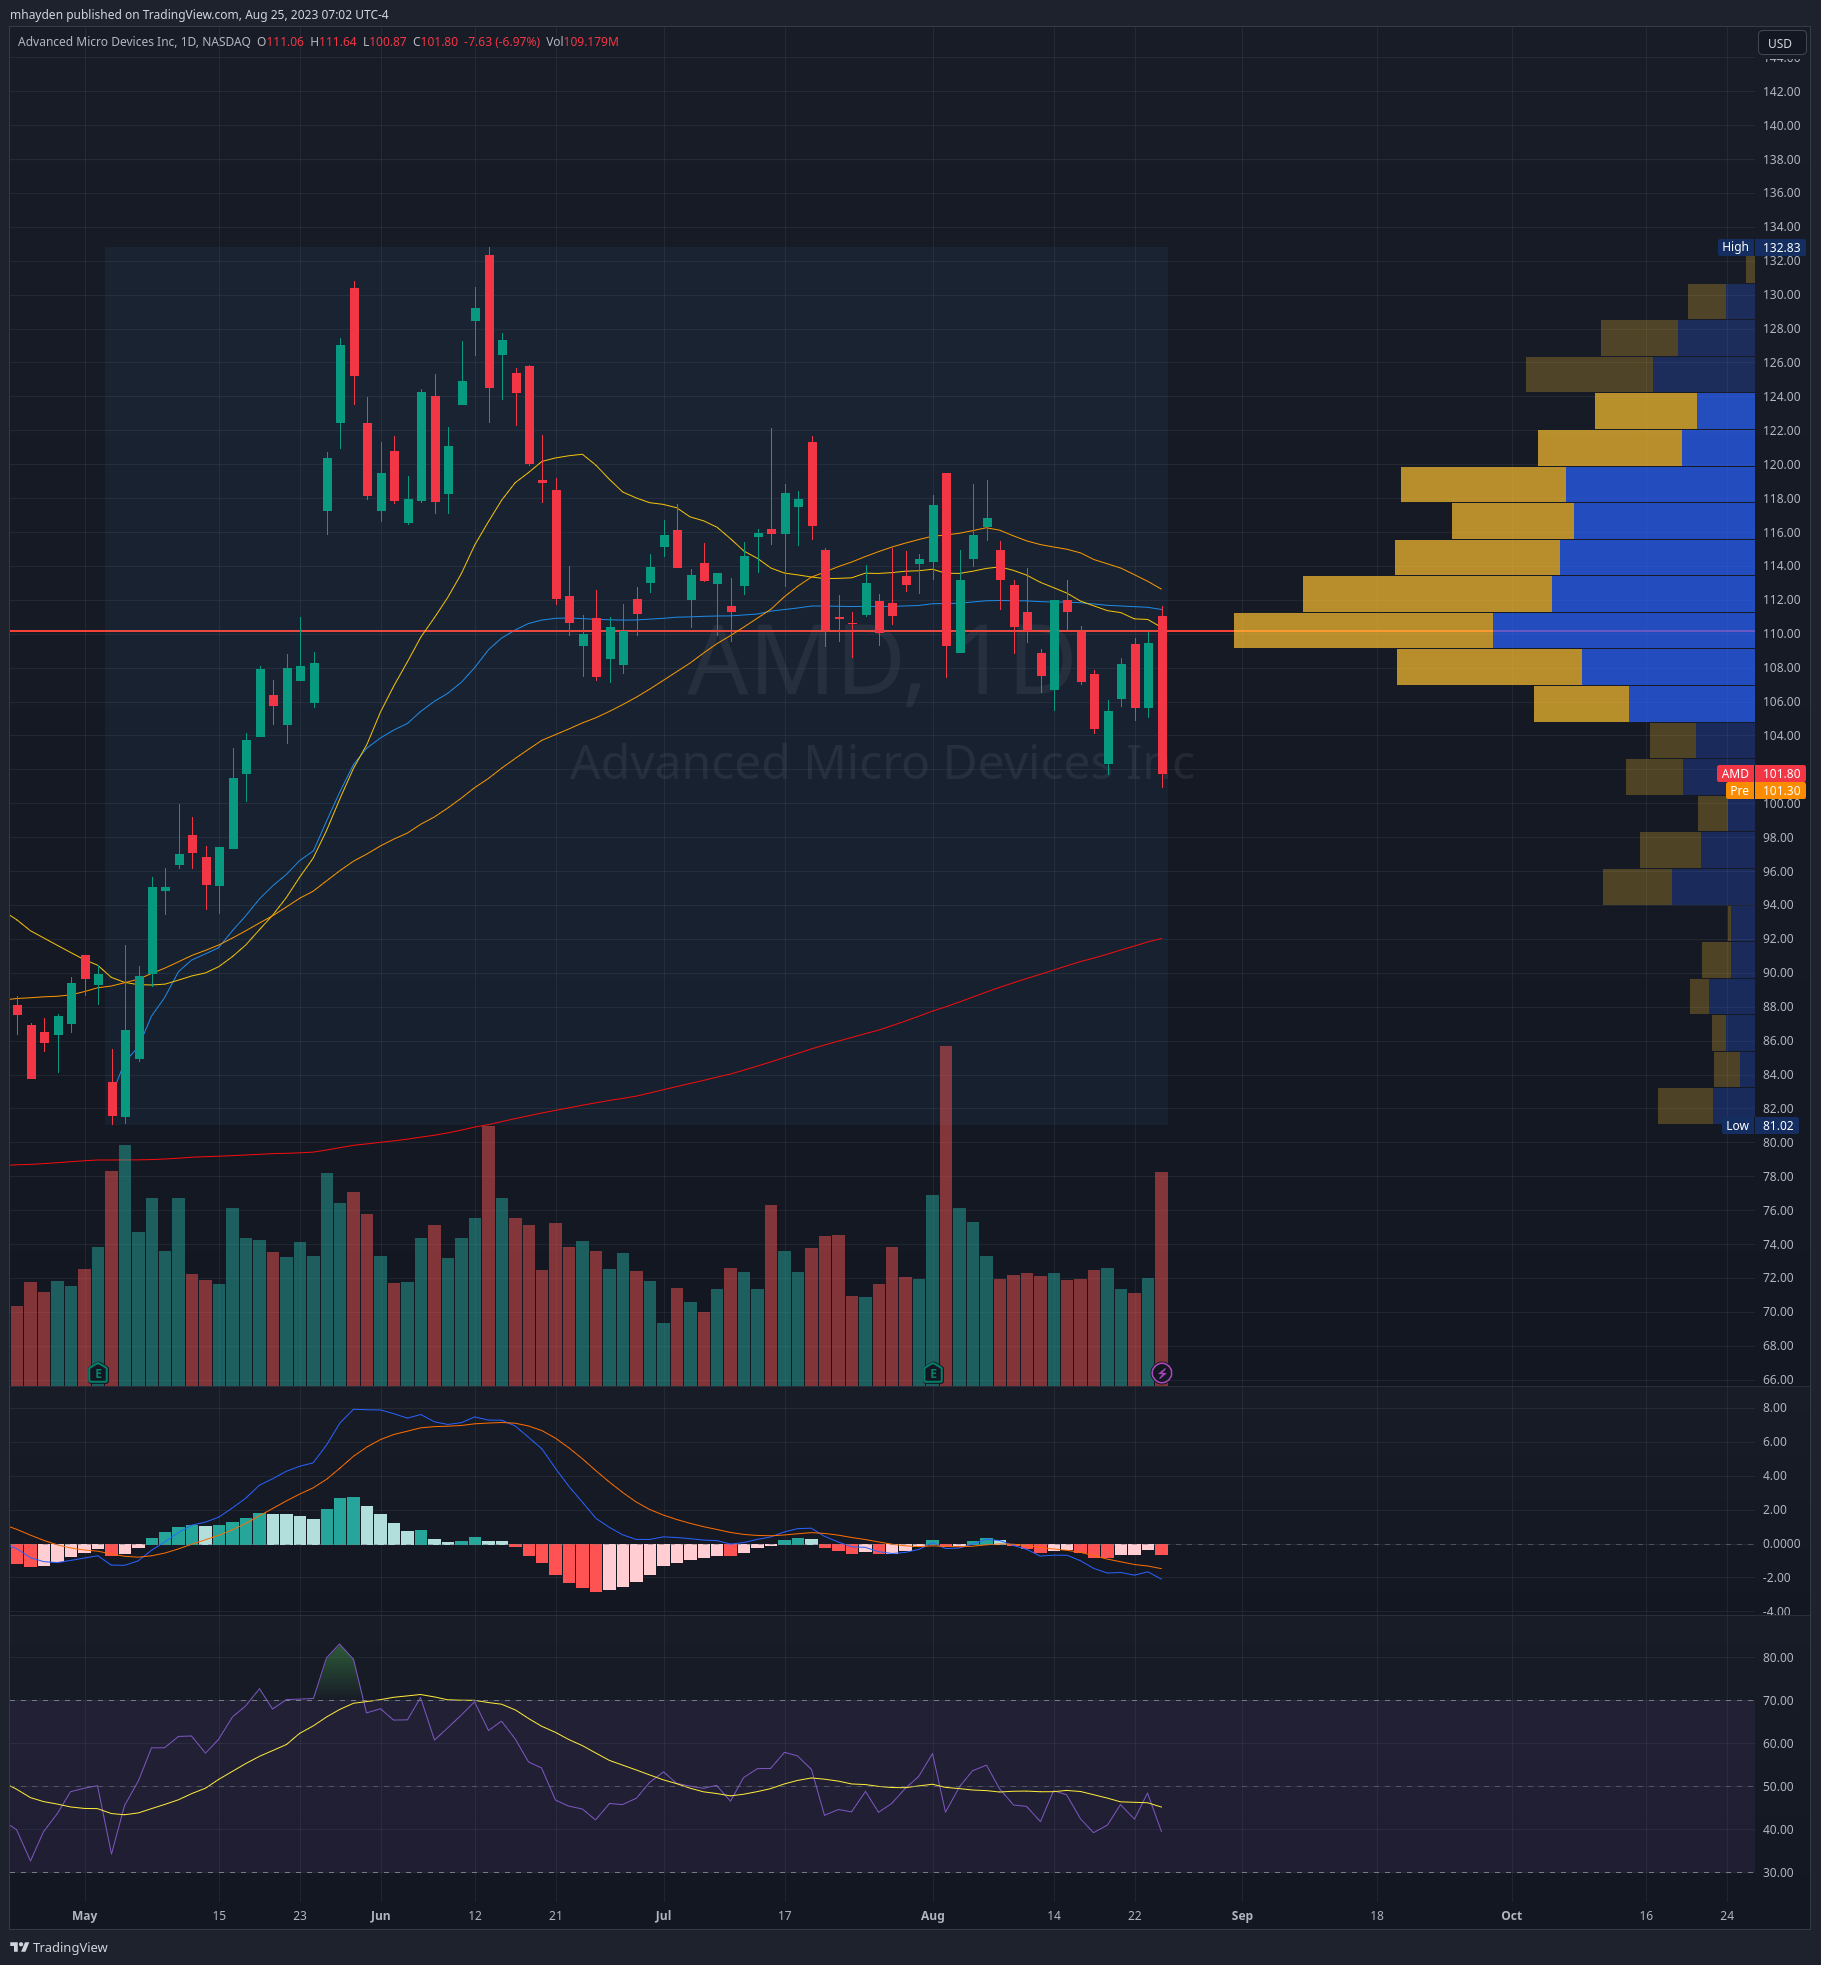
AMD enters Friday in a precarious spot:
- The 20/50MA lines made a death cross on July 19th
- AMD found resistance in its VWAP since earnings yesterday
- MACD is negative
- 14-day RSI is just under 40%
- The gap from May 25th filled
- The point of control since the last earnings is right around $110
The chart argues that AMD is in a moment of weakness, but where might we be going from here? Let's get into it, but first:
All investments come with significant risks, including the loss of all capital. Please do your own research before investing, and never risk more than you are willing to lose. I hold no certifications or registrations with any financial entity.
Happy Friday!
Options positioning
AMD had a strong bullish move in yesterday's options flow but it still remains bearish over a five day period:
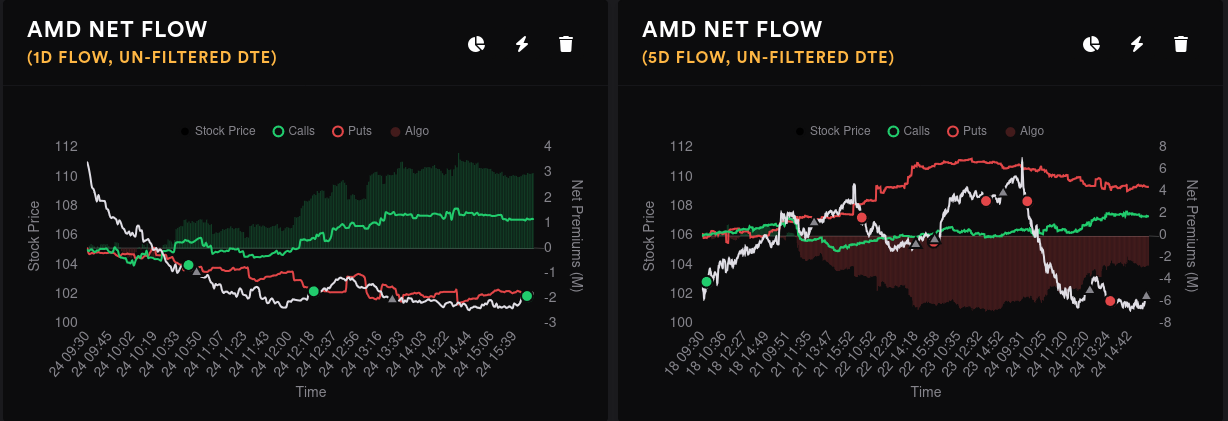
Customer puts flipped bearish Monday and have held those same levels all week long. Calls made smaller bearish moves and they seem to be returning to the midline as the week went on. It's good to see calls and puts moving in a bearish direction but I'd like to see that move be a bit more aggressive than it is right now.
One silver lining here is that options volume increased drastically yesterday. This suggests to me that the bullish flow from yesterday has been confirmed by pretty decent volume.

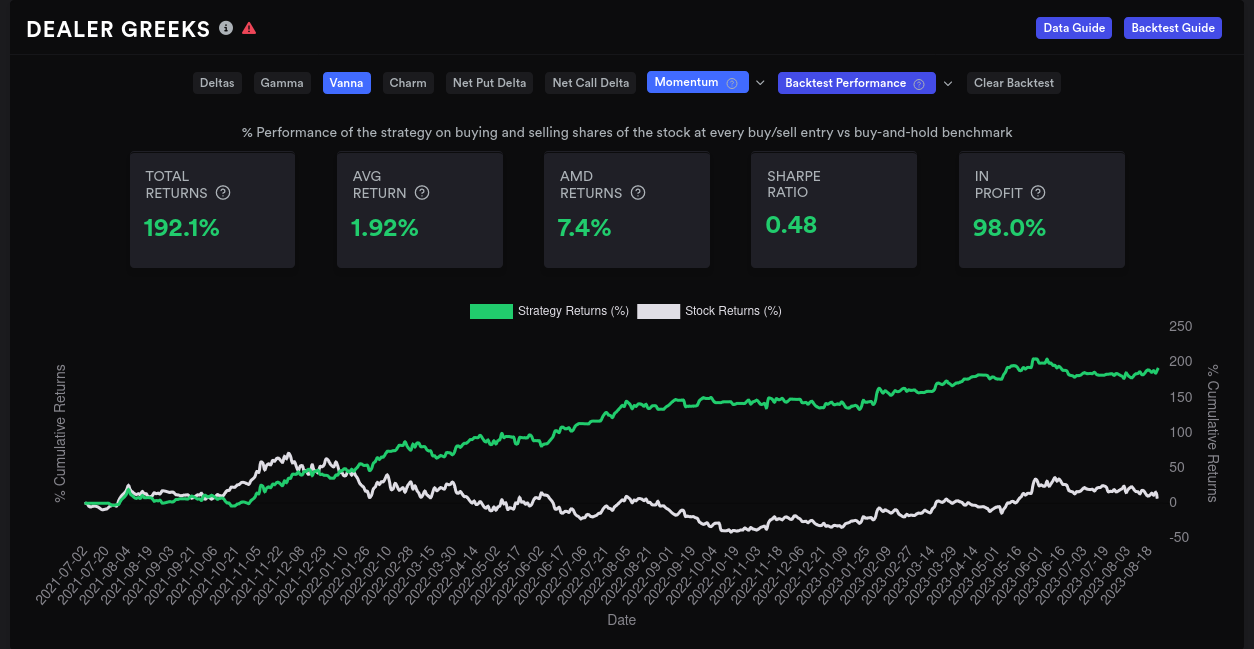
AMD's dealer greeks buildup for deltas over 15 days shows dealers long and customers short (bearish outlook). Vanna buildup for dealers is currently negative and that's been a fairly bullish sign in the past. Past performance does not dictate future gains, but it's hard to argue with this backtest:
Dealer OI suggests a string of bearish expirations for a while. Vanna is mostly positive, which should be bullish if IV remains steady or contracts. Perhaps we're headed into a period of higher than usual implied volatility?

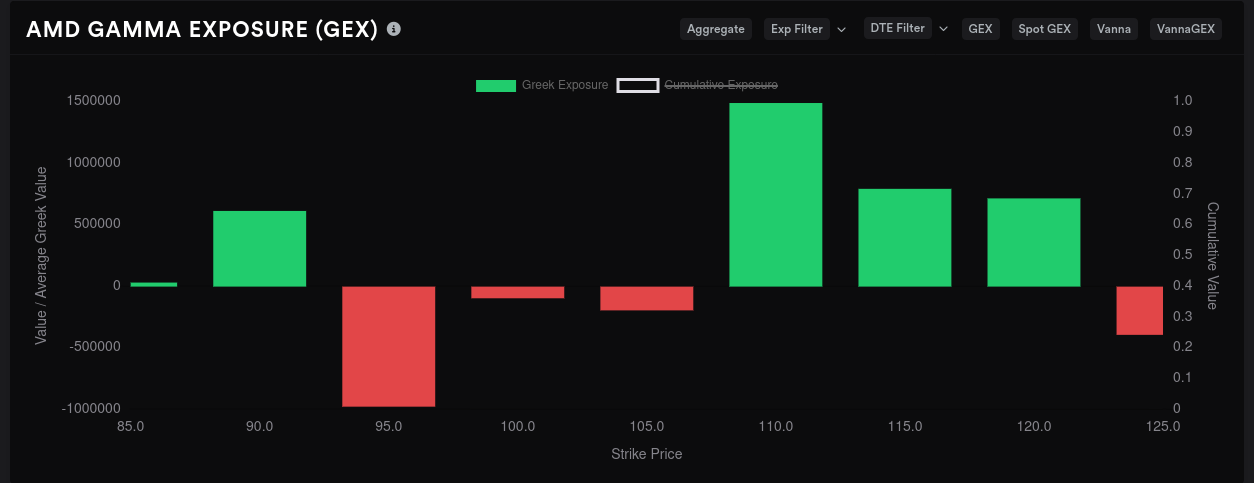
Let's get into GEX. 9/15 has the most GEX, followed by 10/20.
First, aggregate GEX shows price drawing to $108 with a possible pull up to $115. There's a fairly hard stop up around $120. One thing that sticks out to me lately is that the resistance to the downside has faded quite a bit.

The first thing I noticed about the 9/15 GEX is: Where did the downside resistance go? 😱
Sure, we have a nice magnet there at $115, but I really don't like how we're wide open to the downside with almost no positive GEX lines. We have a firm "do not pass" line up around $120 again where AMD has faltered many, many times.

10/20 sure does paint a different picture. The biggest magnet sits around $95 and $110 becomes a resistance point. There's some downside resistance around $90.
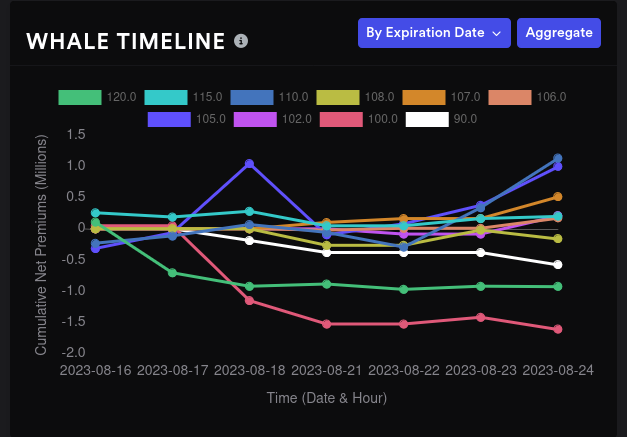
The whales have gone very bearish on $110 lately:

For 9/15, some bullish moves on $105 and $110 appear, but they're quite weak. $100 has some bearish movement that is much stronger.
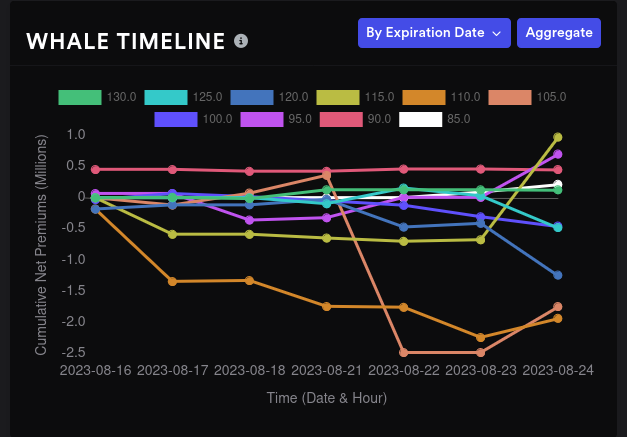
10/20 shows some bearish moves for $105 and $110 that are pulling back slightly. $115 has a definite spike upwards and I'm curious to see if that continues.
Vanna
AMD's aggregate vanna from Volland looks unusual. Contracting IV could pull us up to $110, but not much further than that. $105 will fight that move a bit once we get into that 0.15-0.35 delta range of that strike.
$105 for 9/15 is sitting around 0.40 delta this morning, so if we push up a little, the effects of the $105 will shrink to almost zero.
$90 is hanging out there all by itself and it could be a target for us if IV expands a lot.
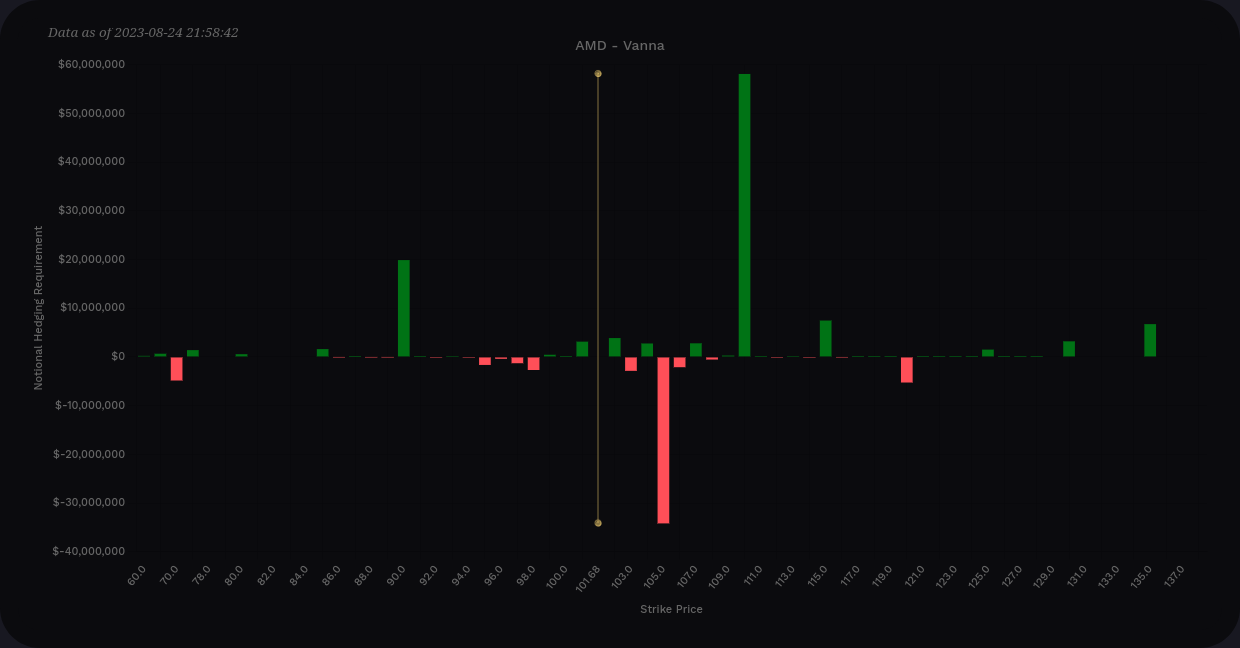
9/15 vanna suggests a possible $90 to $110 range, but more likely a $98-$103 range.
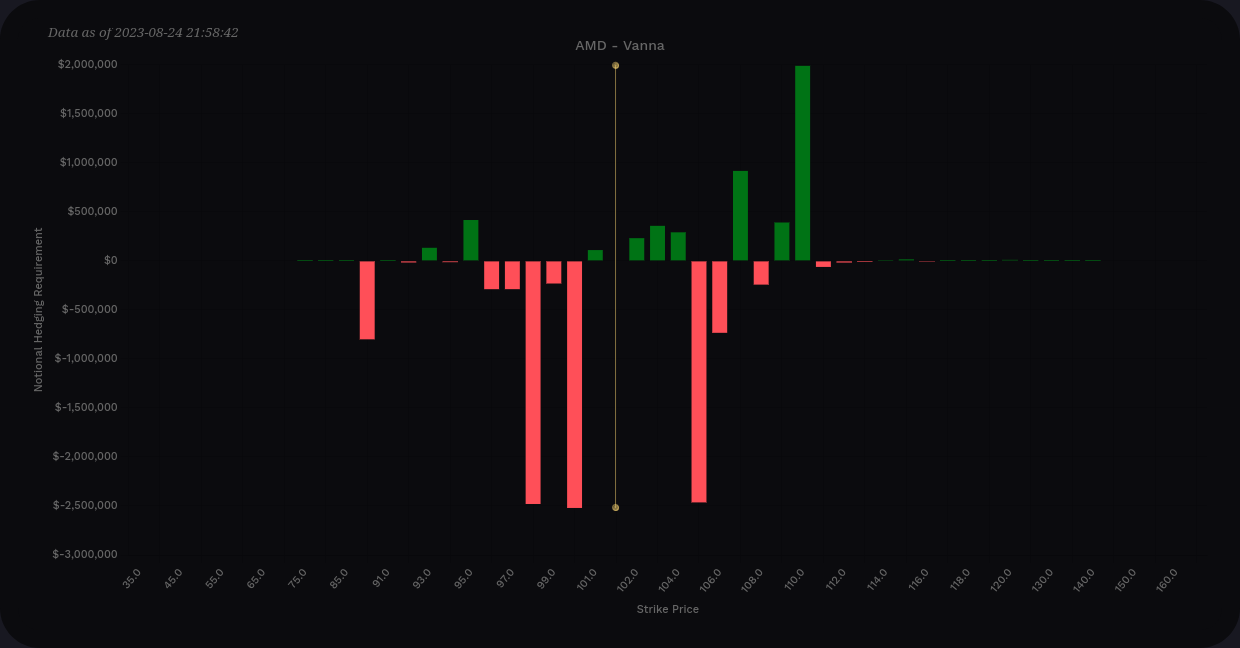
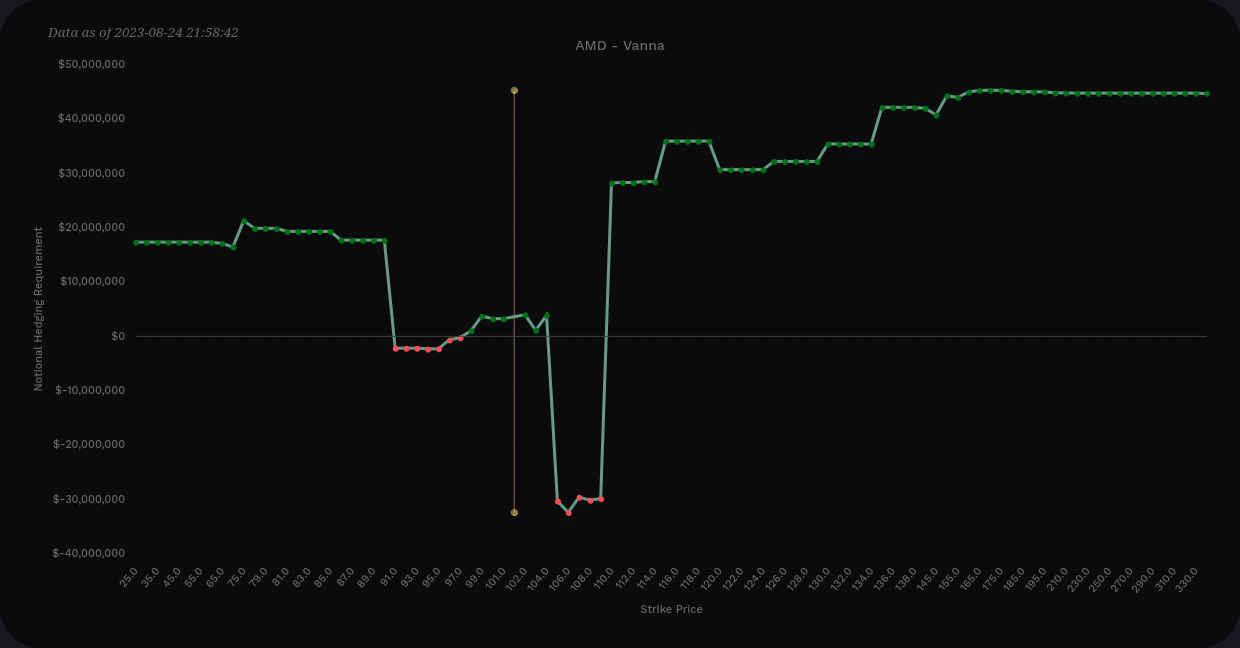
10/20 vanna is mostly negative. Expanding IV could send us down to $90-$95, but contracting IV will find it difficult to get past $105-$110.

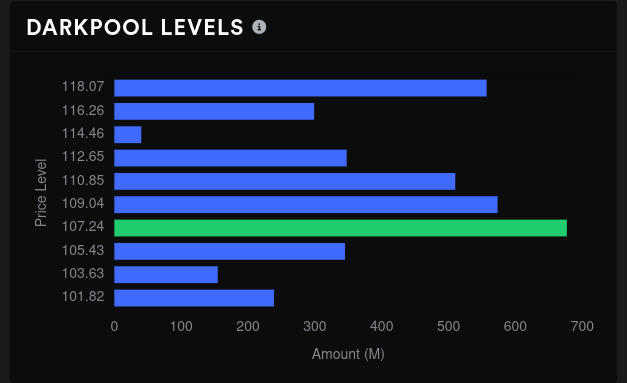
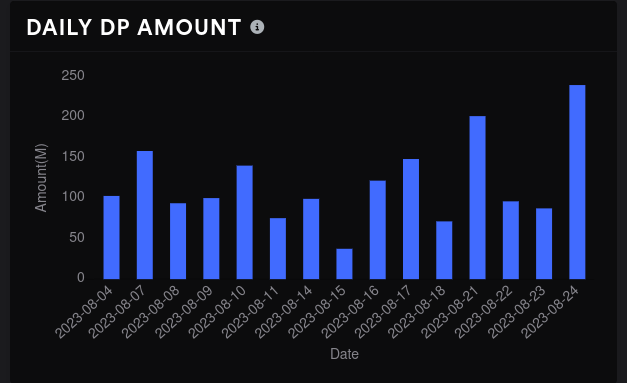
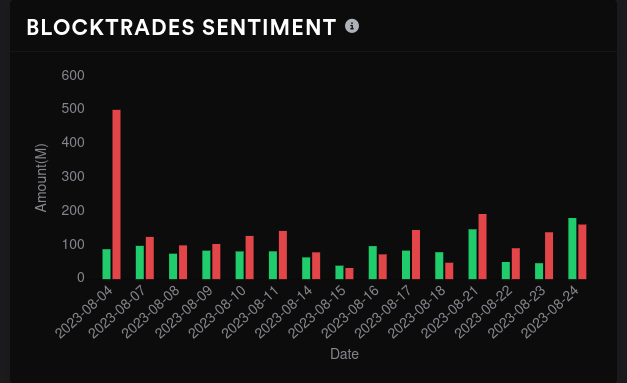
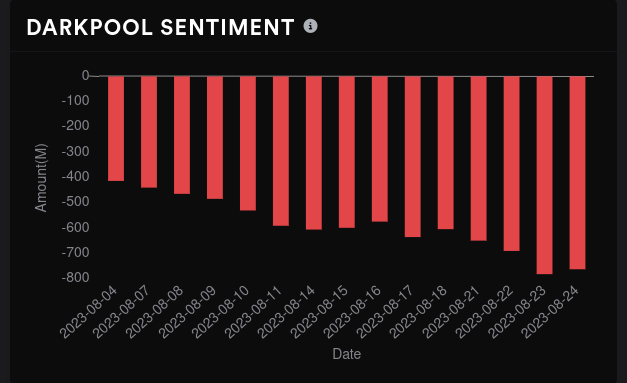
Dark pool data
Just as a reminder, I don't trade based on dark pools, but I do look to see if they correlate with some of the other technical analysis and options positioning. If they differ, I usually go back and question some of my assumptions from the other data. 😉
Volume increased in dark pool trades significantly yesterday. That matches the options volume spike mentioned earlier. Yesterday's sentiment was fairly even with the bulls getting a slight edge. Overall sentiment is still very bearish.
$107 is our biggest level and it's part of a high volume range from $105-$112. This gives me some hope that we might make a run to $107-108 soon but that run might falter as we go into 10/20.
One last thing
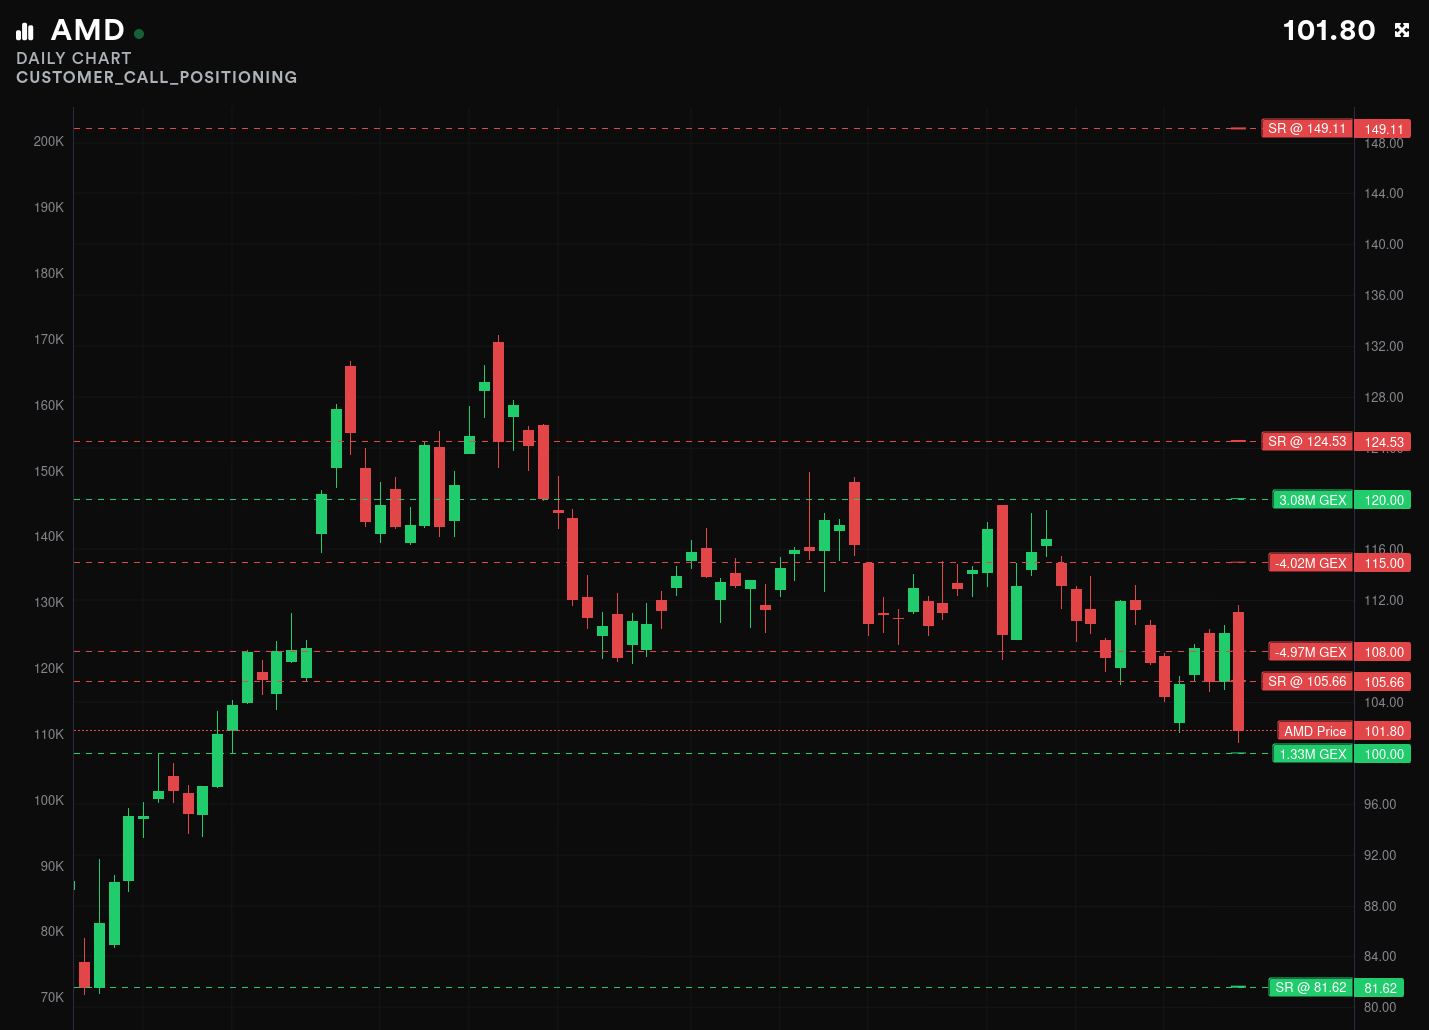
Tradytics has an awesome new charting feature where you can overlay all kinds of metrics on a chart to see everything in one place. We might catch a bounce from $100 since it's a big psychological level and there's a decent amount of gamma exposure there.
Thesis
AMD has plenty of weakness signs right now, but for the first time in a while, I'm also starting to see some signs of turning a corner. $100 is a critical level to maintain, and if we lose it, there's not much to help us back up to $100 through 9/15.
So what are these "turning a corner" signs?
- We're approaching $100, a big psychological level
- Yesterday's options flow was firmly bullish with increasing volume
- Dark pool volume increased with a slight edge for bullish traders
- Our biggest negative GEX line is growing larger at $108 through 9/15
- The point of control from the volume by price indicator sits around $110 since earnings
- Biggest dark pool level is around $107
However, I'm not looking at a big bullish move like the May rally. This would likely involve trading inside a range from $95-$110 through 10/20.
Most of my covered calls reached 40-50% gains yesterday and I bought them back. I still have a short $105p and short $103c for 9/15. All of my trades are up to date on Theta Gang along with notes for each trade.
Good luck today and have a great weekend! 🍀 🌴
Discussion