AMD pre-earnings analysis for 10/24

We're one week away from AMD's earnings on 10/31. Will we get tricks or treats next week? 🎃

AMD reports after the market closes on 10/31 and I'm looking for treats with no tricks. 🎃
The semiconductor space had a nice boost this year thanks to the AI bonanza, but it feels like this quarter is finally when the market is demanding that everyone show what they have. I'll get past the bias and dig into the data today to see what's happening with AMD now and where the bets for earnings might be.
All investments come with significant risks, including the loss of all capital. Please do your own research before investing, and never risk more than you are willing to lose. I hold no certifications or registrations with any financial entity.
Let's get into it!
Options flow
AMD's overall flow yesterday turned bullish and kept rising even as the price dipped towards the end of the day. NVDA announced some news about Arm chips and AMD dropped a bit after hours along with other semiconductor stocks.

If we zoom out to five days, we can see that the bullish flow is outpacing the bearish flow for the past two trading days.

Bearish bets are coming in for this Friday from $95-100 and bullish bets run from $102 to $111 with a peak at $105.
Vanna
Vanna measures how much deltas change as implied volatility (IV) changes. As a reminder, positive vanna combined with a reduction in volatility leads to bullish price action.
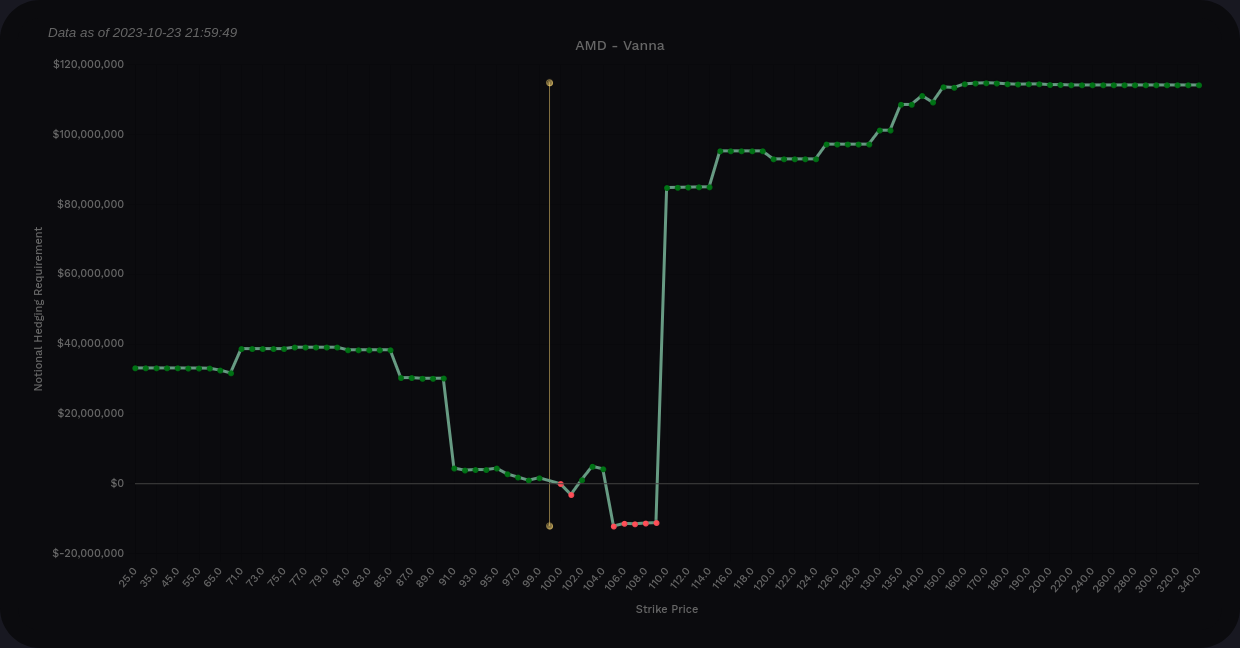
AMD's aggregate vanna is entirely positive from looking at the extremes on the vanna curve. The curve above price is higher and that's a good sign for bullish price action if IV contracts (which it usually does after earnings unless we get more surprises there).
On the detailed strikes, we're looking at a very bullish $110 without much else. On the lower end, $90 shows up as a fairly weak stopping point if price moves down.
Remember that vanna needs some room to operate and has the strongest effects about 0.15-0.35 delta from the strike. Vanna effects run to zero as price moves on top of the strike.
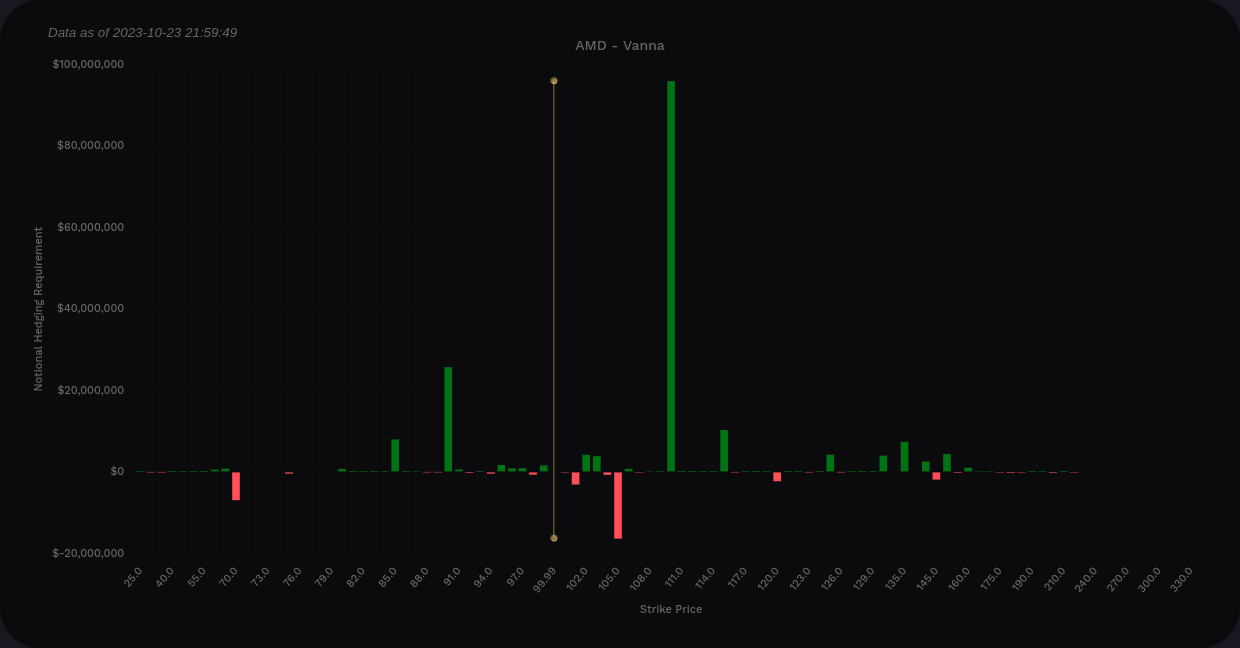
AMD aggregate vanna from volland
If we narrow our scope to 10/27 to 12/15 only, we see another pattern emerge. The $110 shrinks and we get some other relatively strong levels. $95-$110 seems like the main range here with some outliers at $90 and $115.

Dealer positioning
Knowing where dealers sit can help us better understand what customers are doing in the market. Dealers are currently short by a very small amount and AMD's dealer deltas have been quite calm since September relative to the past. This suggests to me that bearish and bullish customers are almost even on AMD right now.
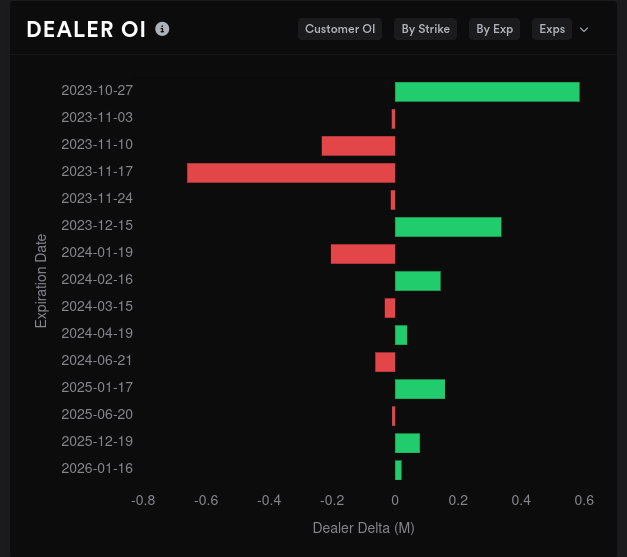
Open interest for dealer trades suggests we're in for a bearish week this week. 11/17 looks quite bullish and then bearishness returns on 12/15. However, none of these lines get close to cracking 1M dealer deltas, so there's not much useful data here.
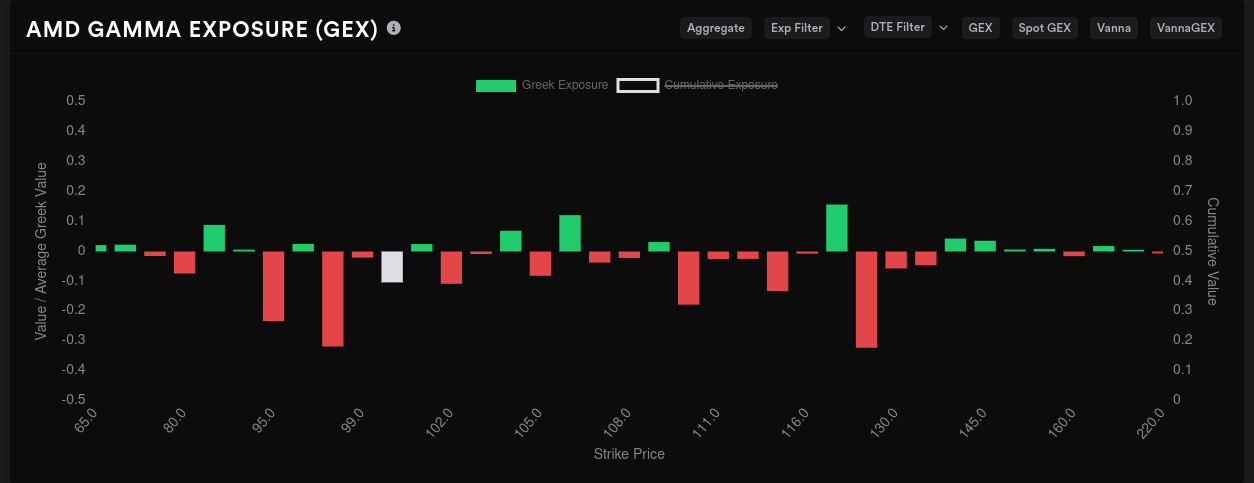
Gamma exposure
AMD's largest negative GEX on aggregate sits at $98 and $125. That's an interesting combination.
11/17 shows $125 as the most negative with almost no resistance on the chart. However, vanna charts don't seem to support this amount of movement. 🤔

12/15 continues with the "maybe $95, maybe $130" idea. $95 would be well in range based on the stock chart and vanna data, but $130 does not match up here.

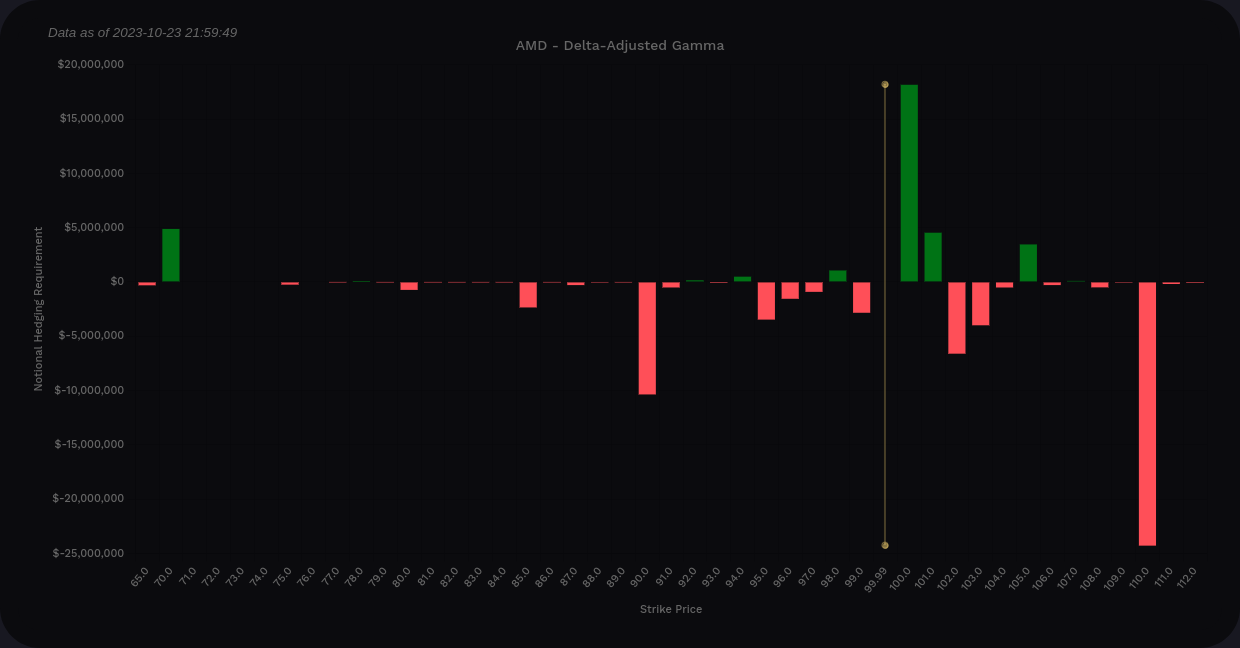
Volland also has delta-adjusted gamma, or DAG, that takes a different approach. Gamma above price is flipped so you can read this chart as "green means dealers buy, red means dealers sell".
This chart suggests that dealers will sell aggressively at $110 and this matches up with the $110 vanna level. It suggests $100 as another buy point for dealers and we saw some of that yesterday as AMD tried to breach $100 after hours and started coming back up.
Bear in mind that negative gamma (shown as positive here above price) repels in both directions, so if price passes it, it gets a momentum boost to continue.
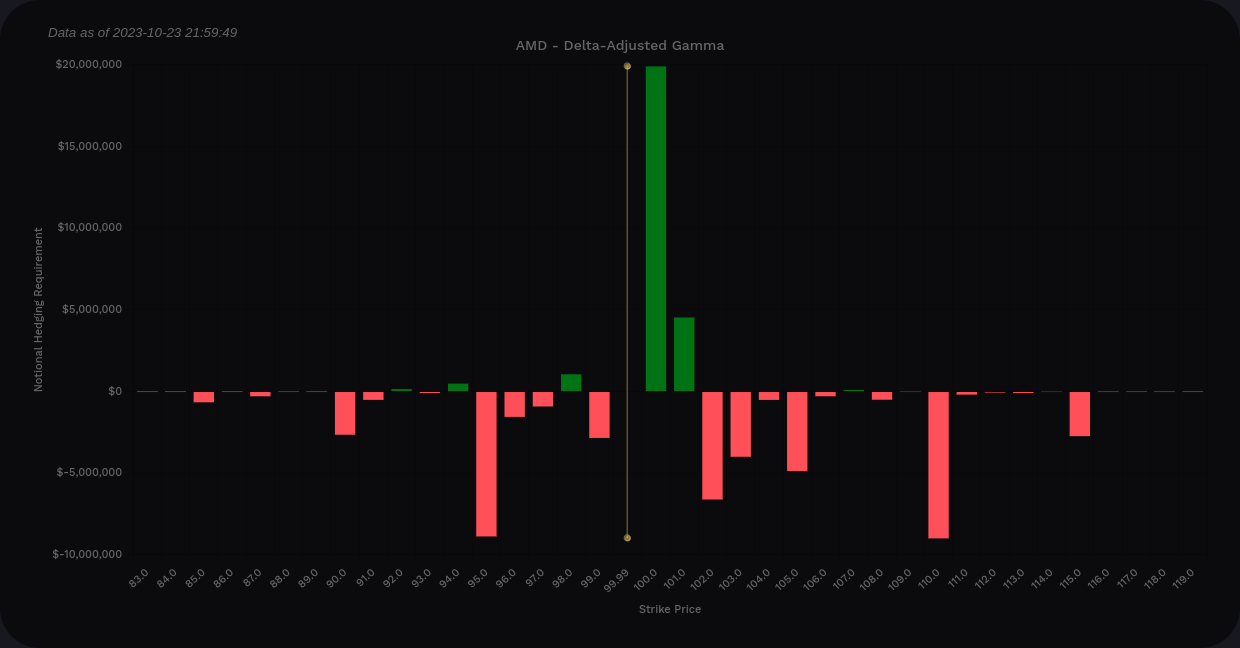
Looking at now through 12/15 only, the main buy point here for dealers is at $100. The boundaries here seem to run from $95-$110 and this matches the vanna data.
Chart
This four hour chart looks a bit busy, but here's what you can look for:
- Yellow order blocks are from the four hour time frame
- Pink/magenta order blocks are from the daily time frame
- Green bars hint a bullish trend, red hints bearish, and purple are indecisive
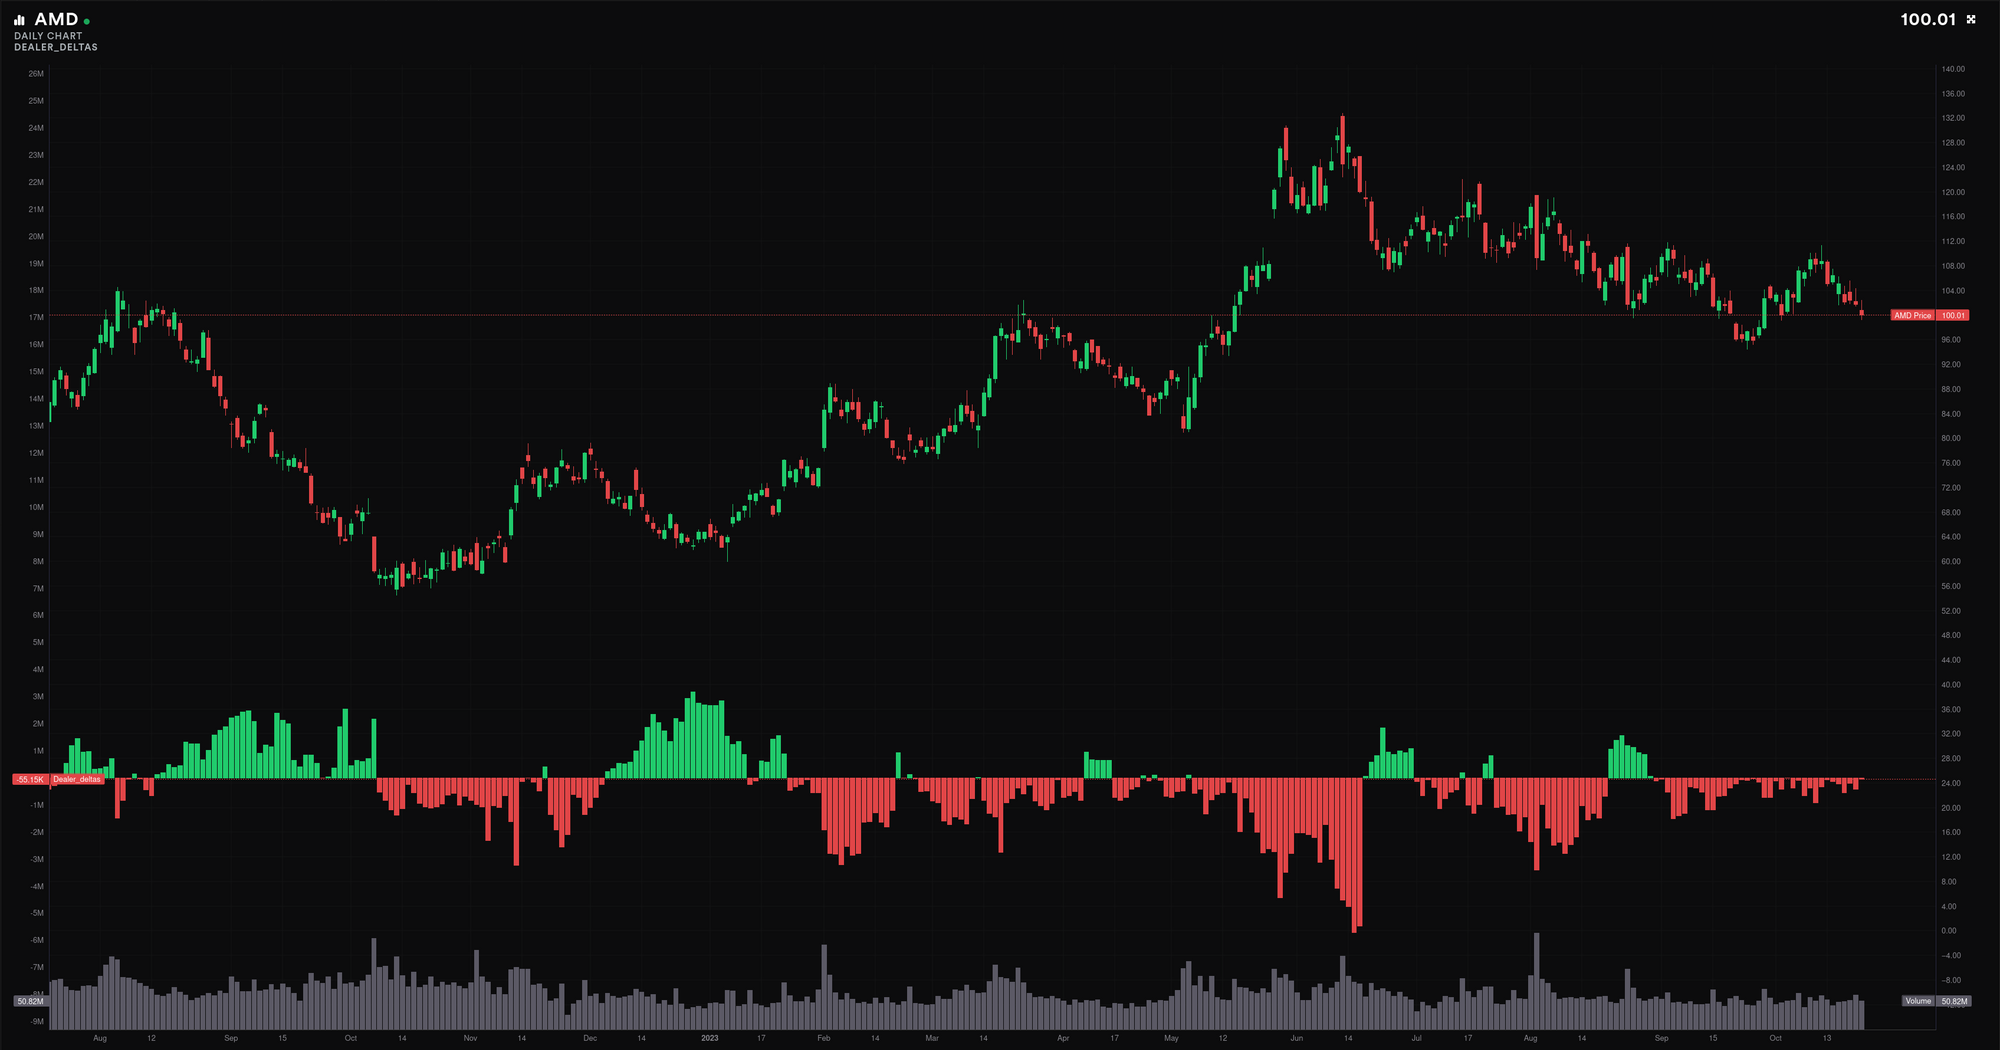
AMD broke from indecisive to bearish yesterday, but it landed on a 4h order block overnight and bounced out of it this morning. If it does make a small rally, we could be looking at another stop around $106 when the next 4h order block appears.
A run down has a lot more room to travel and that could explain why we have light vanna below the current price. $95 is a recent resistance level and below that, we have another order block starting at $85. There's a breaker block (an order block that was mitigated already by price action) at $90 that could have some kind of an effect on price.
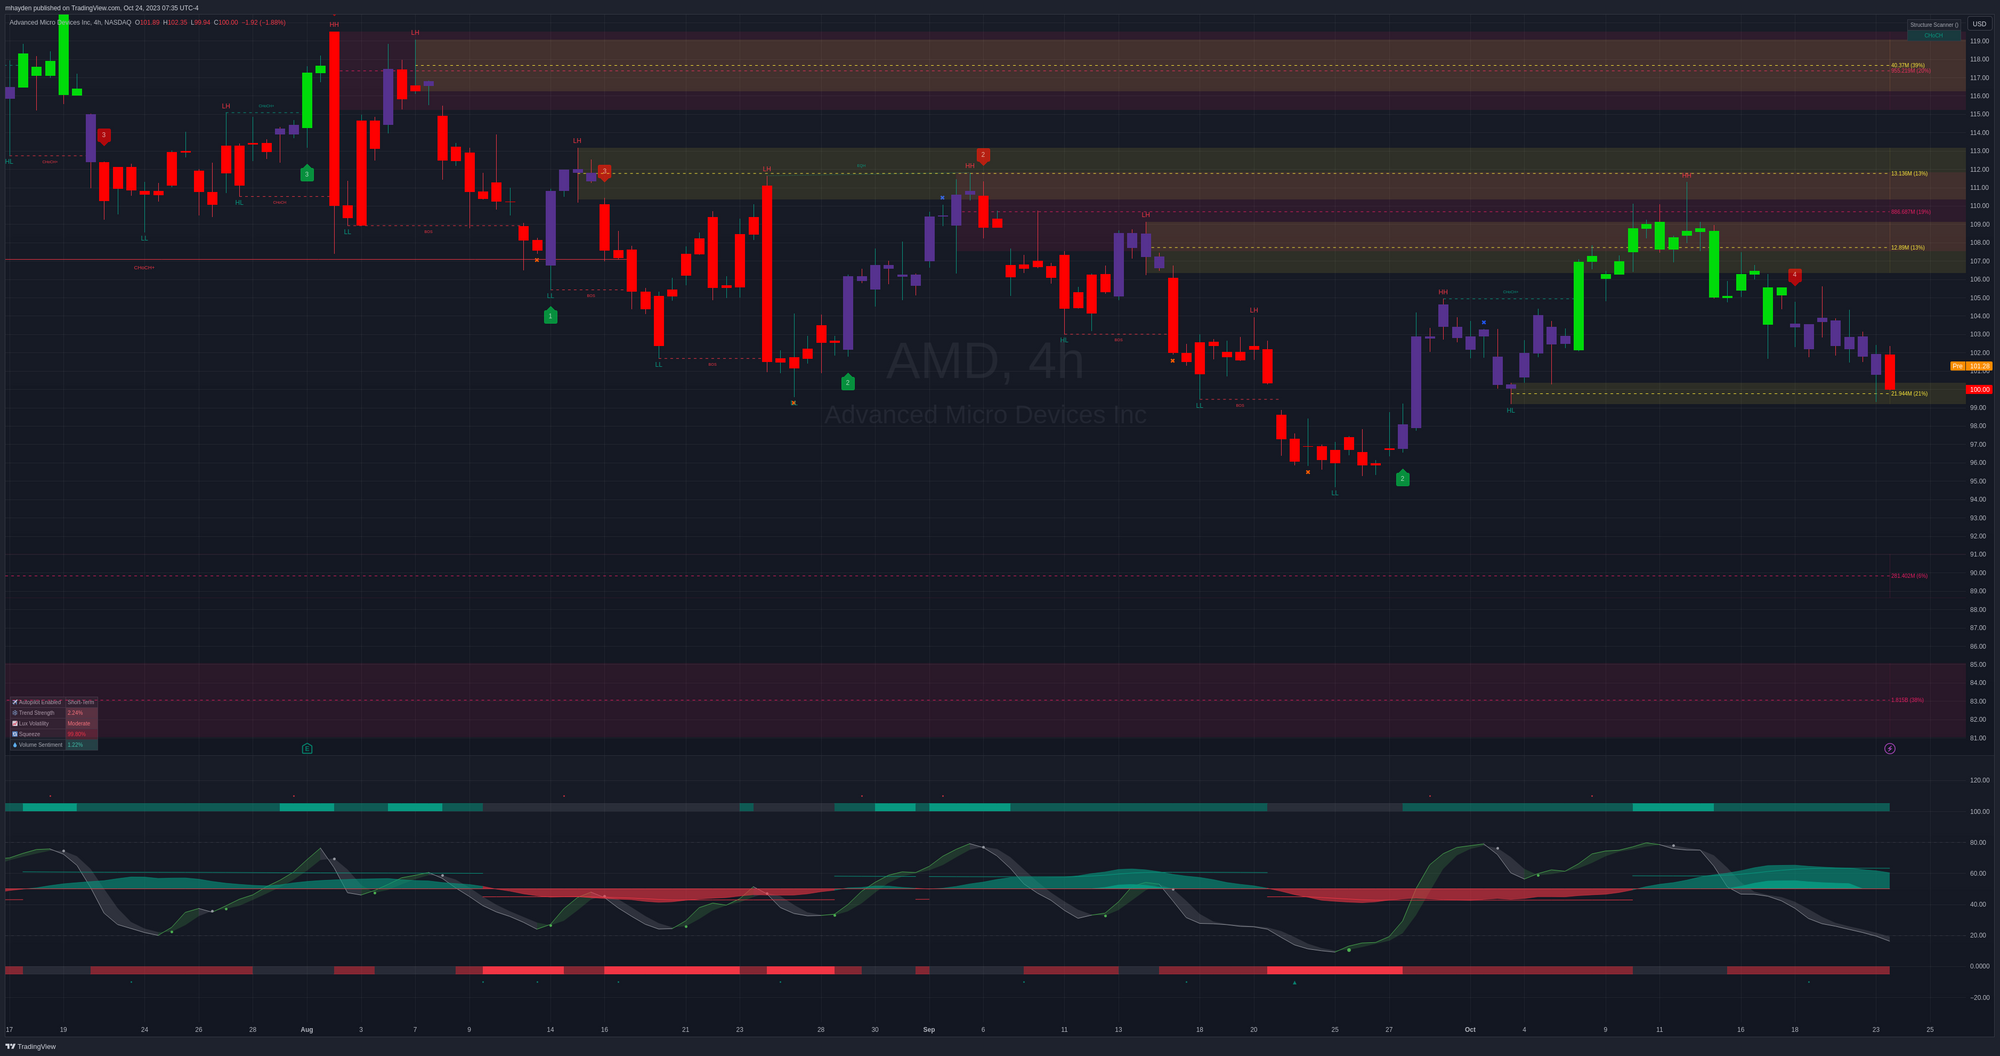
The oscillator on the bottom section of the chart tells us that the money flow is bullish, but waning. The overflow (light greenish mountain under the big darker green mountain) has run out. The wave flashed a bearish signal on 10/11 and has trended down since then.
AMD's price action is definitely in a squeeze right now. There's a chance it can bust open for a decent sized move soon, but it seems hemmed in by vanna, gamma, and order blocks on the chart.
Thesis
This quarter feels like the one where the market will make stronger demands on companies to justify their valuations, especially on artificial intelligence. Everyone seems to be watching these earnings closely to get a better read on how inflation and changing interest rate is affecting various types of companies.
AMD has some nice bullish bets on the top end around $125, but it's difficult to find any data that would support a move that high. It would require AMD to exceed all vanna levels, break through multiple order blocks, and slice through the $118-$120 level that has been a huge problem for quite some time.
I'm sitting on too many AMD shares right now and I've been selling some aggressive covered calls expiring this Friday, 10/27. I've sold ten altogether with half on the $103 and half on the $104. I'd be glad to take assignment on Friday on some or all of these to avoid some risk going into next week. My cost basis is $88.29, so that would secure some decent profits.
Remember that making any kind of trade across earnings comes with significant risk. Binary events, such as earnings calls, move price in unpredictable ways. I'd argue that even if I had AMD's earnings filing for next week on my desk this morning, I would have a really difficult time making a trade that would be profitable. 🤣
Good luck this week! 🍀
Discussion