AMD quick look for 6/22

AMD's correction is underway, but how far down will we go? 🤔

Let's see how data changed (or perhaps didn't change) for AMD since our last look on Tuesday. We have a correction underway right now with some conflicting data around potential supports.
But first, a reminder:
All investments come with significant risks, including the loss of all capital. Please do your own research before investing, and never risk more than you are willing to lose. I hold no certifications or registrations with any financial entity.
Also:
Technical analysis
AMD's price dipped underneath the 20 day moving average since Tuesday and that's the only technical indicator I can find with a bearish tilt. Here are the critical levels for AMD from Barchart:

We have several important technical levels between the current price and $103, but there's not a lot after that until we reach the $80-$90 range. Let's try to narrow that down a bit with options data.
Options data
Vanna tilted aggressively towards the positive side on aggregate. Extremes on the vanna curve show +$364M and -$77M:
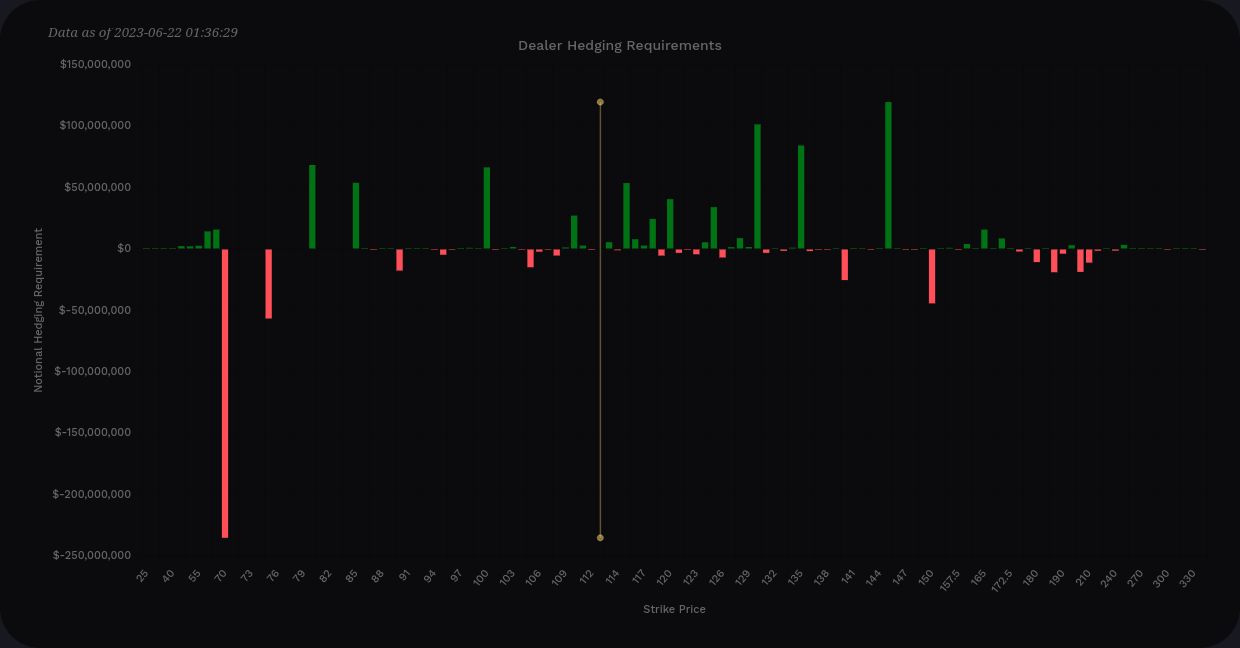
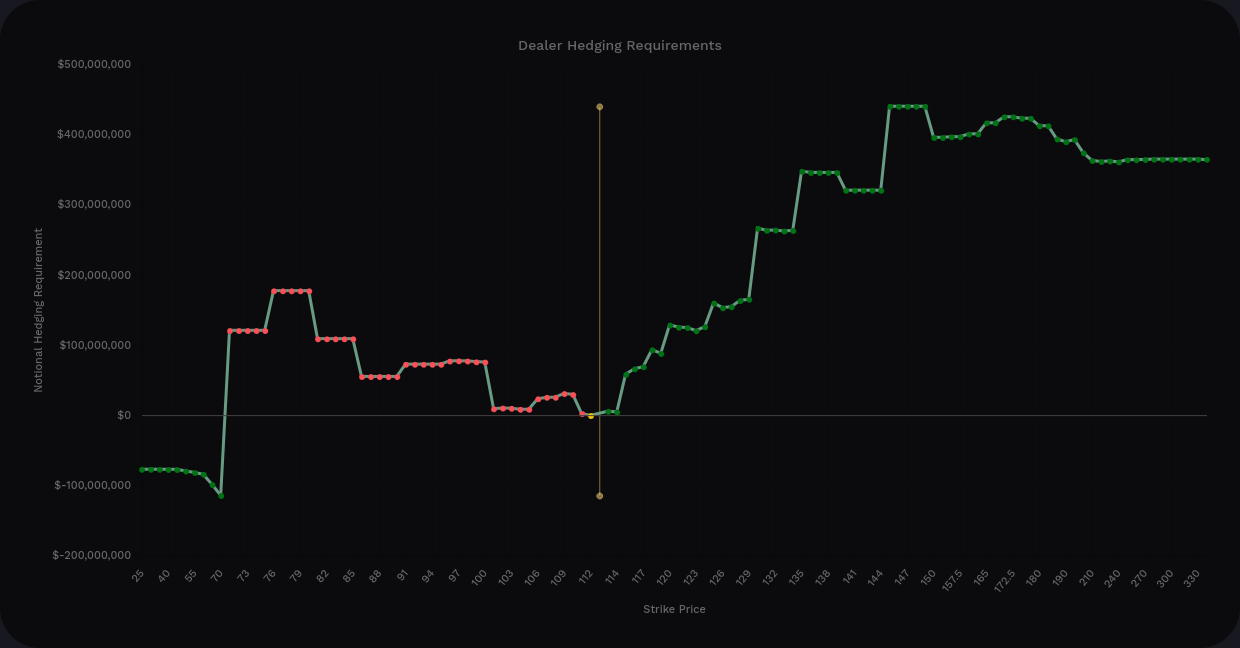
That big LEAPS contract line for $70 still looms, but it's a long way out and hasn't moved much. What caught my eye today are those $130 and $145 lines that crossed above $100M in notional value. There was plenty of activity on the call side for AMD yesterday dated out to August and October:

Increasing implied volatility (IV) would not help bullish AMD traders with this vanna setup. Positive vanna above price can become a magnet for price when IV is dropping or holding steady. AMD's IV shows a spike during the current correction:

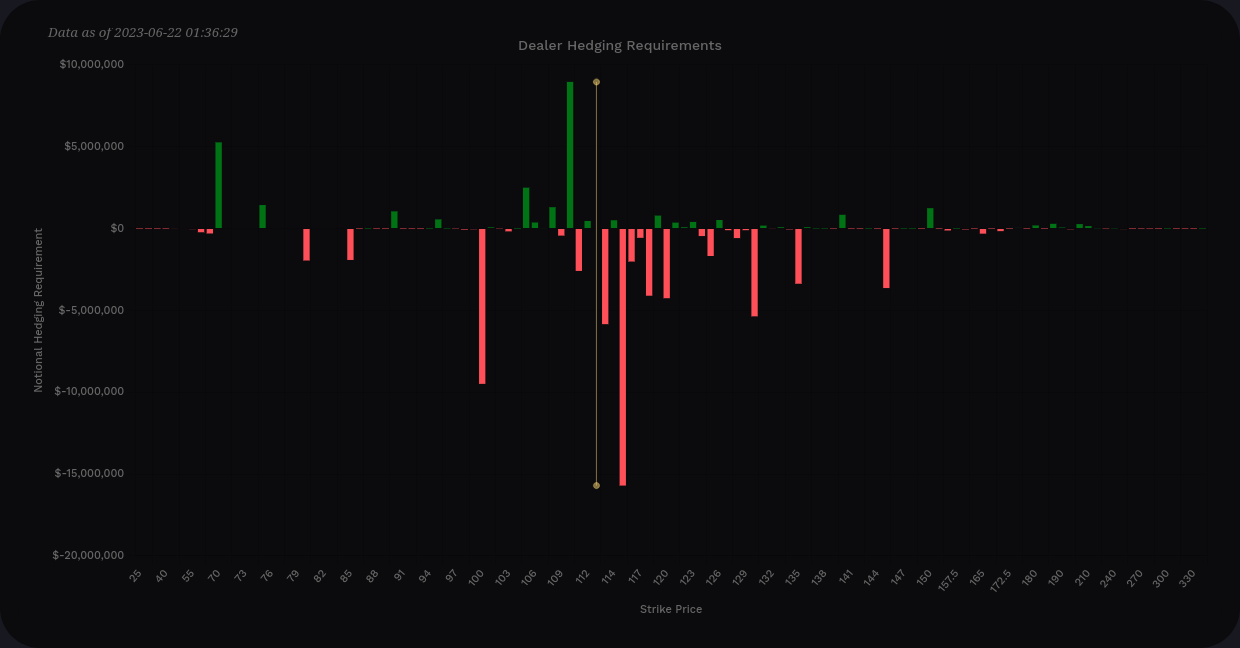
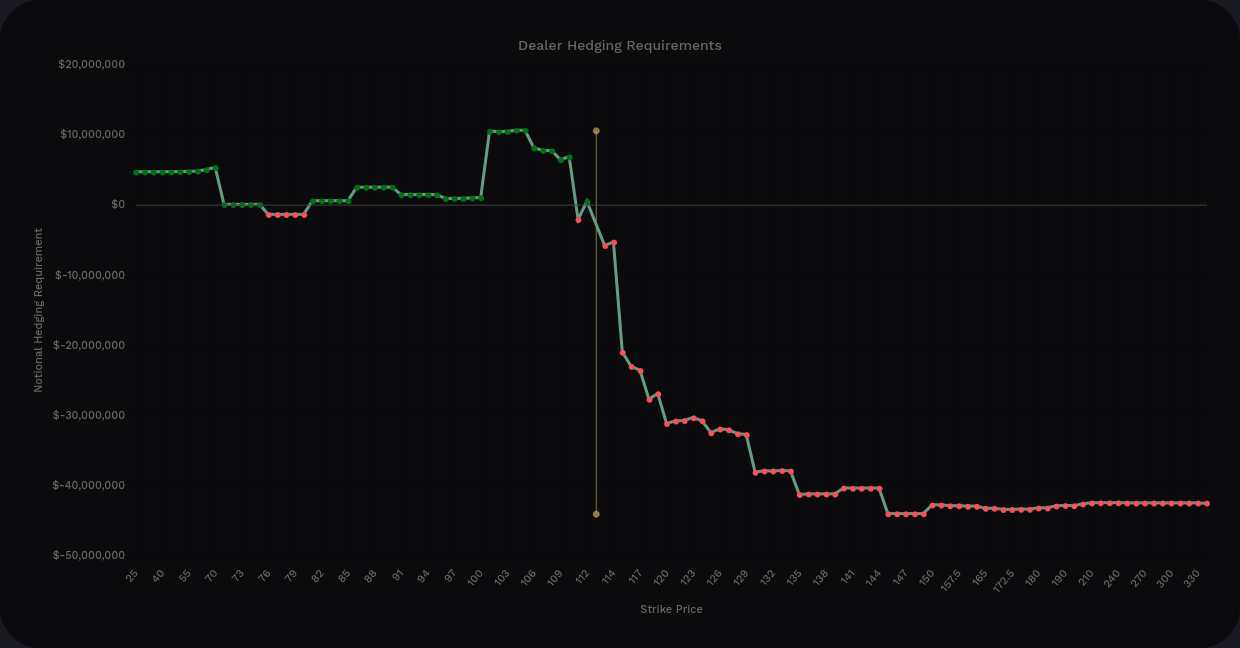
What about gamma? Gamma definitely has selling pressure above the current price on aggregate and it peaks around $113. If we can make it past that level, gamma effects weaken and vanna could take over:
Long puts are mainly lined up from $115 to $119, but $120 has nearly $200M worth of short puts sitting there:

On the call side, there's a bunch of short call activity at $100 but the remainder of the call activity looks long. $90 and $110 have the most long call contracts:

Dealer data
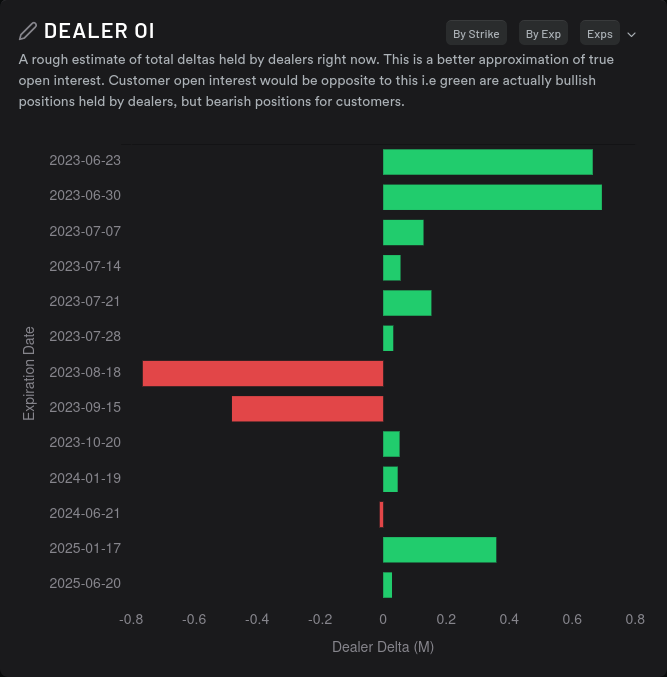
What are dealers doing with AMD right now? They're sitting on more bullish contracts lately, which implies that market participants are getting into bearish contracts (long puts, short calls):

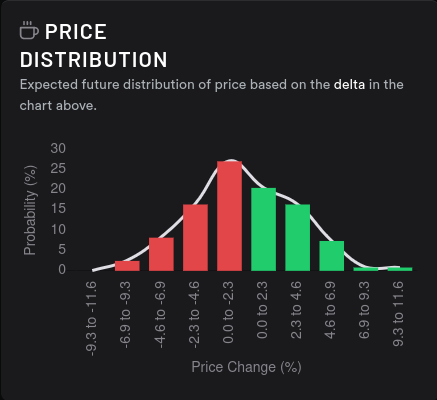
Options are priced for another downward move and customers seem to be betting on a correction to continue at least through 7/28. Note the x-axis on the dealer OI chart, however. It's extremely muted compared to the recent activity we've seen for AMD. This chart recently showed dealer deltas approaching 3-4M and we're seeing it peak here at just under 1M:
Yesterday's net flow looked like a low liquidity mess, but looking at the options flow since Tuesday morning shows that yesterday's trading didn't change the thesis for most traders:

Thesis
The correction is definitely underway (as predicted earlier this week) and I'll be interested to see where we catch some support. Yesterday's price action became stuck around $112, but volume was low and I struggled to find a reason for that price level to become a sticking point.
Here's what we have in play today:
- Positive vanna wants to pull us higher to $130 or more if IV can remain low. IV is currently spiking.
- Gamma is fairly weak relative to vanna, but it wants to pin us in between $110-$115 for some period of time.
- Dealers are long and this has historically proven to block AMD's price from rising.
- Finding the right support level where AMD's correction might stop is unusually challenging right now. $100 is a strong psychological level with a decent amount of positive vanna. However, there are quite a few long puts lined up on that level.
I'm placing my bets on getting stuck in a channel between $110-$115 for this week but next week is unclear.
Good luck to everyone! 🍀
All investments come with significant risks, including the loss of all capital. Please do your own research before investing, and never risk more than you are willing to lose. I hold no certifications or registrations with any financial entity.
Discussion