AMD options analysis at the September 15 OPEX

Will AMD be stuck in this range forever? What are traders betting on for AMD's 10/31 earnings? Let's dig into the data to find out. ☕

We've reached the end of another quarter and that means today is a quadruple witching day. Lots of options contracts get rolled around today and price action can be wild. Today is a great day to be careful with position sizing. 😉
It's been a few days since I looked at the data for AMD. That's my main focus today. Are we going to break out of this $105-$110 range sometime soon? Is something beyond $120 possible? Let's find out.
All investments come with significant risks, including the loss of all capital. Please do your own research before investing, and never risk more than you are willing to lose. I hold no certifications or registrations with any financial entity.
Grab your coffee and let's go. ☕
Options flow
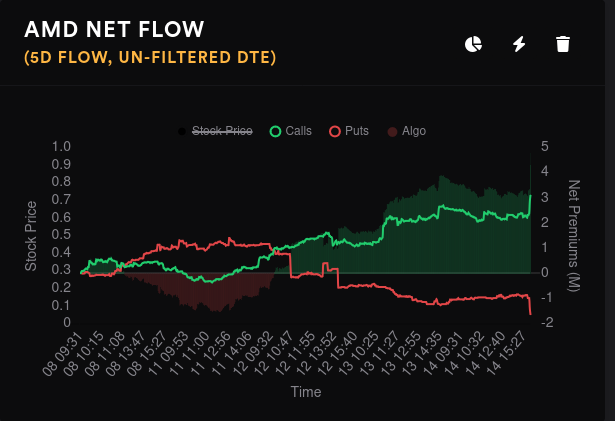
Yesterday looked quite indecisive but there was a big bullish spike just before the close. The five day chart is gradually more and more bullish.
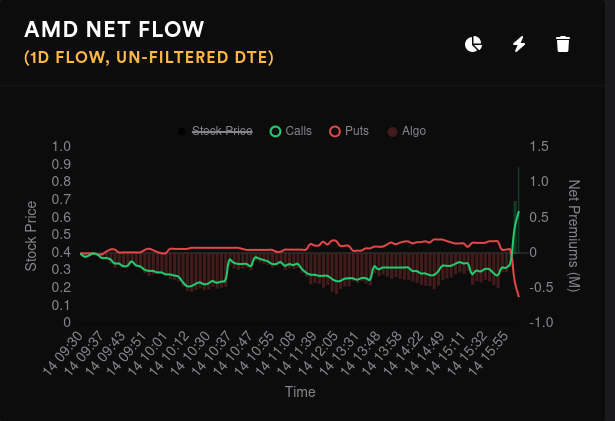
I went digging in the flow data for the end of the day but couldn't find a source of the spike. There weren't any big sweeps that I could find and most of the trading before the bell were bearish bets on 9/15 at strikes over $120. Either I'm missing something or Tradytics had a bug at the end of the day in the chart. 🤷♂️
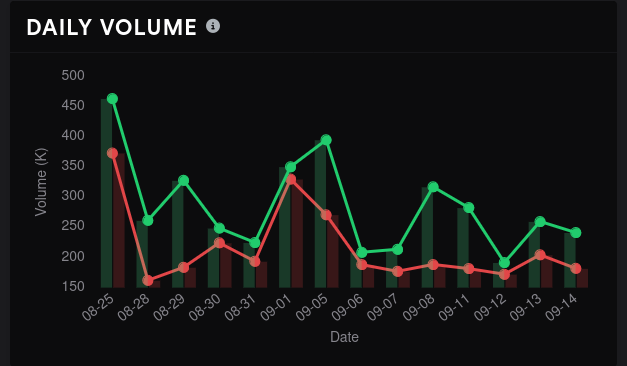
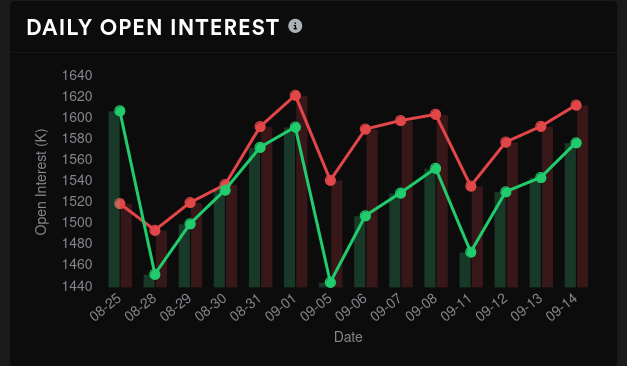
Options volume has been on a downward trend lately but open interest has been increasing a bit.
Vanna
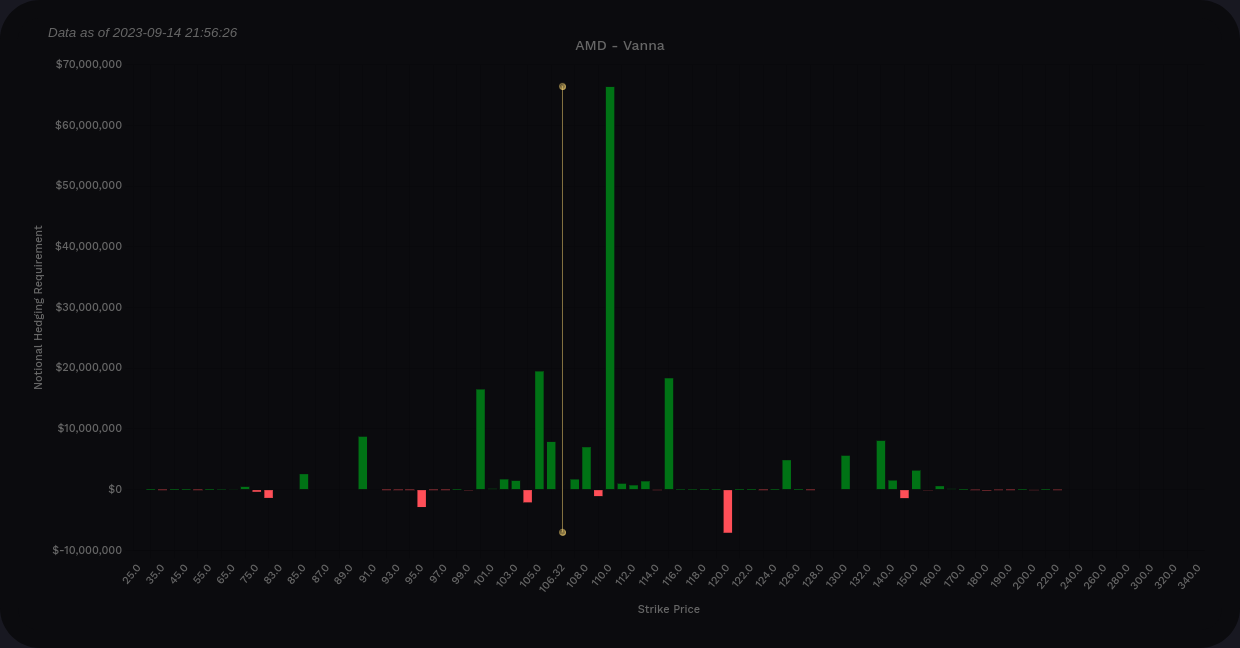
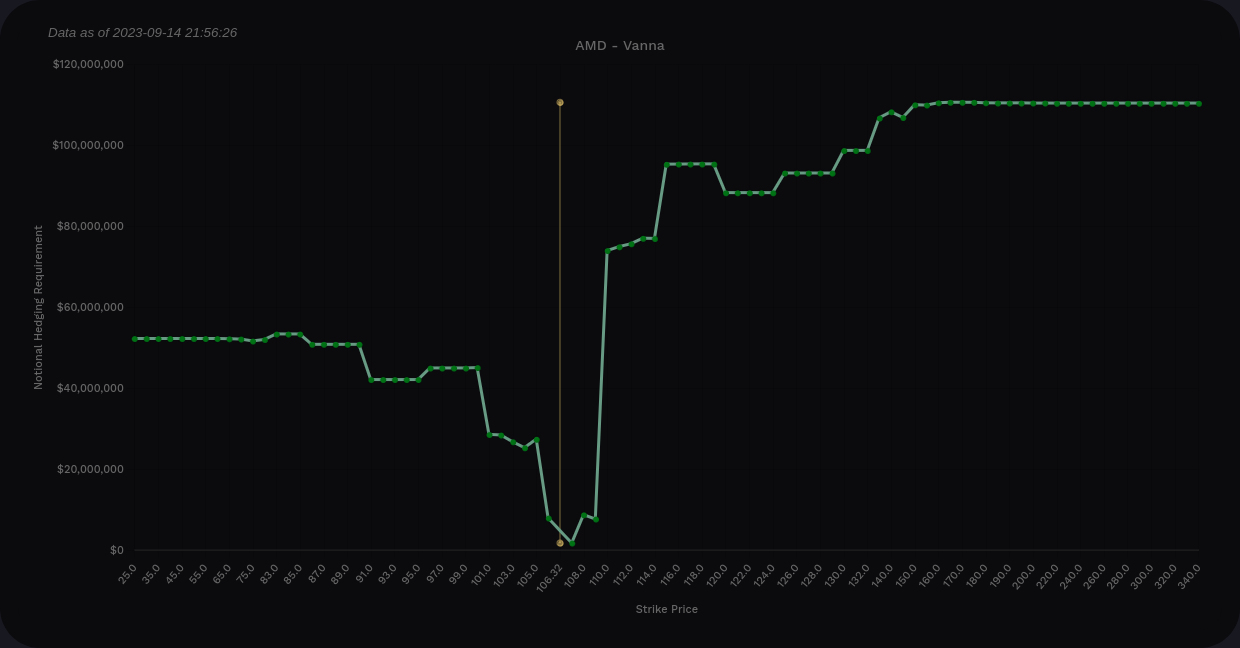
AMD's aggregate vanna remains quite positive across the board with significant vanna levels topping out around $115. If implied volatility (IV) contracts, a pull towards $110 or $115 could happen. Just remember that vanna has the strongest effects around 0.15-0.35 delta and positive vanna is only bullish when IV is contracting.
On the downside, $100 is a decent level and $90 is relatively small. IV expansion could push AMD down to $100. I think $90 is unlikely, but that's the end of the line in terms of vanna.
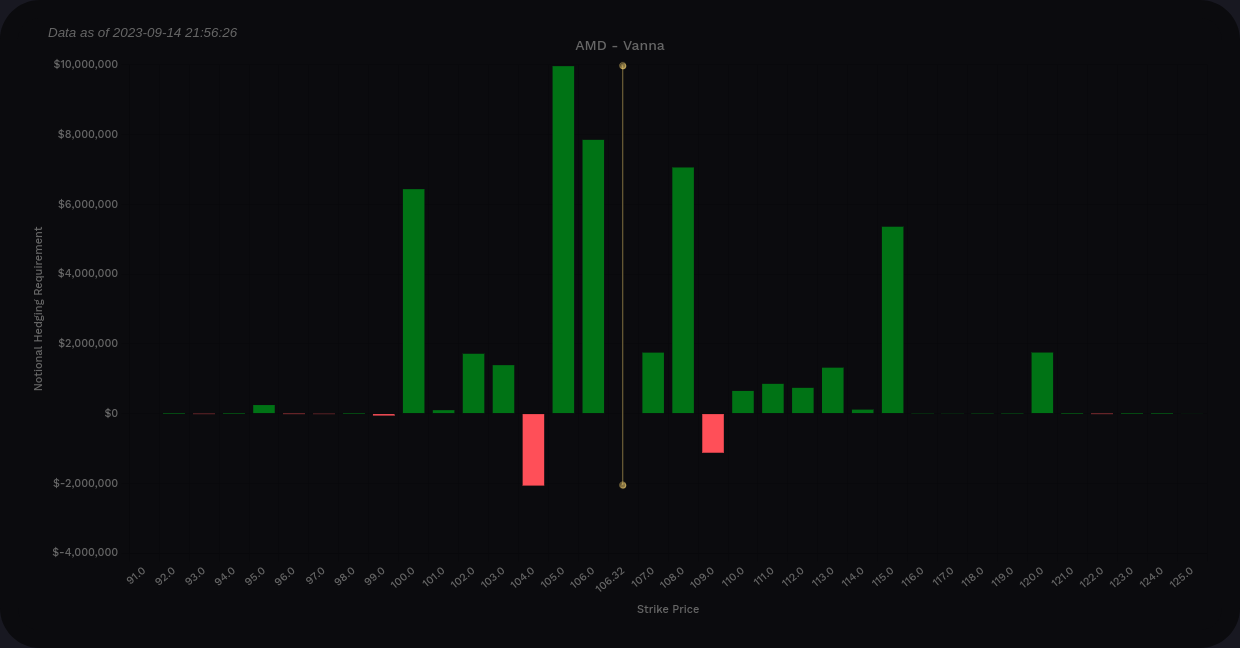
If we narrow the vanna data down to 9/15 through 10/20, $115 still looks like the end of the line with $120 barely poking out. Vanna looks fairly weak here with the biggest level barely breaking $10M.
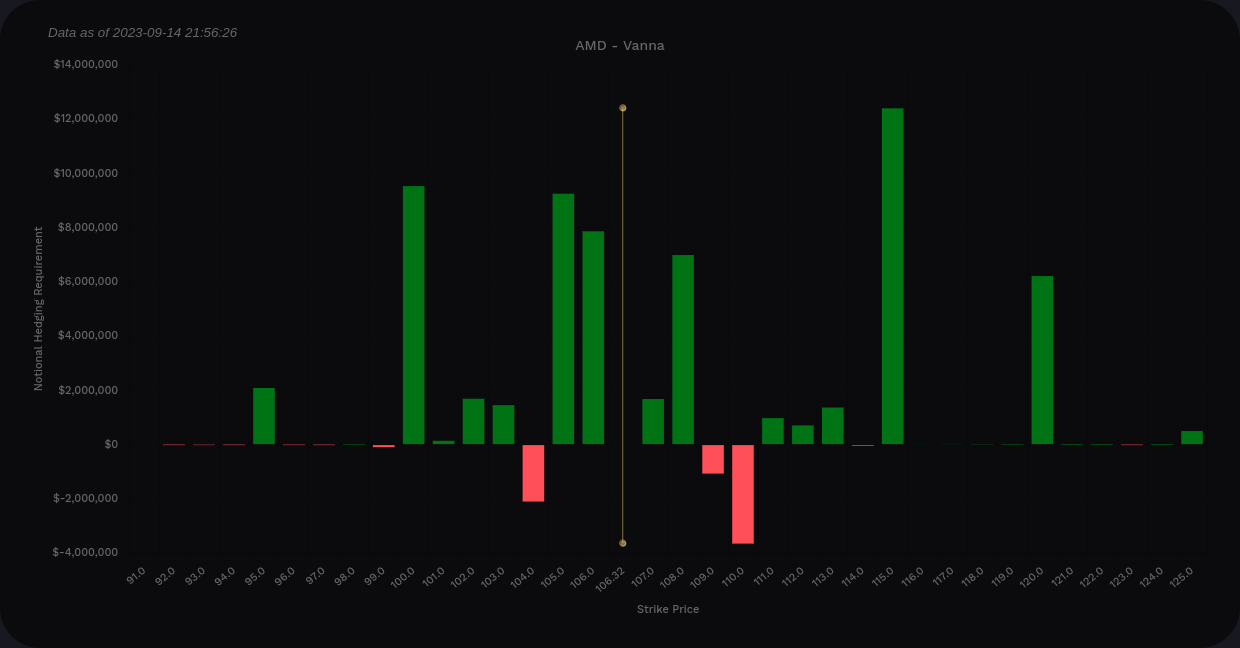
Looking out to 11/17, $115 looks stronger and so does $120. However, the y-axis is showing weak vanna here with all bars under $14M. $100 looks like a pretty safe bet for short puts on the down side.
Gamma exposure
AMD's aggregate GEX suggests $109 as the largest magnet for price. We have resistance up around $120 but not much resistance to price moves to the downside.
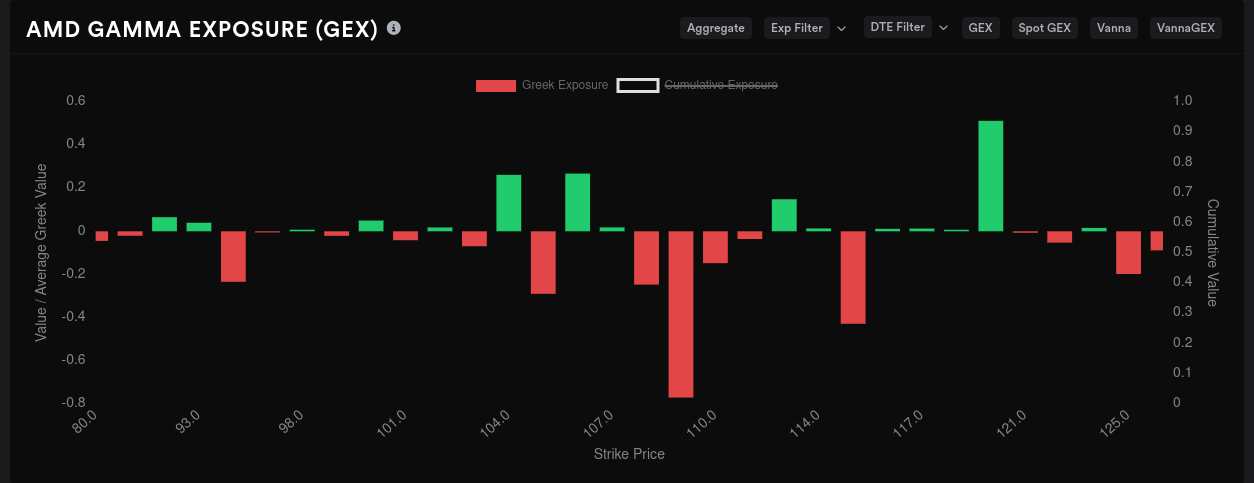
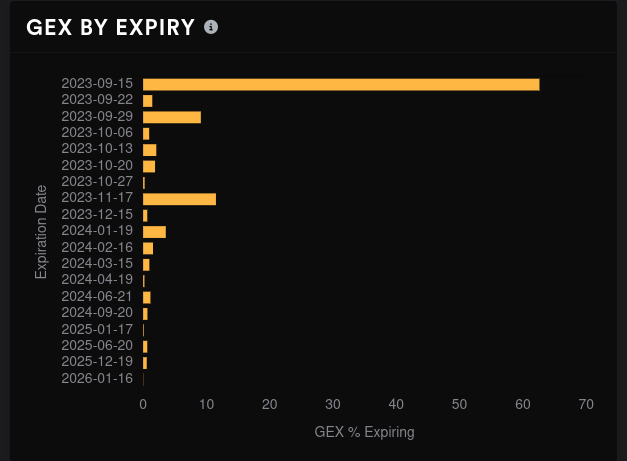
AMD's biggest expiration right now is today, 9/15, but many of these contracts will be rolled today. 9/29 and 11/17 look like the next big expiration dates. Keep in mind that 11/17 is after AMD's earnings call on 10/31. 🎃
I normally don't pay a lot of attention to non-monthly expirations, but 9/29 is quite large. $115 is our magnet for price here and there's a lot of medium-strength resistance scattered from $110 and below. This feels a bit unusual and it's difficult to read. Lots of stocks have some significant GEX on 9/29. We're supposed to get an interest rate decision from the Fed on 9/20.
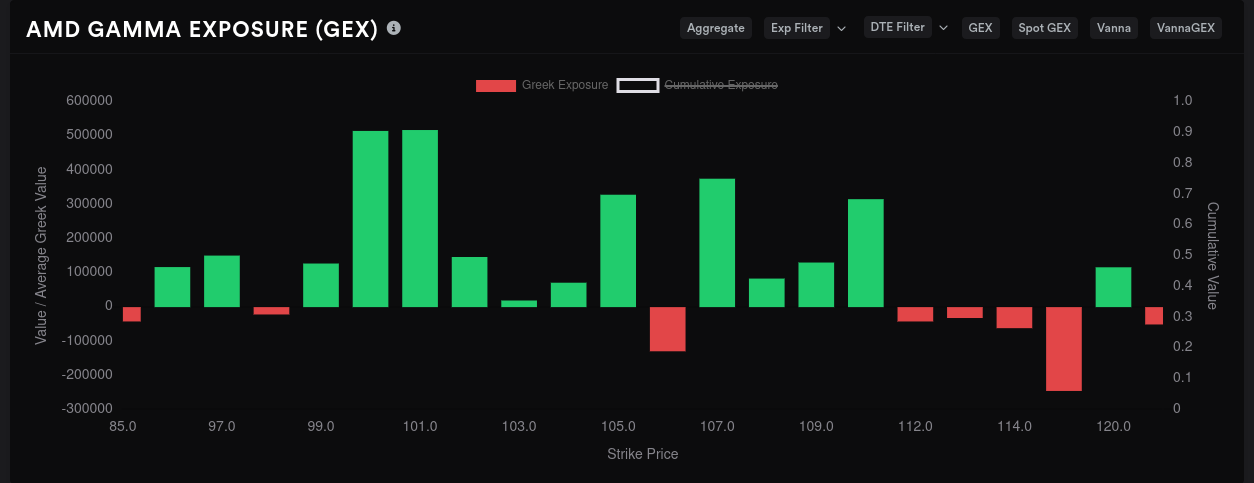
Looking out to 11/17, this is pretty exciting if you're trading AMD with a bullish bias. $125 is a clear target and this is one of the first expirations with some real signs that we might leave this $100-$115 range. Vanna doesn't support this move, but then again, vanna is quite weak for AMD through 2023. This expiration is after AMD's earnings call on 10/31!

Dealer positioning
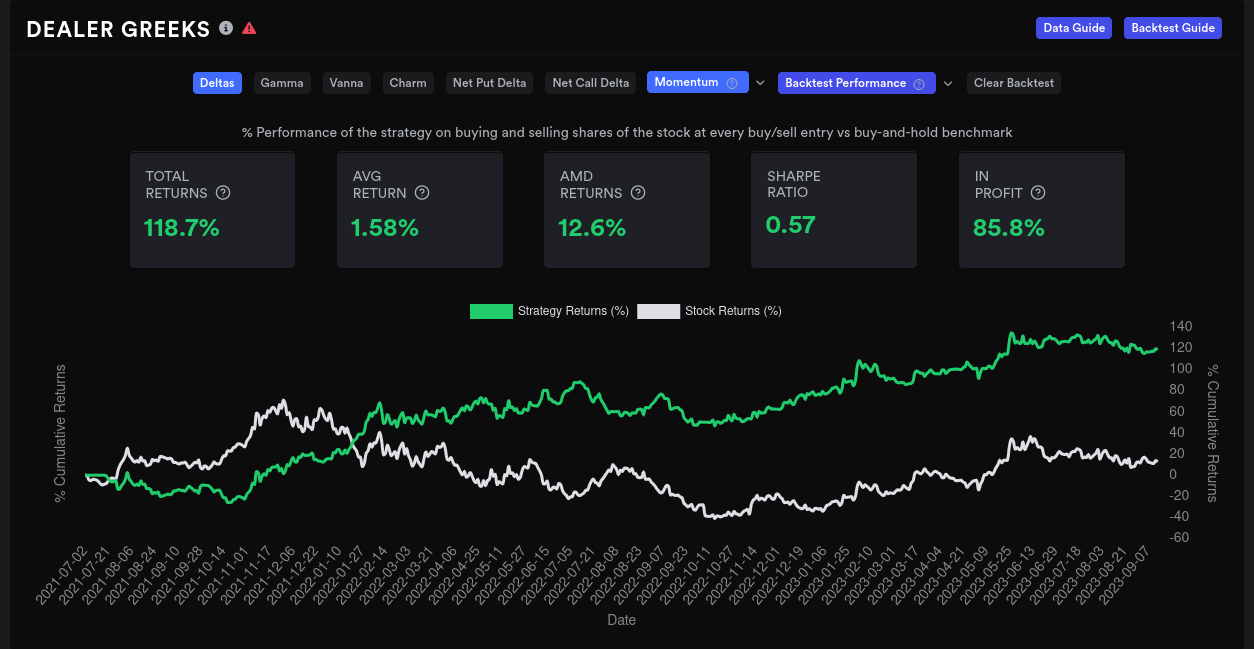
Dealers are currently short AMD on a 15 day momentum. That momentum has shifted more short over the past three days and it suggests that market participants are getting more bullish on AMD.
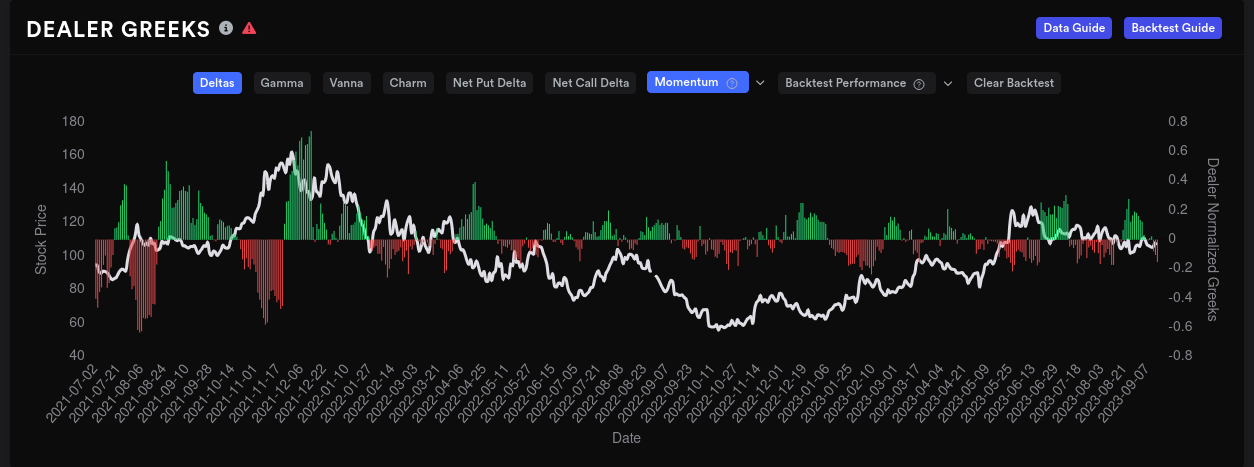
Past performance doesn't dictate the future, but buying when this chart is red and shorting when it's green has led to some decent gains since early 2022.
If we take the same 15 day momentum look at how vanna is building up on dealers, you can see that dealers are short vanna (customers long).
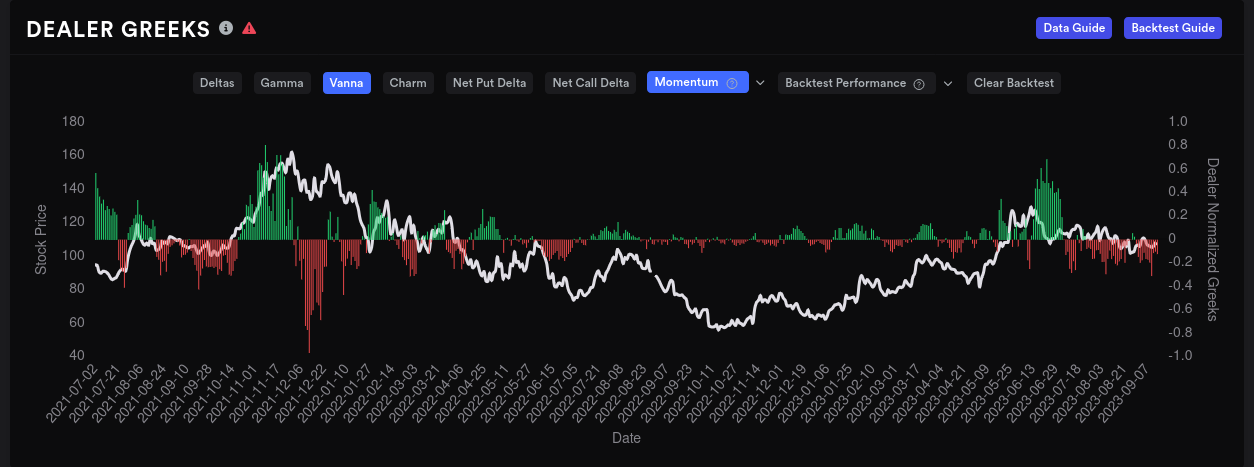
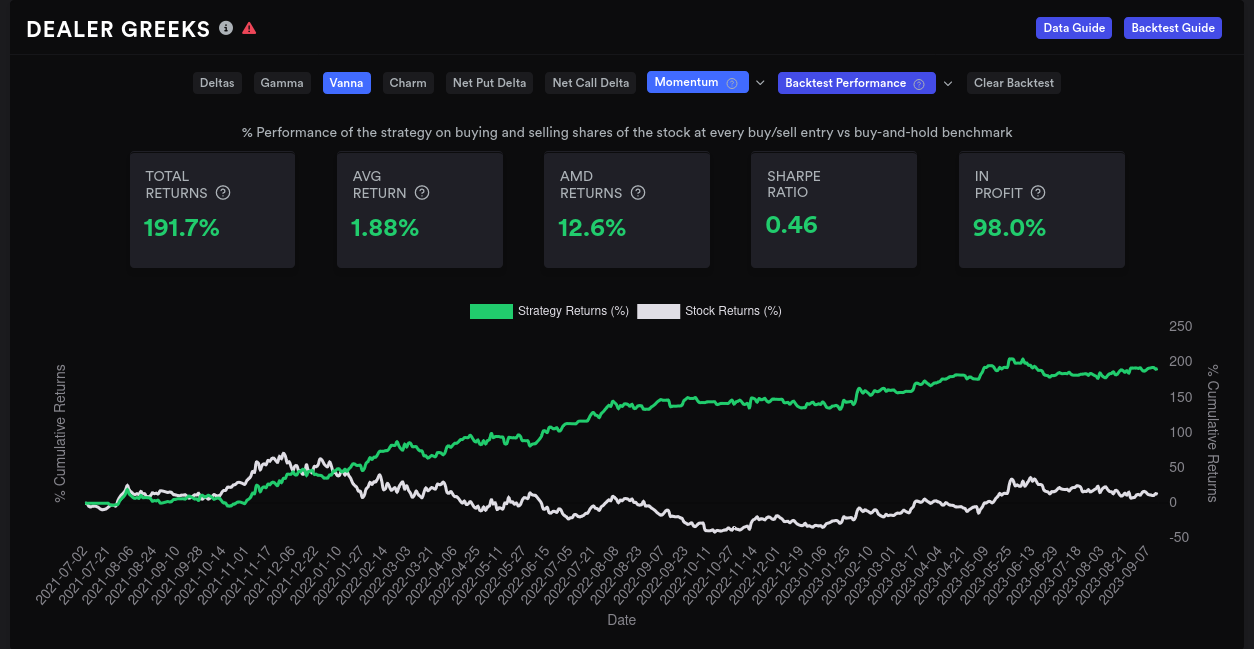
This is backwards from the delta chart above. In the vanna dealer buildup, green bars mean good times to buy and red bars mean good times to sell. If we use that for a backtest, we get decent results, too.
So dealer deltas are suggesting customers are bullish but dealer vanna suggests customers are bearish. That's interesting, but remember that vanna is not strong right now. I'm going to put my faith in the delta data for now.
Other options data
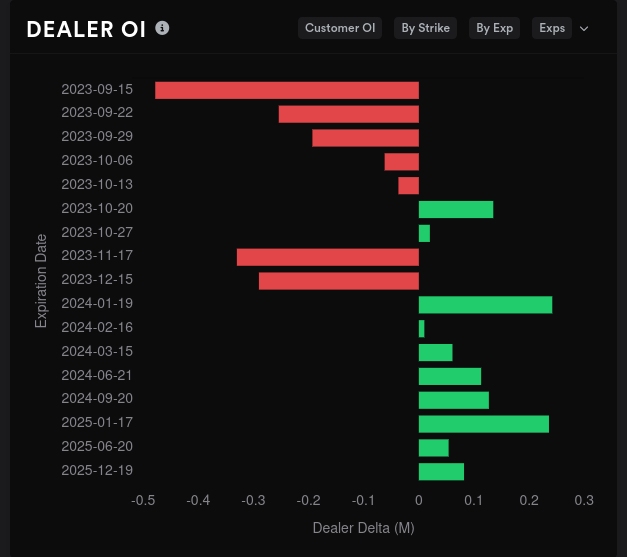
Dealer open interest tells me two main things here:
- We have a bullish tilt through 12/15 with some light bearish bets coming in for 10/20.
- Traders are indecisive. The x-axis on this chart is tiny. I get excited when one of these bars crosses at least 1M in dealer deltas but none of these even break half that. 🤏
What are the whales doing?
- On aggregate, $100 is getting much more bullish and $120 is moving much more bearish. Don't these levels sound familiar? 🤔
- 10/20 shows strong bullish moves for $100 but all other strikes are quiet.
- 11/17 is fairly flat but $110 is the most bullish strike. $125 is slightly bearish.
Dark pools
Vanna and GEX are my bread and butter, but I like using dark pool data to double check myself to ensure I'm not missing something.
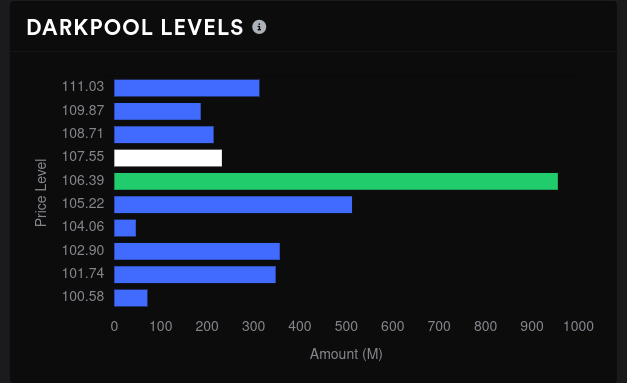
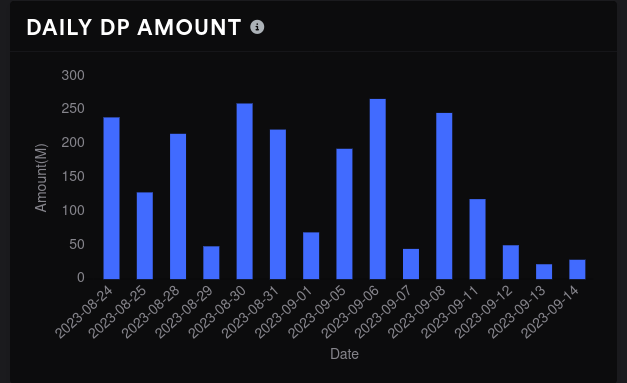
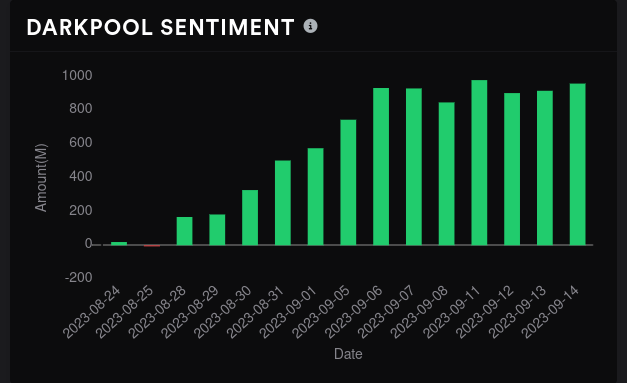
Sentiment is bullish overall but the momentum there has died out. Dark pool volume sits at extremely low levels this week. The biggest volume level was around $105 earlier in the week but $106 seems to be the biggest now. We have a volume shelf around $101-$103 that should give us support.
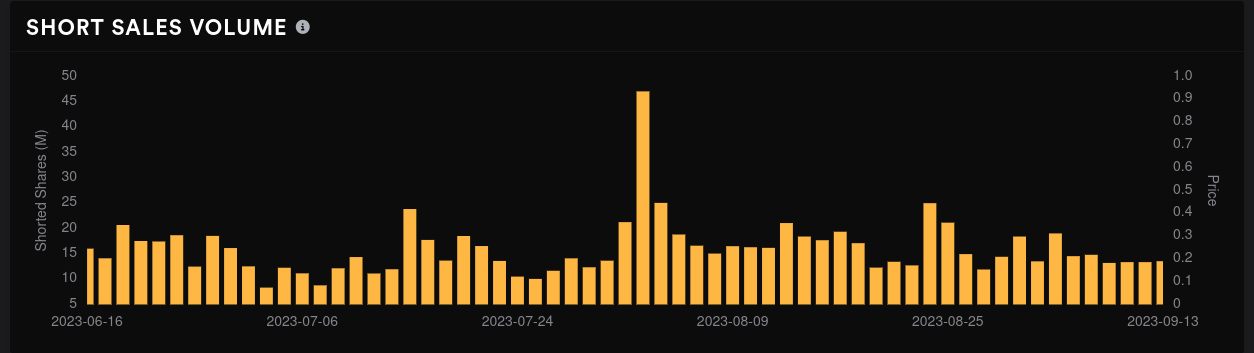
Short sales volume remains low and flat:
Thesis
AMD has been one of the quieter names in the excitement around AI and that may be why we're stuck in this range. Traders seem to be waiting on the Fed's decision and AMD's earnings before allowing AMD out of this $100-$115 range.
I'd suggest caution in trading the 11/17 strike for now because the outlook is still fuzzy and earnings calls are usually unpredictable. I'm focusing on trades expiring on or before 10/20. You can make a decent profit from trading AMD's ranges lately.
If you want to be aggressive in your trades, keep an eye on the $105-$110 range and make bets on either end. Conservative traders might want to trade $100-$120 and that's been where I've set up my strangles lately. I have several $95/$125 short strangles and a single $100/$120 short strangle (covered on the call side, of course).
Seasonality suggests that November is one of AMD's best months of the year and October is one of the worst.
Good luck to everyone today and have a great weekend! 🍀
Discussion