AMD stock and options analysis for October 10

AMD's earnings are rapidly approaching on 10/31. Will we see a run-up before then? Let's get into the data. 🎃

Happy Tuesday! We're 21 days away from AMD's earnings on 10/31. 🎃
I'll take a look at AMD's data today to see where we might be going before and after earnings. There's a lot in flux right now, especially around interest rates.
We also have a terrible conflict underway in the middle east and my heart goes out to everyone who is caught up in it. I sincerely hope there's a pathway to peace that can be found very soon. ♥️
All investments come with significant risks, including the loss of all capital. Please do your own research before investing, and never risk more than you are willing to lose. I hold no certifications or registrations with any financial entity.
Let's get into the data.
Options flow
Overall flow gives us an idea of momentum of options traders over the short and medium term. AMD's flow yesterday was fairly boring with some sold calls and bought puts, especially in the afternoon. AMD briefly went bullish on the five day flow but turned bearish once more.
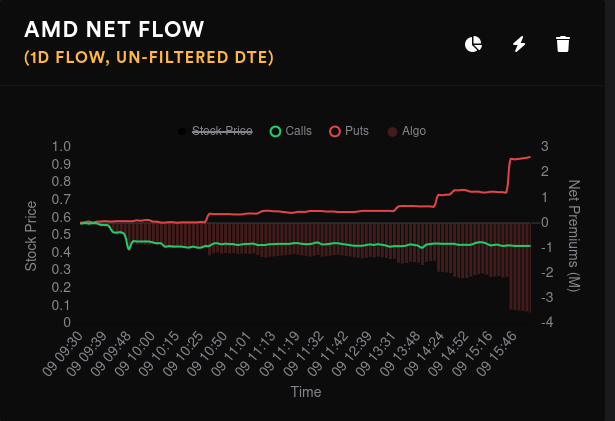
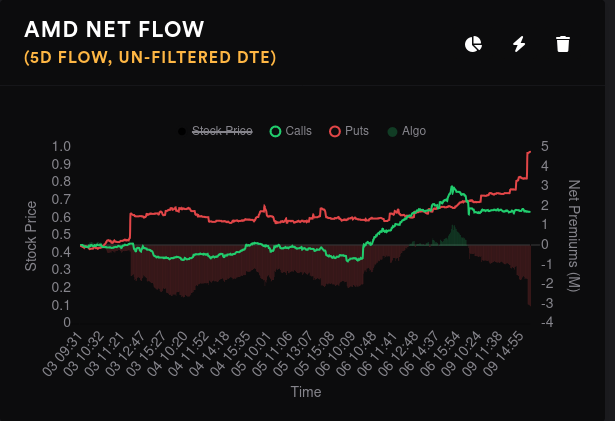
AMD is back into a familiar volume pattern with quiet Mondays that gradually ramp up to a high volume Friday.
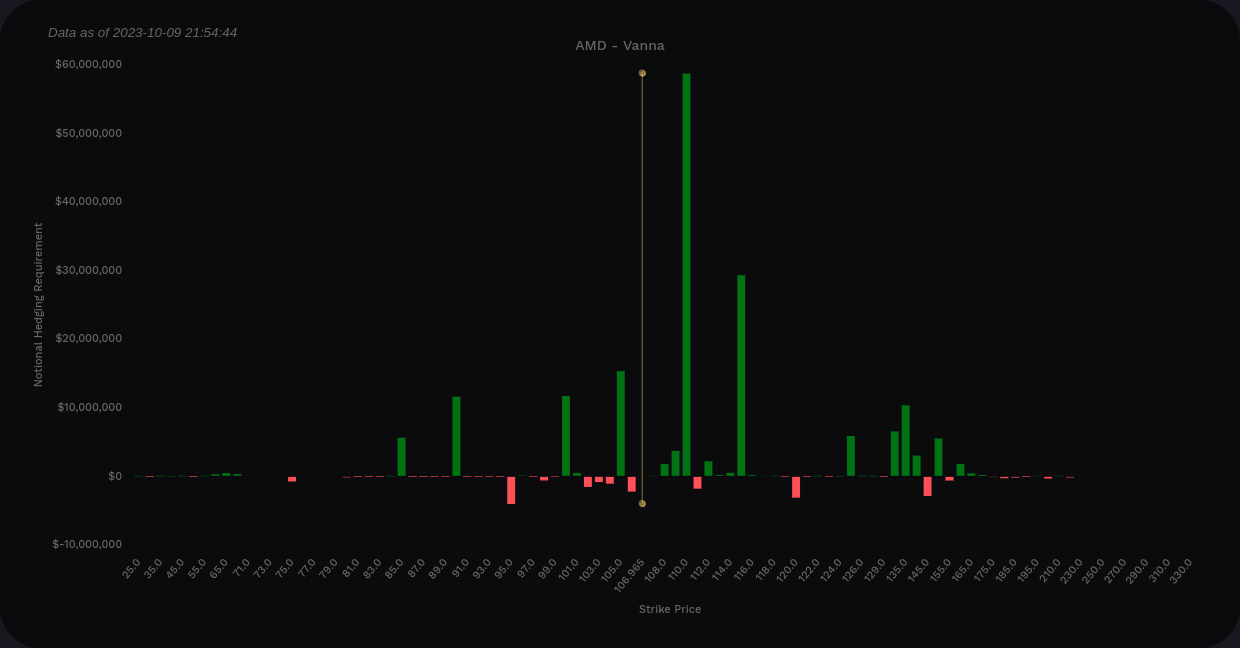
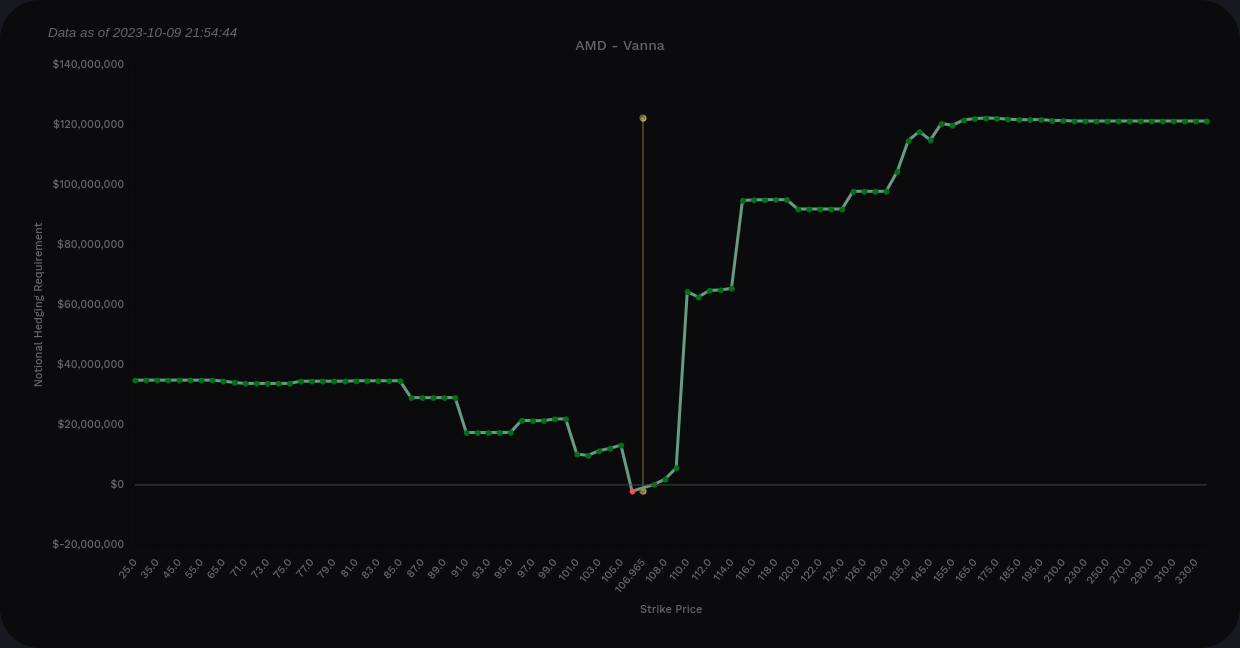
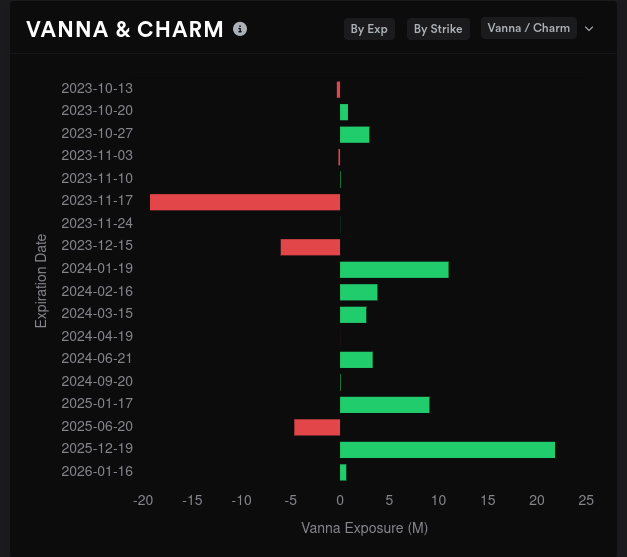
Vanna
AMD's vanna charts are almost entirely positive, which suggests that a volatility crunch should apply bullish pressure to AMD's price. $110 is the strongest by far, but $115 looks like the end of the line for bullish pressure. On the downside, we have some support at $105, $100, and $90.
An increase in IV (VIX going up, or news specific to AMD) would likely push AMD's price down.
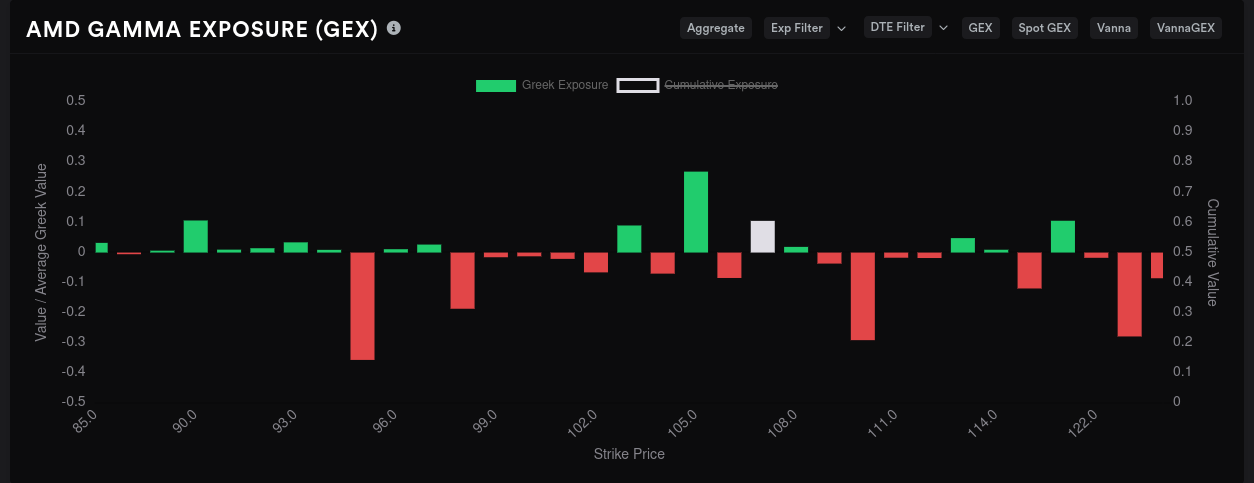
Gamma exposure
AMD's GEX is fairly scattered and messy right now, but that's common as we approach earhings calls. The largest price magnet sits at $95 with $110 and $125 coming in second place. Resistance is strongest around $105.
Almost all of AMD's GEX is piled up into 11/17, the first monthly OPEX after earnings. $125 is the big target here. There's also a wide spread of price magnets from $95-$115. Resistance appears at $90 to the downside and $120 to the upside.
AMD has a lot of freedom to move from $95-$115 before 11/17.

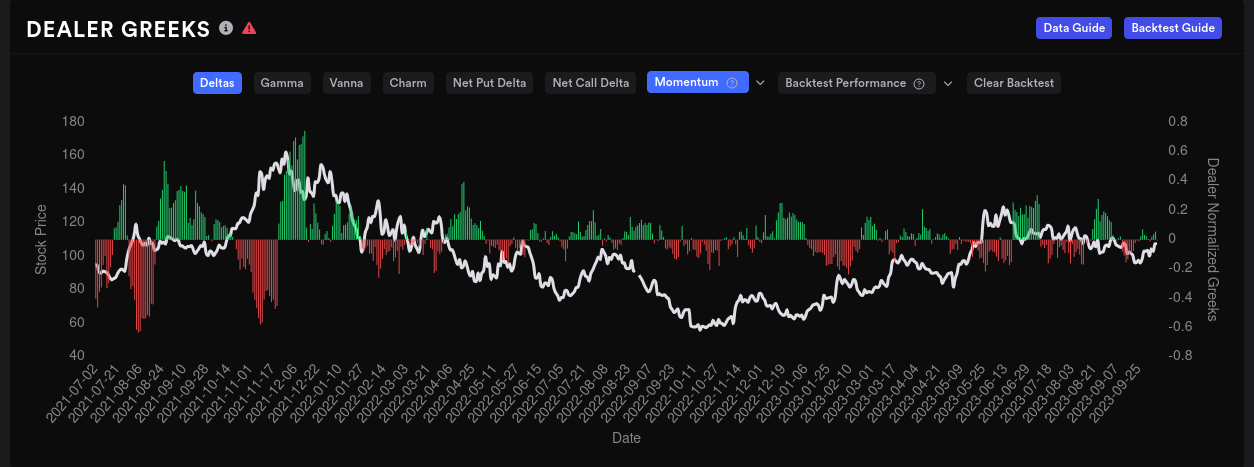
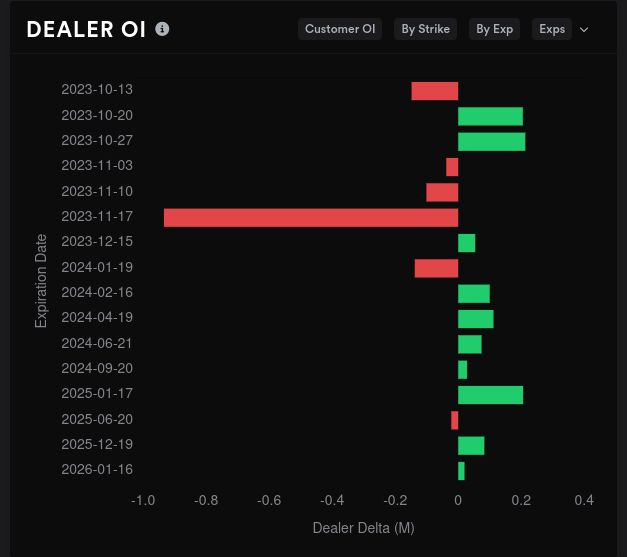
Dealer positioning
AMD's dealer delta buildup shows dealers sitting on more long contracts over a 15 day momentum. This suggests that customer momentum is moving into short contracts (short calls, long puts). Backtests show that when this 15 day momentum chart is green, AMD's price typically moves down.
AMD's 11/17 expiration looks to be a bullish one and definitely outside the norm. We go back and forth between bullish (red bars) and bearish (green bars) here until then. Notice that most of the positive vanna (bullish if IV contracts) is spread out on expirations after 11/17.
This suggests to me that an IV crunch after earnings might not push price higher by much. I'd look to the content of the earnings instead for a move up (or down).
Whales
Traders that throw serious money into options contracts sometimes give hints about where smart money is headed. On the aggregate, most whales seemed to tilt bearish yesterday. $100 is the most bullish and it's holding steady.

I usually look for outliers here that show me where someone has made a big bet. The 10/27 expiration is the last one before earnings on 10/31 and there's a significant bearish move on $98 that has held since 10/3.
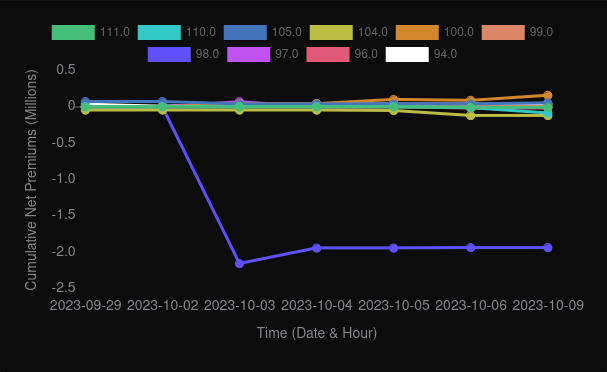
11/17 shows a big dip for $145, which seems a bit odd since it's quite far from the current price. $120 is starting to dip there, too. This will be something worth watching for changes.

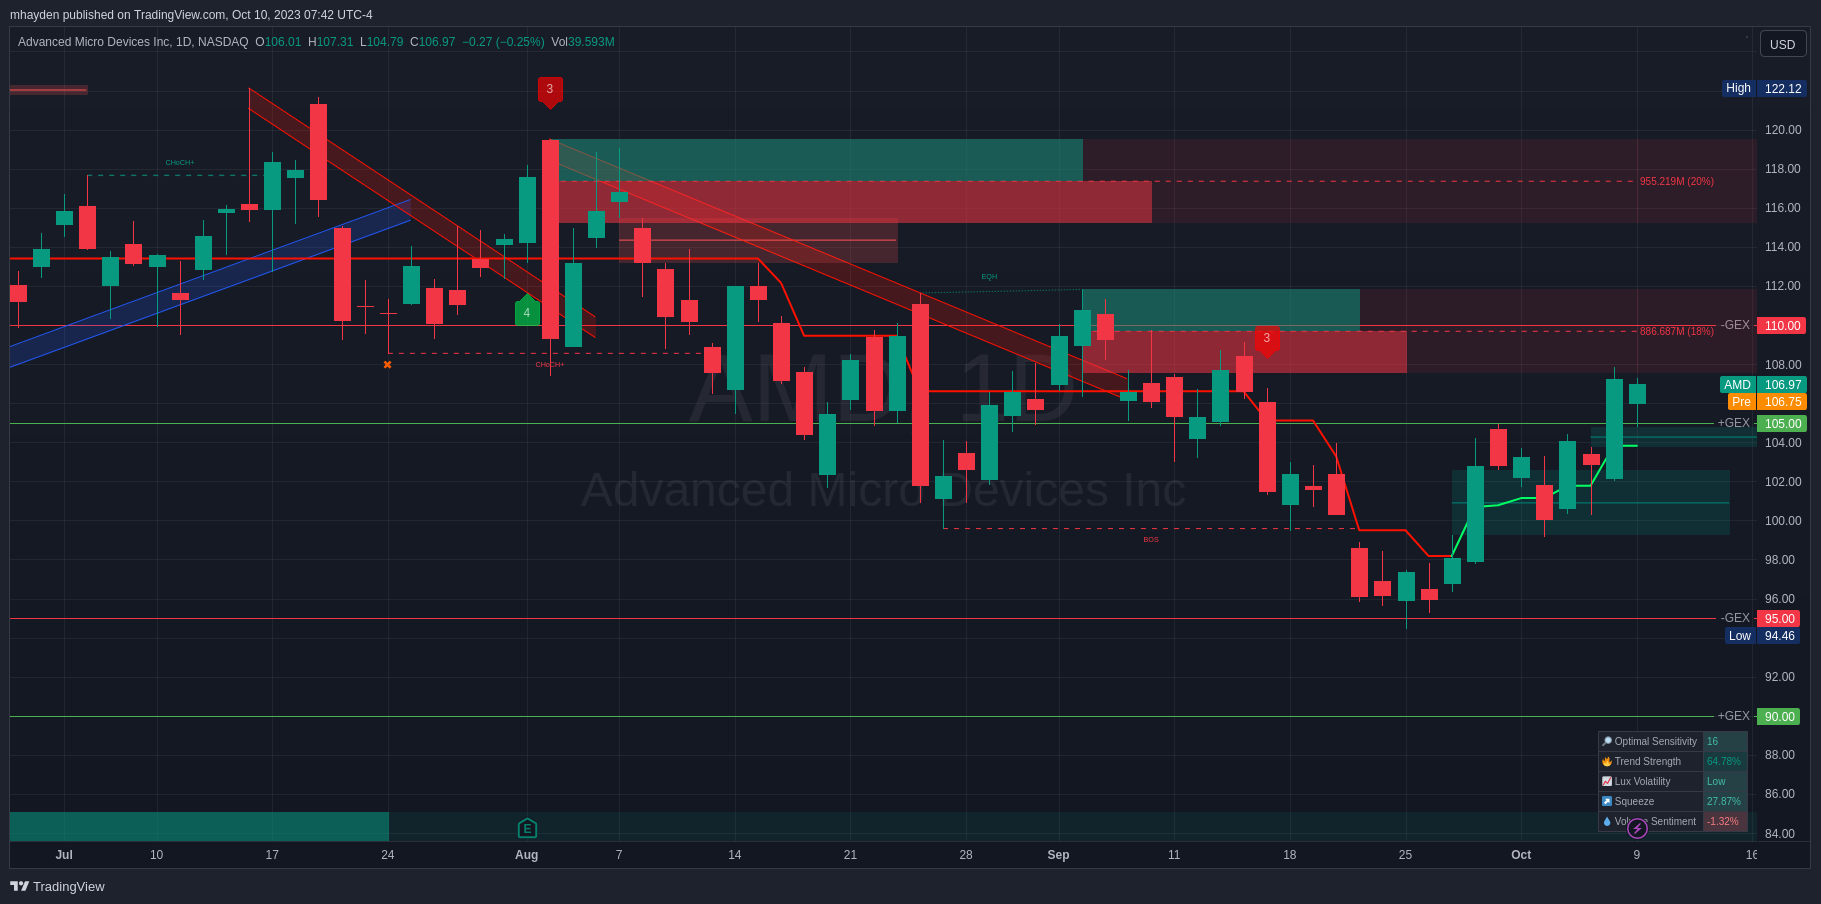
Chart
On the daily chart, we have a lot going on. There's a big order block around $110 that seems fairly balanced between bears and bulls. This could be an area where price could get stuck and reject down, or it could fuel a move higher. This is a good area to watch.
On the downside, we have some fair value gaps which might provide support if price dips down to those levels. Price will have a difficult time breaking below $105, $104, and $101. Bear in mind that the $95 GEX level is a strong one and it could be a good magnet for price.
Thesis
AMD is in one of those situations again where it shows promise for breaking out of a channel. It loves to have run-ups before earnings and that may be what we're seeing now. However, GEX and vanna data show that the door is open for an upward move between now and 11/17, but that $115-$120 zone has caused problems multiple times in the past.
Conservative traders might want to play the $95-$115 range now through earnings. AMD saw significant support when it wandered down to $95. The bears fought to push price under $95 but bulls eventually won after 4-5 days.
If you want to be a bit more aggressive, $100-$110 seems like our range for the moment. There's plenty of implied volatility for short options plays on both ends of this range.
I have more AMD shares than I should right now and I covered the remaining lots yesterday with short calls. My covered calls are in the $104-$108 range with an expiration of 10/20 or sooner. I'll look to sell some puts if we roll back under $105.
Good luck out there today. 🍀
It's a great day to call someone and tell them how much you love them. Even if it's someone you disagree with on just about everything – just let them know you're glad they're around. ♥️
Discussion