AMD & TSLA updates for June 27

I love trading AMD and TSLA, but it's always important to keep a close watch on the VIX. Let's look at how volatility might affect AMD and TSLA.

Today's update will focus on the VIX and how that affects AMD and TSLA and their very positive vanna setups. But first:
All investments come with significant risks, including the loss of all capital. Please do your own research before investing, and never risk more than you are willing to lose. I hold no certifications or registrations with any financial entity.
Here we go!
The VIX
CBOE has a Volatility Index called VIX that tries to generate predictions around volatility of the stocks in the S&P 500. A high VIX number means options prices are higher (more demand across the board for options contracts) and volatility is likely increasing. Higher volatility leads to bigger price moves, of course, but it affects how dealers hedge their holdings.
That's an extremely brief summary that doesn't explain volatility well enough, but CBOE offers enough reading material on the topic to keep you busy for the next few years. 😉
When volatility increases, options prices at the same delta increase. For example, if you're holding a long 0.30 delta call and volatility increases, your deltas will increase even if the stock price sits still. Your call might turn into a 0.40 delta call suddenly.
For a trader, seeing your long call increase in deltas is exciting! You're making money!
For a dealer who wants to remain neutral in the market, this requires additional hedging. Going from 0.30 to 0.40 delta on a contract for them suddenly means they have a bullish bias on the stock. They will sell off shares to bring themselves back to a neutral position when this happens.
This is why positive vanna setups in an increasing IV environment can be painful for bullish traders.
What's the VIX doing now?
VIX has been on a downward slope so far in 2023:

We've had some significant increases in VIX around economic data releases and interest rate decisions, but as interest rate increases calmed, so did the VIX.
Just like anything else, you can trade the VIX and we can examine the options flow for it:
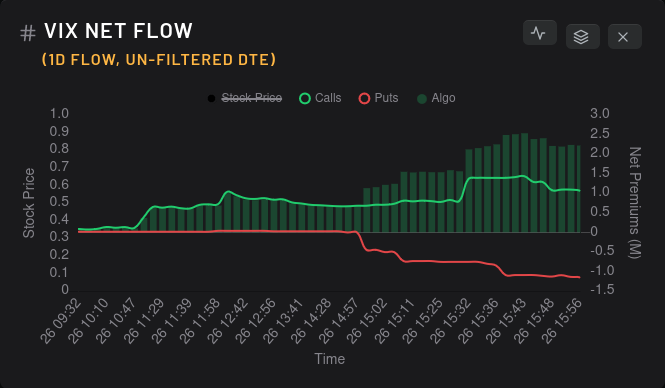
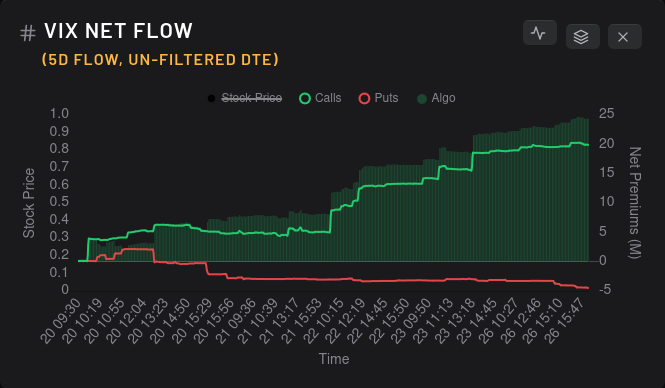
These charts show us that options traders are making heavy bets on a VIX increase in the near term. With the VIX at record lows, this might be a good trade. I call these heavy bets on VIX because the net premiums (right y-axis) is quite strong.
What does this mean for AMD and TSLA?
We have a slightly increasing VIX and bullish VIX bets are piling up. Check out the aggregate vanna curves for AMD and TSLA:
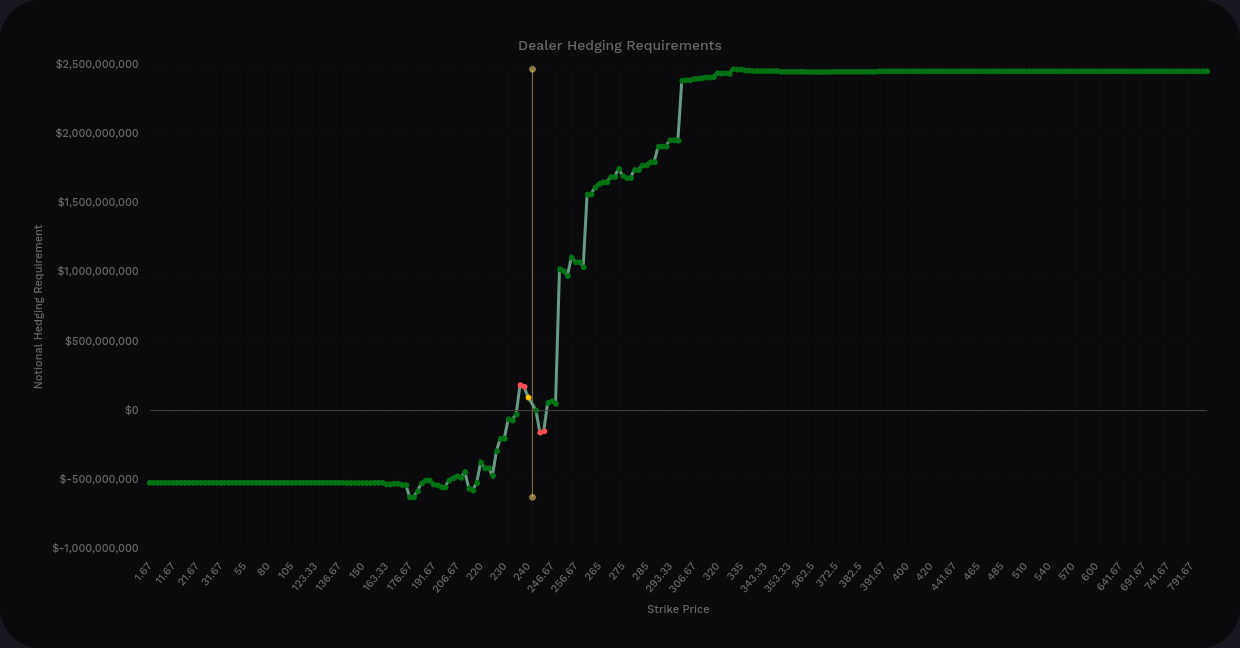
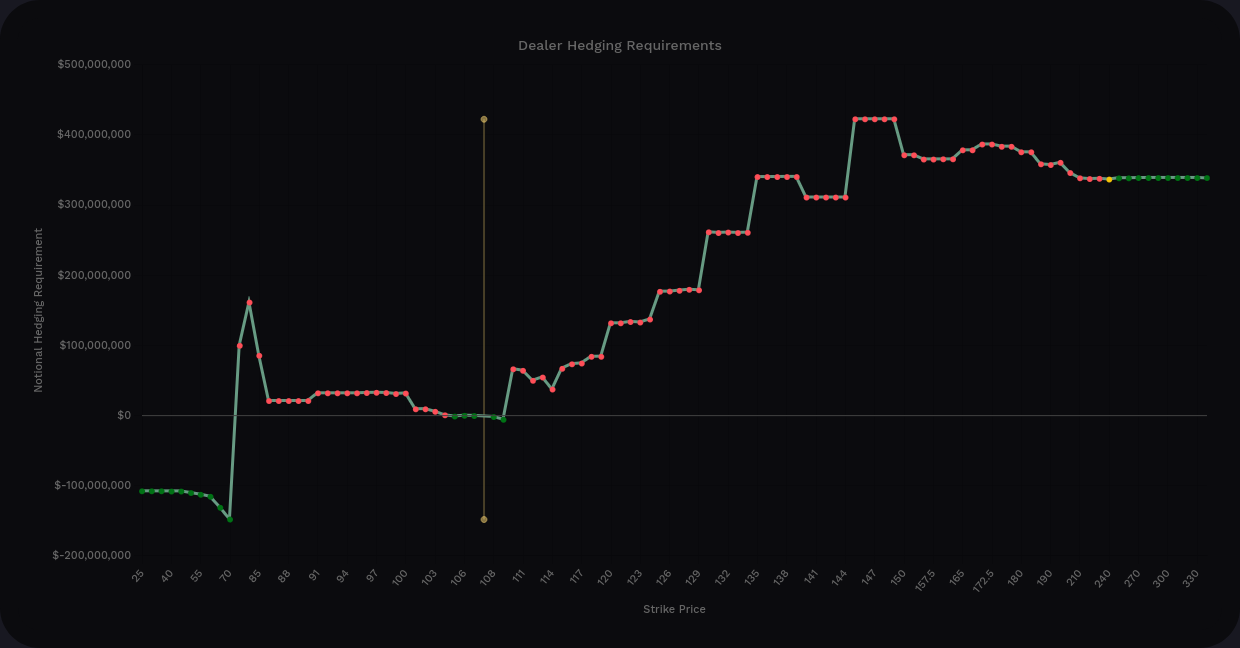
TSLA has a 5x positive to negative vanna tilt and AMD is around 4x. In an environment with increasing IV, these vanna charts are not what bullish traders want to see. Dealer deltas are increasing and they must sell more shares. This applies selling pressure across the board.
AMD
Let's have a look at AMDs one and five day options flows:
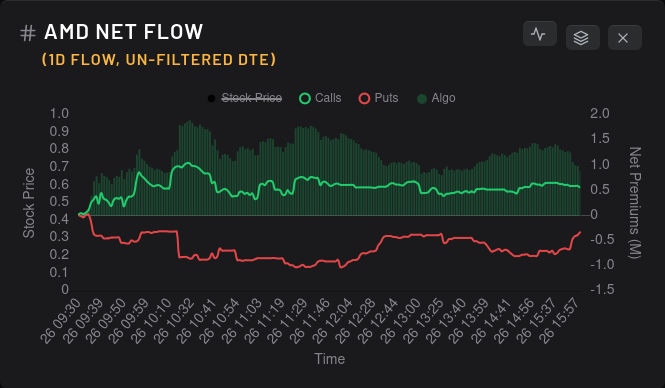
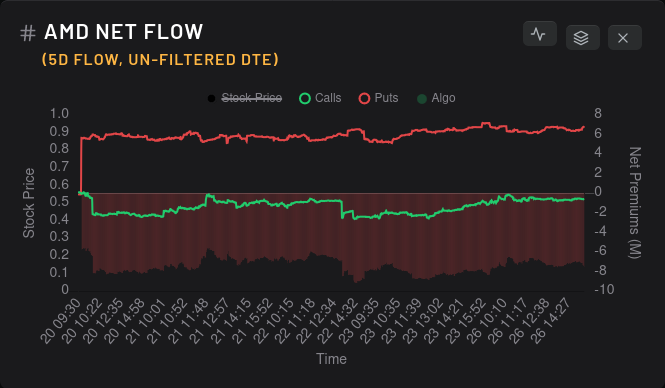
AMD had a slight reprieve on bullish activity yesterday but the five day flow shows a completely undeterred bearish bet still in place. Aggressive options trades from last week were so large that they dwarfed anything happening since then.
AMD IV rank has shot above the halfway mark:

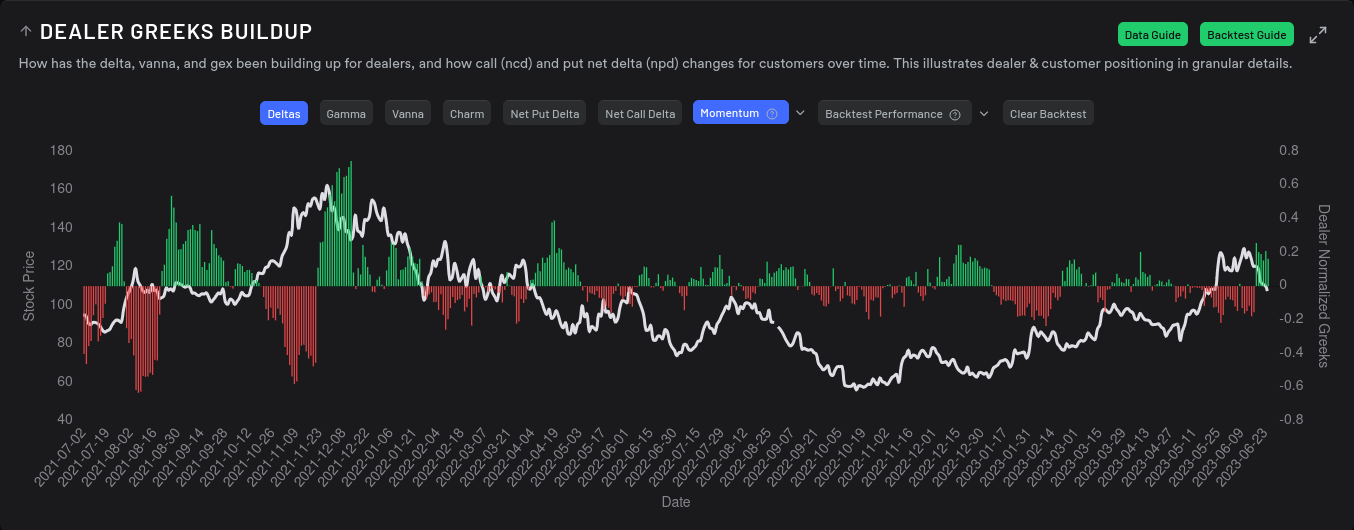
Dealers are still long AMD on a 15 day momentum, which is a bearish indicator:
Options are priced for a slight downward move:

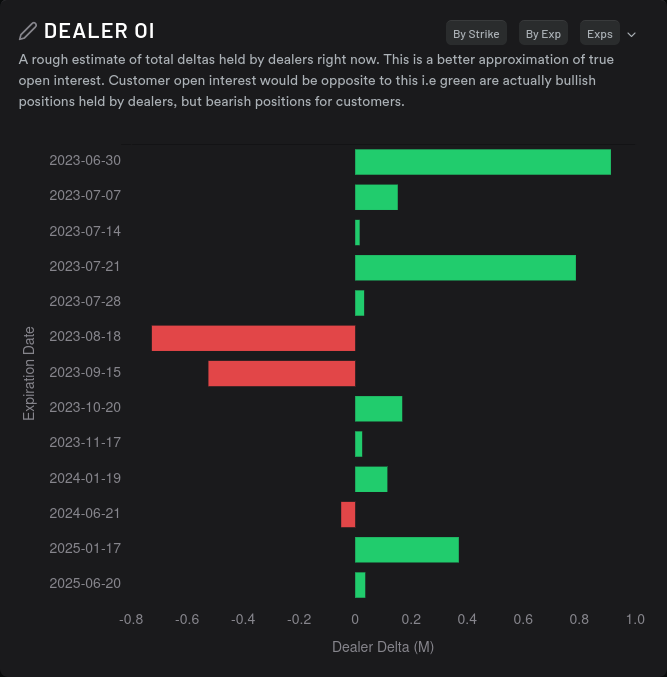
Dealer OI shows us as slightly bearish until 8/18, but notice the x-axis. The bets on AMD are not nearly as heavy as they were for the June OPEX:
TSLA
Here are the options flows for TSLA on two timeframes:
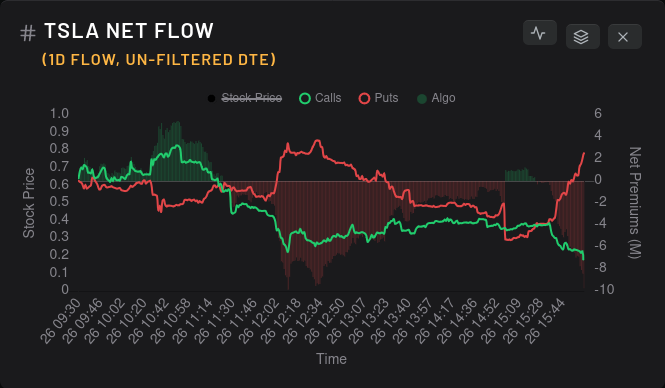
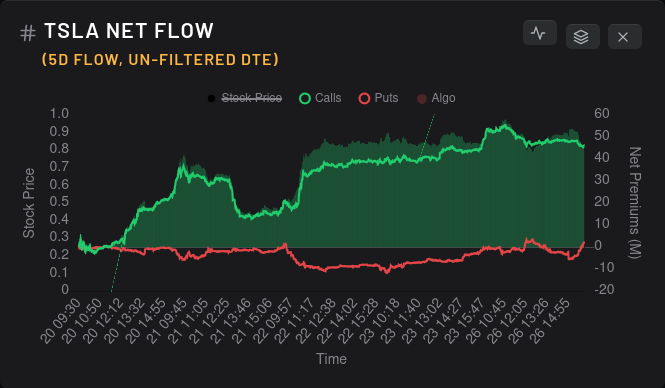
TSLA's bullish flow ramped up last week and this week has been indecisive so far. TSLA's IV rank is just under 38%.
The most notable change I saw for TSLA is that dealer greeks (15 day momentum) has the tiniest fleck of green on the chart:

This means that the momentum of shares traded by dealers has approached equilibrium. I'll be interested to see if this turns more green (dealers long, customers short) or back to red (dealers short, customers long) after today.
TSLA options are still priced for a slight upward move:

Dealer OI looks bullish for this week, but we don't see the same level of bullish bets until September 15th!

Thesis
Increasing IV isn't good for AMD or TSLA right now with their vanna setups, but TSLA seems like it might be on better short term footing than AMD. My plan is to make some conservative bearish bets on AMD through 8/18 to lower my cost basis. For TSLA, I might sit and watch for a bit to see how dealer greeks stack up.
As for my current trades, I'm long plenty of AMD shares with a cost basis in the $90's and a short $110 put for 7/21. I made that $110 bet thinking that AMD might find a floor between $105-$110 by 7/21, but that's a risky play.
On TSLA, I have long TSLA shares and I shorted a $262.50 put for 6/30. With TSLA sitting around $245 this morning, I'm not super pleased with that put, but we will see how it shakes out.
Good luck out there! 🍀
All investments come with significant risks, including the loss of all capital. Please do your own research before investing, and never risk more than you are willing to lose. I hold no certifications or registrations with any financial entity.
Discussion