AMD stock and options analysis for 6/30 weekly expiration
AMD's correction still looms ahead, but where will we catch some support? Let's analyze the chart and options data to build a thesis. 🤔

Happy Monday! 🌄
Let's dig into the numbers for AMD to see where we're headed. But first:
All investments come with significant risks, including the loss of all capital. Please do your own research before investing, and never risk more than you are willing to lose. I hold no certifications or registrations with any financial entity.
As always, if you like what I publish here, click Subscribe at the top right and get these updates in your inbox for free. 💌
Technical analysis
As Fred McAllen says, there are only two things in the stock market that won't lie to you:
- volume
- price
Let's look at both!

- We're coming down from the $130's on a correction and approaching some interesting levels. The 50MA sits just under $105 and the 200MA sits way down on the chart at $82.
- Volume has been declining slightly during the recent correction with the least volume last Tuesday (just after the Juneteenth holiday). Volume isn't increasing as we come down and that would be a good sign for traders with a bullish bias.
- RSI is middling around 44.5% and IV is down to 46.4%.
- The big 5/5 rally kicked off with RSI around 35-45% and IV around 43%. I doubt we will see another rally of that size, but we're approaching that same technical setup once more.
Options last week
Last week saw some incredibly bearish flow right out the gate on Monday morning followed by some low volume after that:
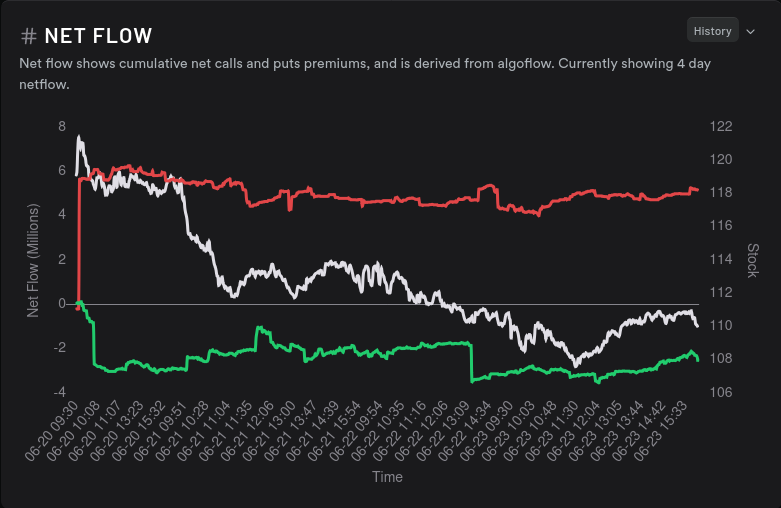
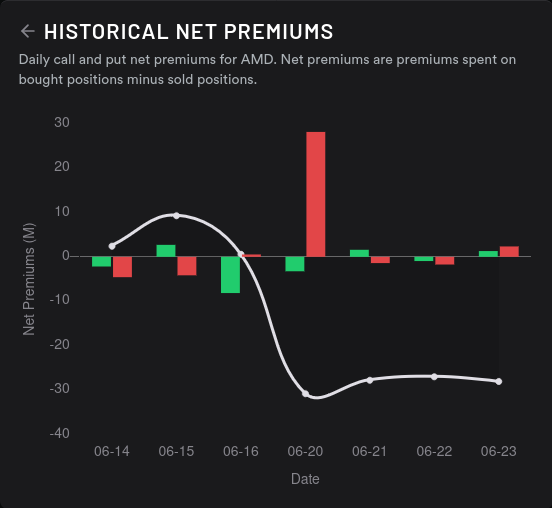
There wasn't much change with options positioning last week after the big blast of bearish flow on Tuesday. (TSLA had a similar pattern, but opposite.)
Options data this week
Starting with vanna:
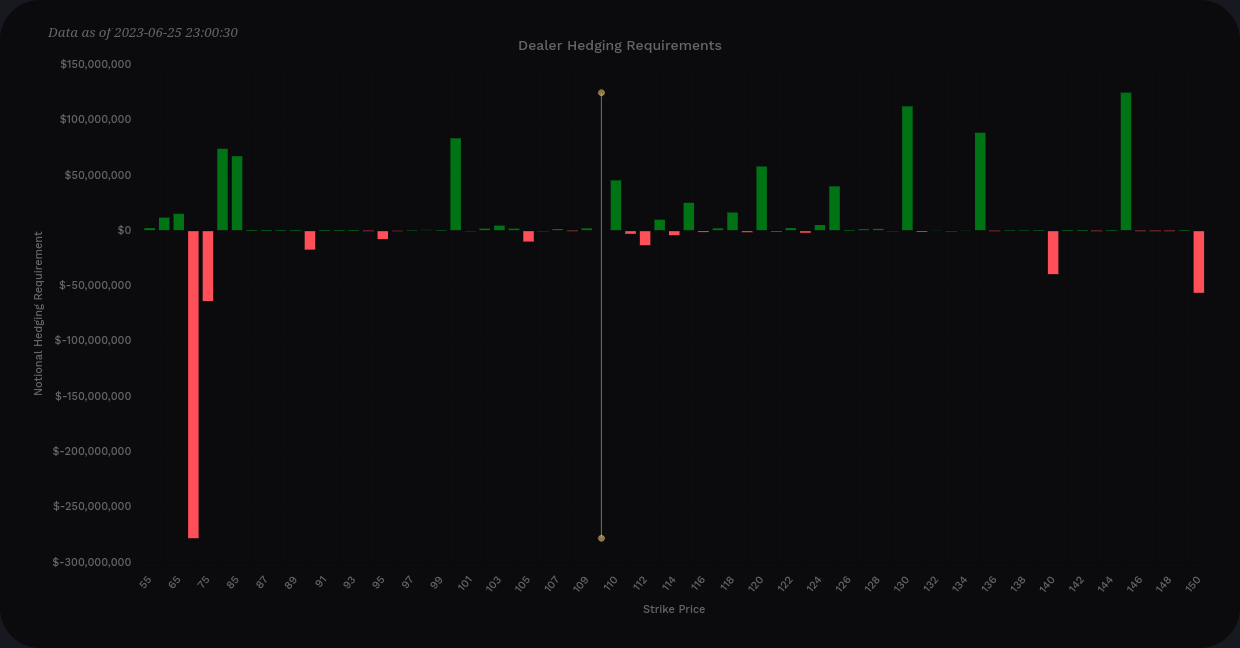
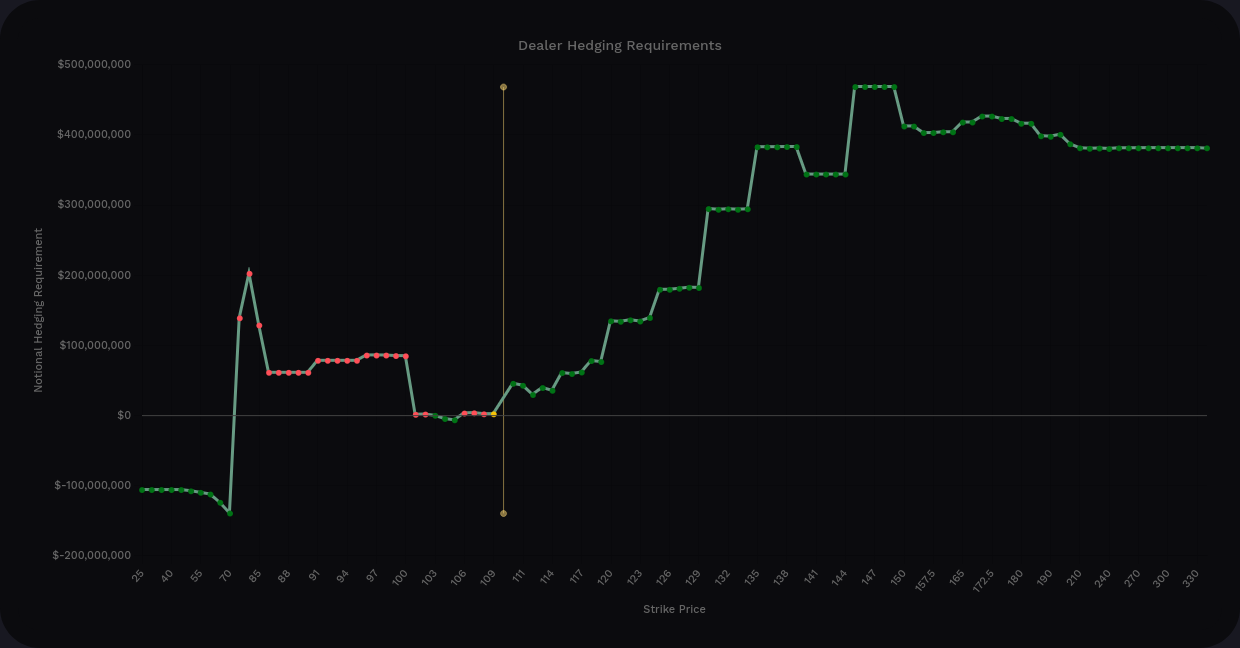
The strikes at $130 and above crept slightly to a more positive level. The big bearish bet at $70 from a LEAPS contract still remains. Aggregate vanna remains extremely positive at just over 4x at the extremes. Outside of the $70 bar, the tallest bar tops out at $125M on the $145 strike.
If IV comes down or remains steady, AMD has a very bullish setup based on vanna. AMD's IV rank sits around 54%:

Delta-adjusted gamma (DAG) looks a bit different this week:
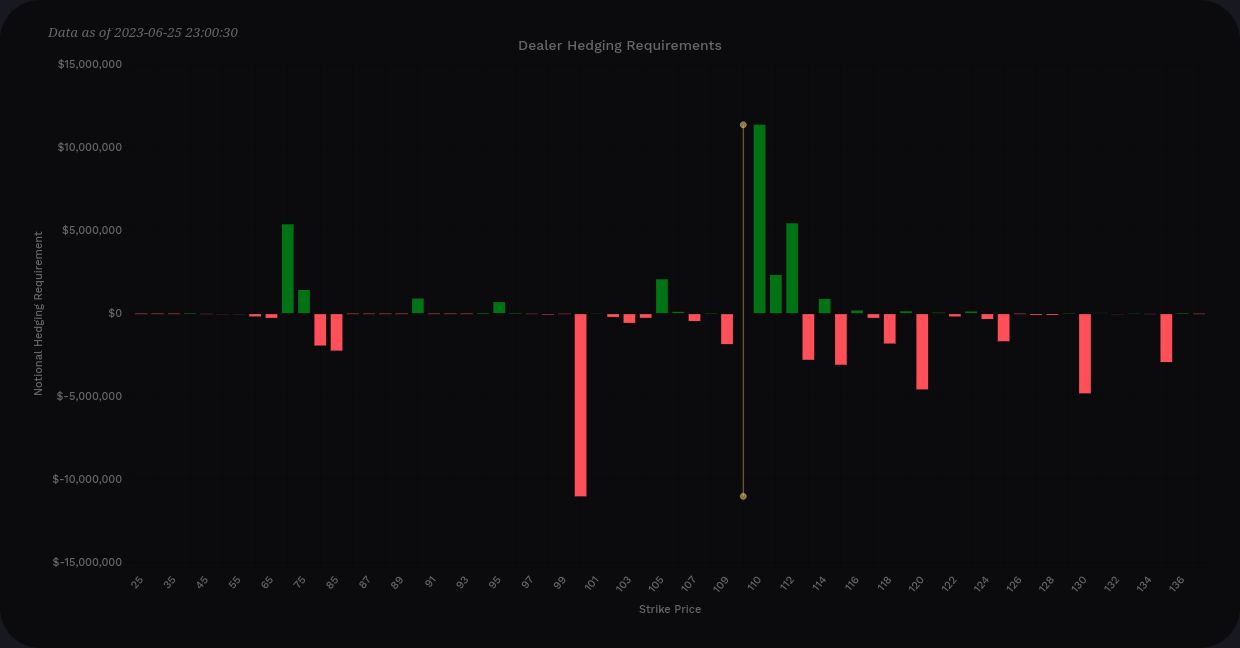
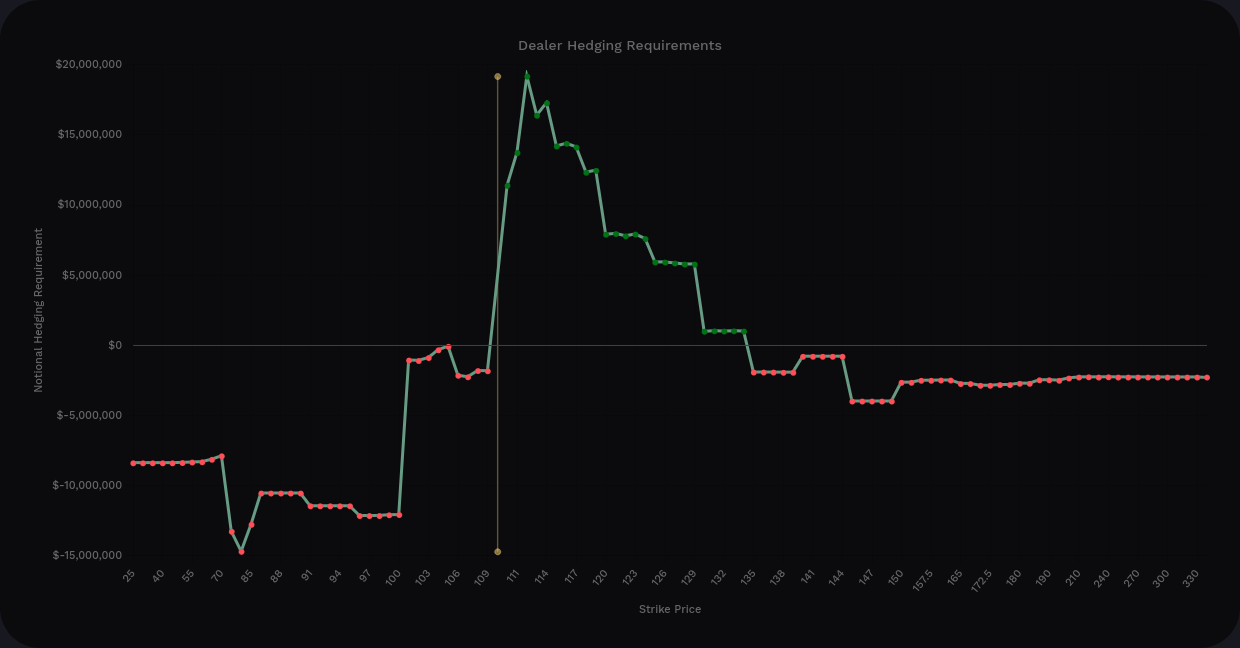
DAG was fiercely negative last week and it finally went over the zero line this week. Note the y-axis scale, though. DAG bars are topping out just past $10M while vanna bars were exceeding $100M.
It looks like we could see a run to $115 with some local help from gamma, but it's difficult to see where we might stop if we begin moving down.
Other data
What contracts are dealers likely holding in the market? The 15 day momentum shows dealers are still long, which implies that market customers are in bearish contracts:

Options pricing also suggests something interesting this week. There's a 44% chance of a move downward up to 3.6% and a 47% chance of an upward move up to 5.5%:

Our next OPEX, 8/18, looks bullish, but we're in for a bumpy road until then on the weeklies:

Someone's making some big bearish bets at the $140 strike for 8/18:

Thesis
AMD is in a correction and there's no doubt about that. The big question is where the correction ends.
- Will it end around $105 where the 50MA sits? I can't find much in the options positioning or options trades that suggests that's a stopping point?
- How about $100? This is a big psychological level and we have some decent positive vanna here (around $83M).
- $70-$80? This is 200MA territory and it approaches that massive $275M negative vanna line. AMD would have an incredibly positive vanna curve at that point and buying pressure would be very strong.
My bet is that AMD will find some support at $100, but unlikely at $105. Some local gamma support might help keep price close to $110 temporarily.
Good luck out there! 🍀
All investments come with significant risks, including the loss of all capital. Please do your own research before investing, and never risk more than you are willing to lose. I hold no certifications or registrations with any financial entity.


Discussion