AMZN analysis for April 4

The future of the broader market might be cloudy, but AMZN is delivering good returns lately. This is a good time to zoom out a bit and see how important the current levels are. 👀

Happy Thursday! It's been a choppy market week so far and I've shifted a bit towards more delta-neutral strategies where I'm neither bullish nor bearish. We'll see how this plays out.
All investments come with significant risks, including the loss of all capital. Please do your own research before investing, and never risk more than you are willing to lose. I hold no certifications or registrations with any financial entity.
Today's post is all about AMZN. Let's go! 📦
The broader market
Tunnel vision sets in for me as I focus on my trades during the day and sometimes I lose track of the macro picture. Ilya Spivak does a great recap Monday through Thursday of the macroeconomic factors impacting markets and yesterday's was a good one:
It's a 22 minute segment, but I usually watch it at 2x speed and it's easy to follow. Some of the numbers he shares makes it look like inflation might be stickier than expected. Also, some of the growth, especially around services, was lackluster.
All of Ilya's helpful content is over here:

Less colorful charts
I've been doing a lot of reading lately on trading psychology and how to avoid behaving like the masses in markets. One of the more interesting suggestions I read lately was to avoid using much color in your charting, especially with candlesticks themselves. The argument is that colors have a deep emotional connection with all of us, and sometimes they can cause an imperceptible emotional reaction that impacts how we think.
Long story short: I've tried to remove most color from my charts. One of my friends in the Theta Gang discord says "You've gone from TRON to Steamboat Willie." 🤣

We will see how this goes. 😉
AMZN chart
The daily chart for AMZN looks great, and especially good since the October 2023 lows. While I was looking at the chart this morning, I spotted a trend line that was initially support, then resistance, then support again. Trend lines and chart drawings are totally subjective, but I like how many candlesticks that this line touches:
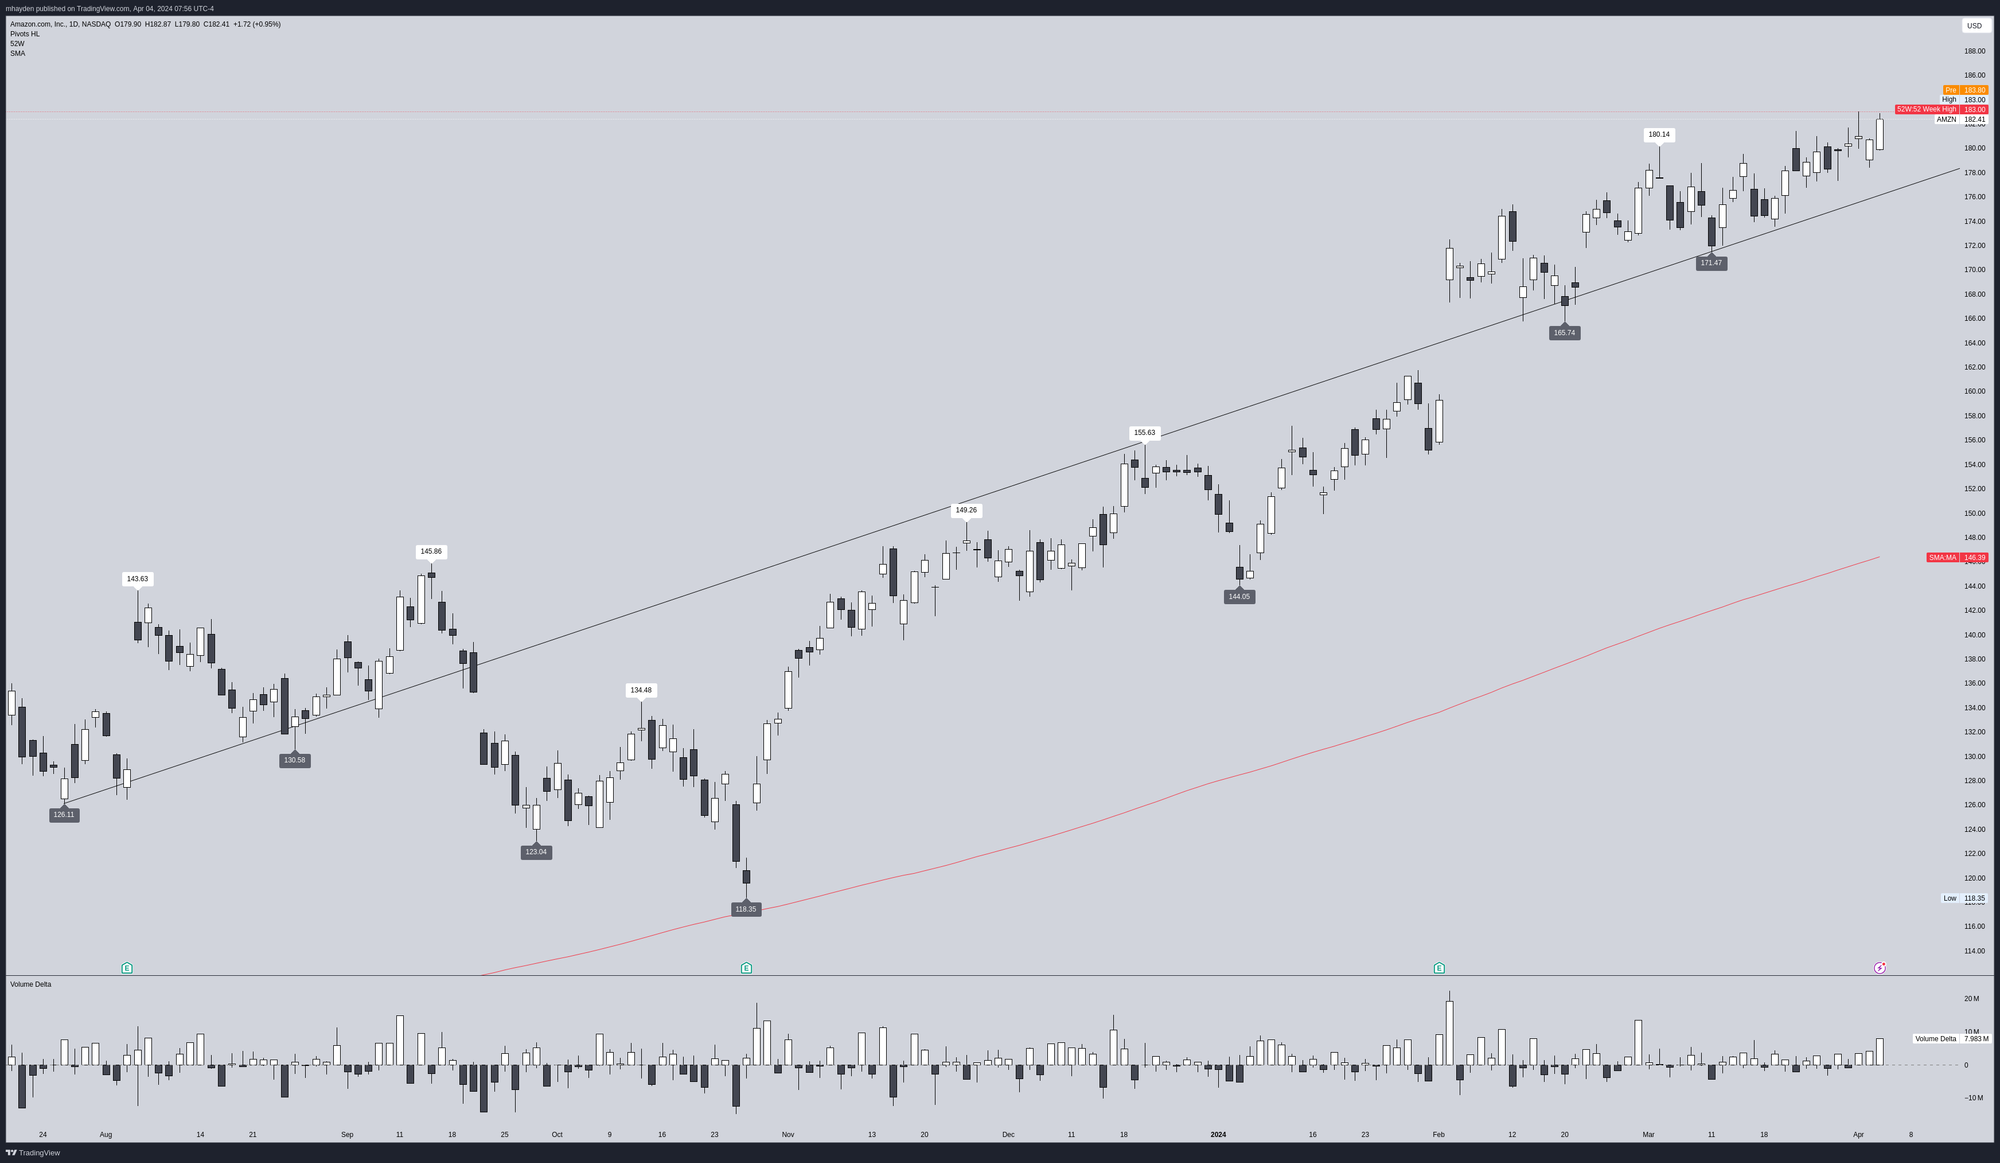
The indicator on the bottom gives me an idea of the volume delta each day. It has a wick much like a candlestick. White bars above the middle line are net bullish volume days while dark bars below the middle like are net bearish. If you see a wick on a bullish candle, it means that although the day finished with mostly bullish volume, it was more bullish during the day and then retreated. It's the opposite for a dark candle with a wick.
AMZN has had 12 out of the last 15 days with net bullish volume, it recovered over the trend line, and it sits well above a 200 day moving average. Let's zoom in a bit and look at the patterns since the last earnings call in February:
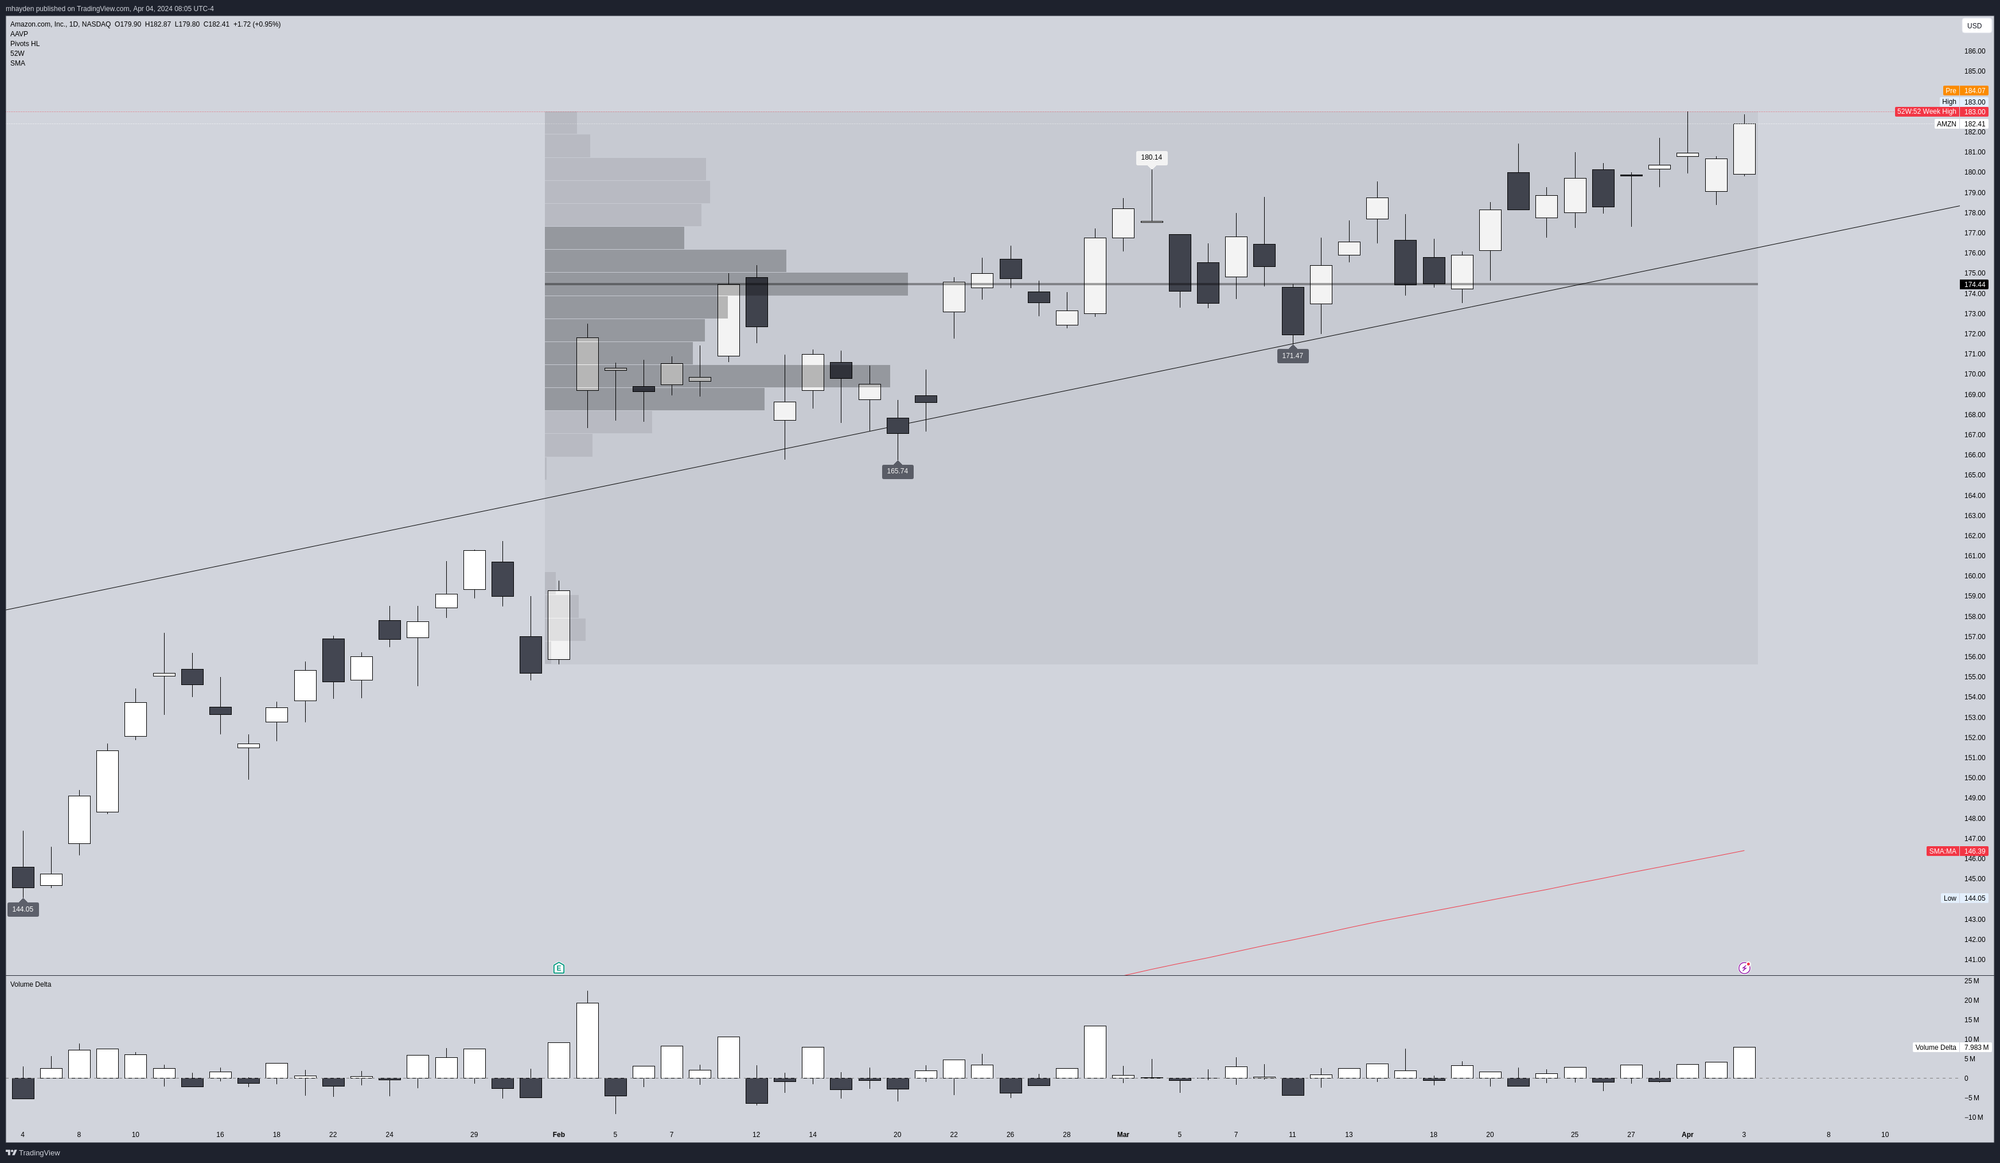
I've also added an auto-anchored volume profile set on the last earnings date. The majority of the volume from the last earnings call is centered around $174 with a secondary area around $170. If AMZN does take a retrace down, our trend line is about to cross $180 and we have strong volume at $174.
It's always good to zoom out a bit and review a longer term chart to see how the current price movement relates:
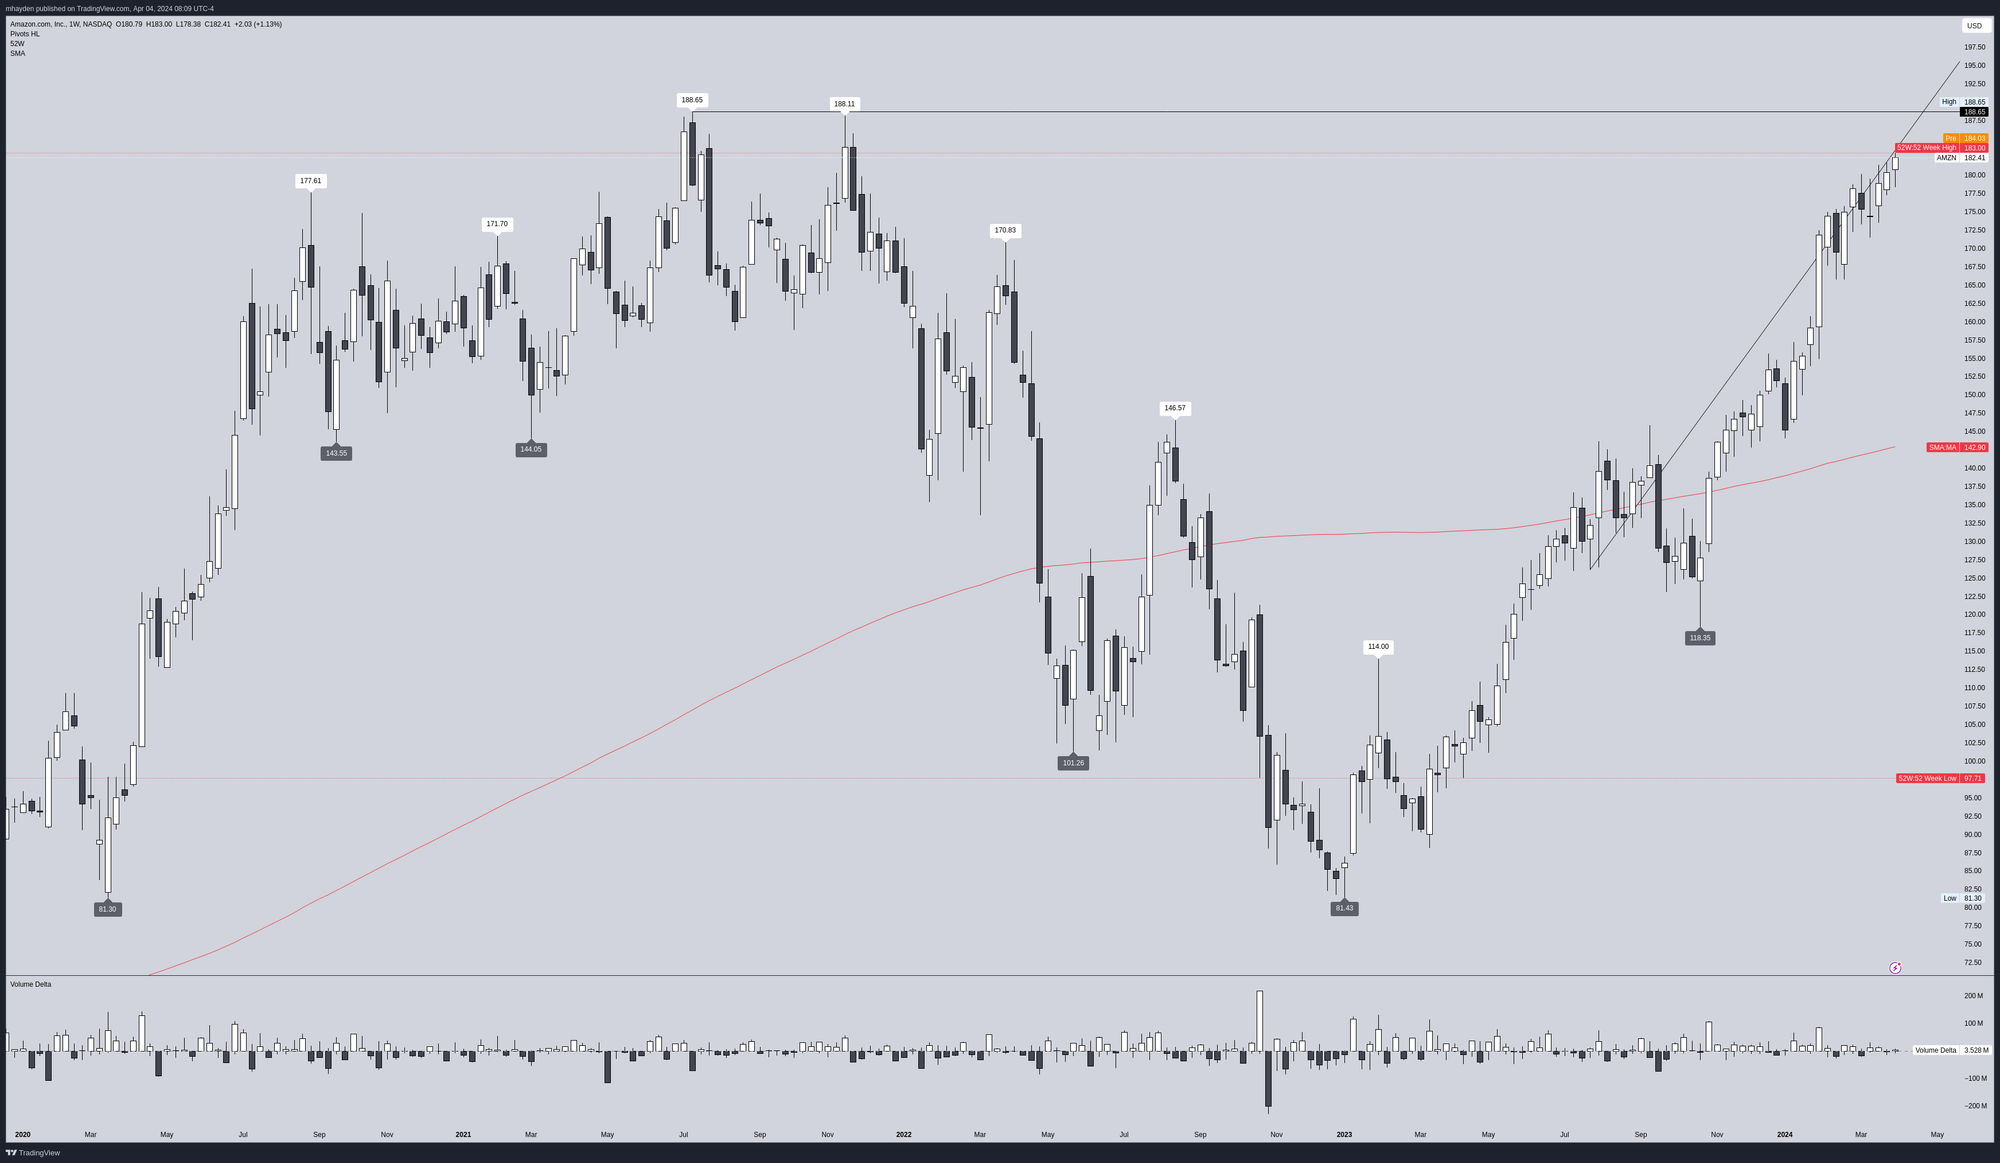
AMZN has an all time high just over $188 that we're building back to once again. AMZN soared during COVID as people ordered lots of items from home and companies shifted more of their IT workloads to AWS. That definitely corrected through 2022 as inflation took hold and companies reduced their spending on cloud deployments.
We're certainly rallying back now and it will be important to watch this one as it creeps back up to the high $180s.
Institutions
Volume Leaders shows where institutions are interested and there's been plenty of interest in AMZN lately:
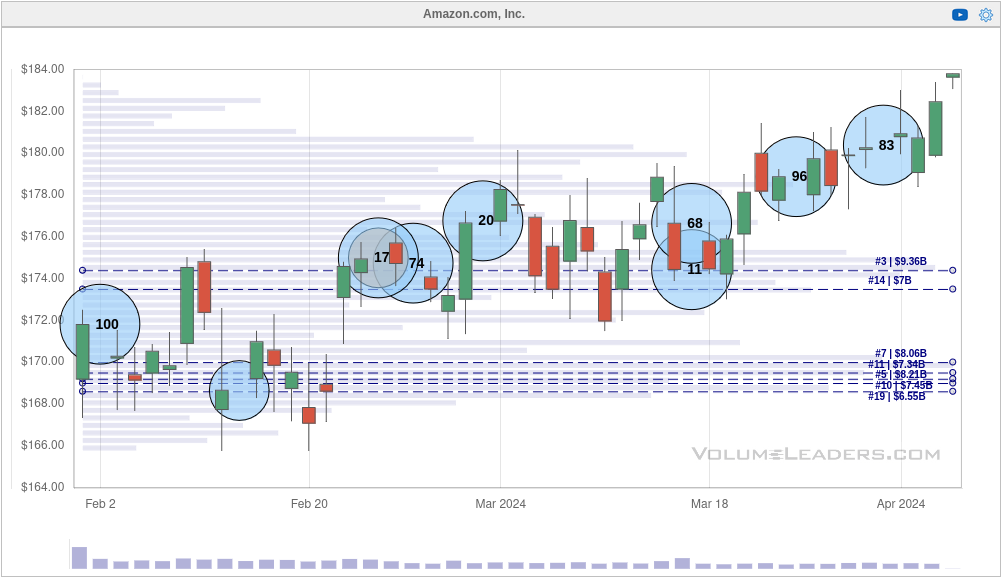
The numbers in each circle are a rank of the trade relative to all of the trades seen for that ticker. So the recent #83 means it's the 83rd biggest trade ever made in AWS. Look at how many top 100 trades there are since the February 2nd gap up! 👀
There are two things I like about this:
- As AMZN consolidated in the $180s, institutions began making trades. Most were not top 10 trades, but then a #11 came through at the end right before AMZN lifted off. This nibble, nibble, nibble followed by a big trade is a great pattern I keep seeing on these institutional trading charts.
- AMZN has trade upwards through most of these big trades. A continuation after multiple large institutional trades usually gives me a hint that institutions are very interested in the current price trend.
Thesis
AMZN's chart doesn't give much to be bearish about, but a big test is coming above $188. Will it reach a new all-time high and keep going? Will we see another hard retest of the trend line or perhaps the 200 day moving average? Nobody has any idea about those odds, but what's important is how you will react to those moves.
If AMZN reaches the upper $180s and retraces back a bit, I'd be interested in selling a strangle with a bullish bias to capture some of the temporarily increased volatility. If it breaks through $188 with momentum, I might look to just sell a short put.
I was sitting on a short put for AMZN for a while, but I bought that back and converted to a short strangle. This one is pretty aggressive at 0.25 delta on both sides. I'm betting that AMZN will stay between $170 and $200 through May 17th:
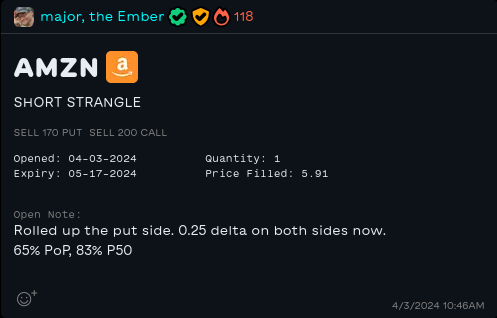
My exit plan is either reaching a 50% profit or rolling the trade to the June expiration when we get to 21 DTE. I'll likely roll puts up and calls down to keep it balanced if it tilts heavily one way or the other.
Good luck to all of you out there today! 🍀
Discussion