AMZN analysis for May 7

Where is AMZN headed in 2024 as it gains strength relative to its peers? Let's take inventory of what the data is telling us.

Happy Tuesday! It's been about a month since I took a deep dive into Amazon's data and today felt like a good day to revisit it. Things have settled down a bit since the earnings call on April 30th and AMZN reports again on August 1st.
All investments come with significant risks, including the loss of all capital. Please do your own research before investing, and never risk more than you are willing to lose. I hold no certifications or registrations with any financial entity.
Let's dig into some data. 🚀
Charts
Amazon is a tough company to pin down. Sure, you could call it an online retailer, but that's only part of the story. It also has Amazon Web Services (AWS) which is the most popular cloud infrastructure provider in the world. It's also tied up in the AI fracas with NVDA and others as it builds out high performance offerings for training and serving models.
Here's a daily AMZN chart since May 2023:
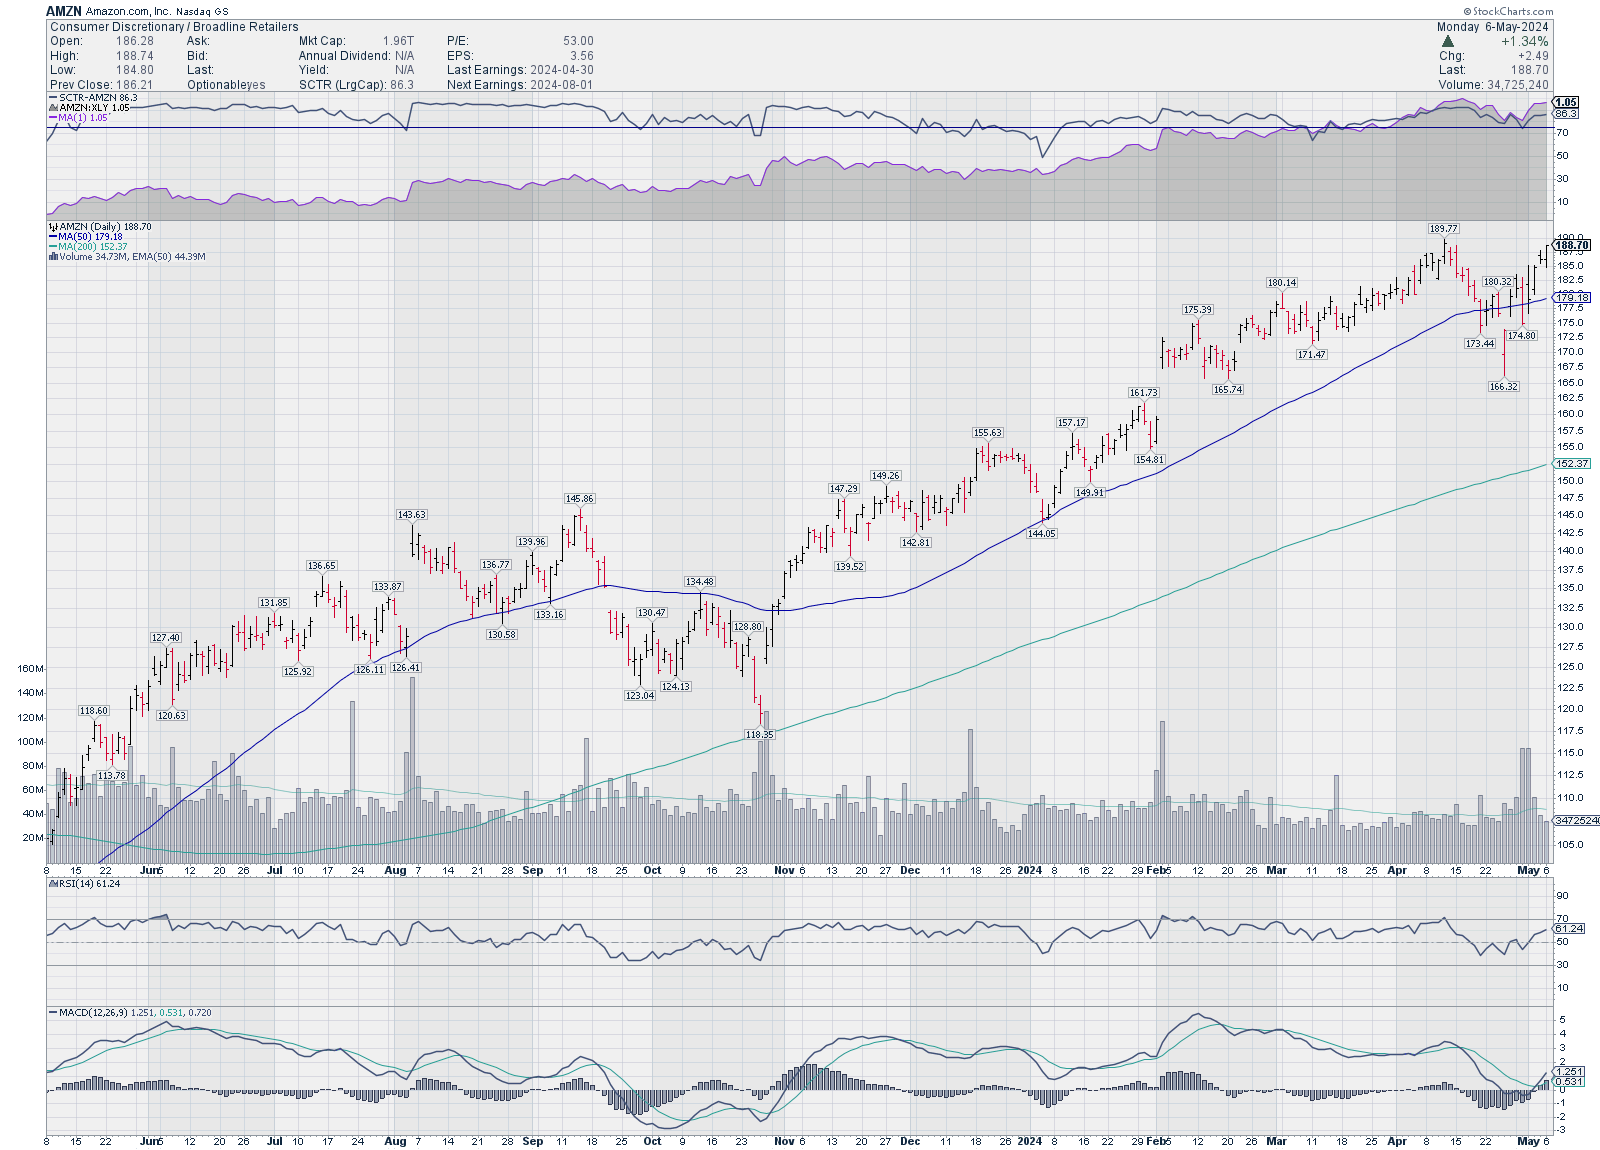
Here are the first things I notice:
- MACD and RSI are both trending up from a low level along with the price. I like seeing a convergence between all three here.
- Amazon's SCTR rating is still high at 86.3.
- Amazon has gained strength over its sector (XLY, Consumer Discretionary) since August of 2023. It hasn't lost strength with the recent market dip.
- Price reclaimed the 50 day moving average (dark blue) and the 50 is well above the 200 (light blue).
Let's zoom out to the weekly and get a broader history:
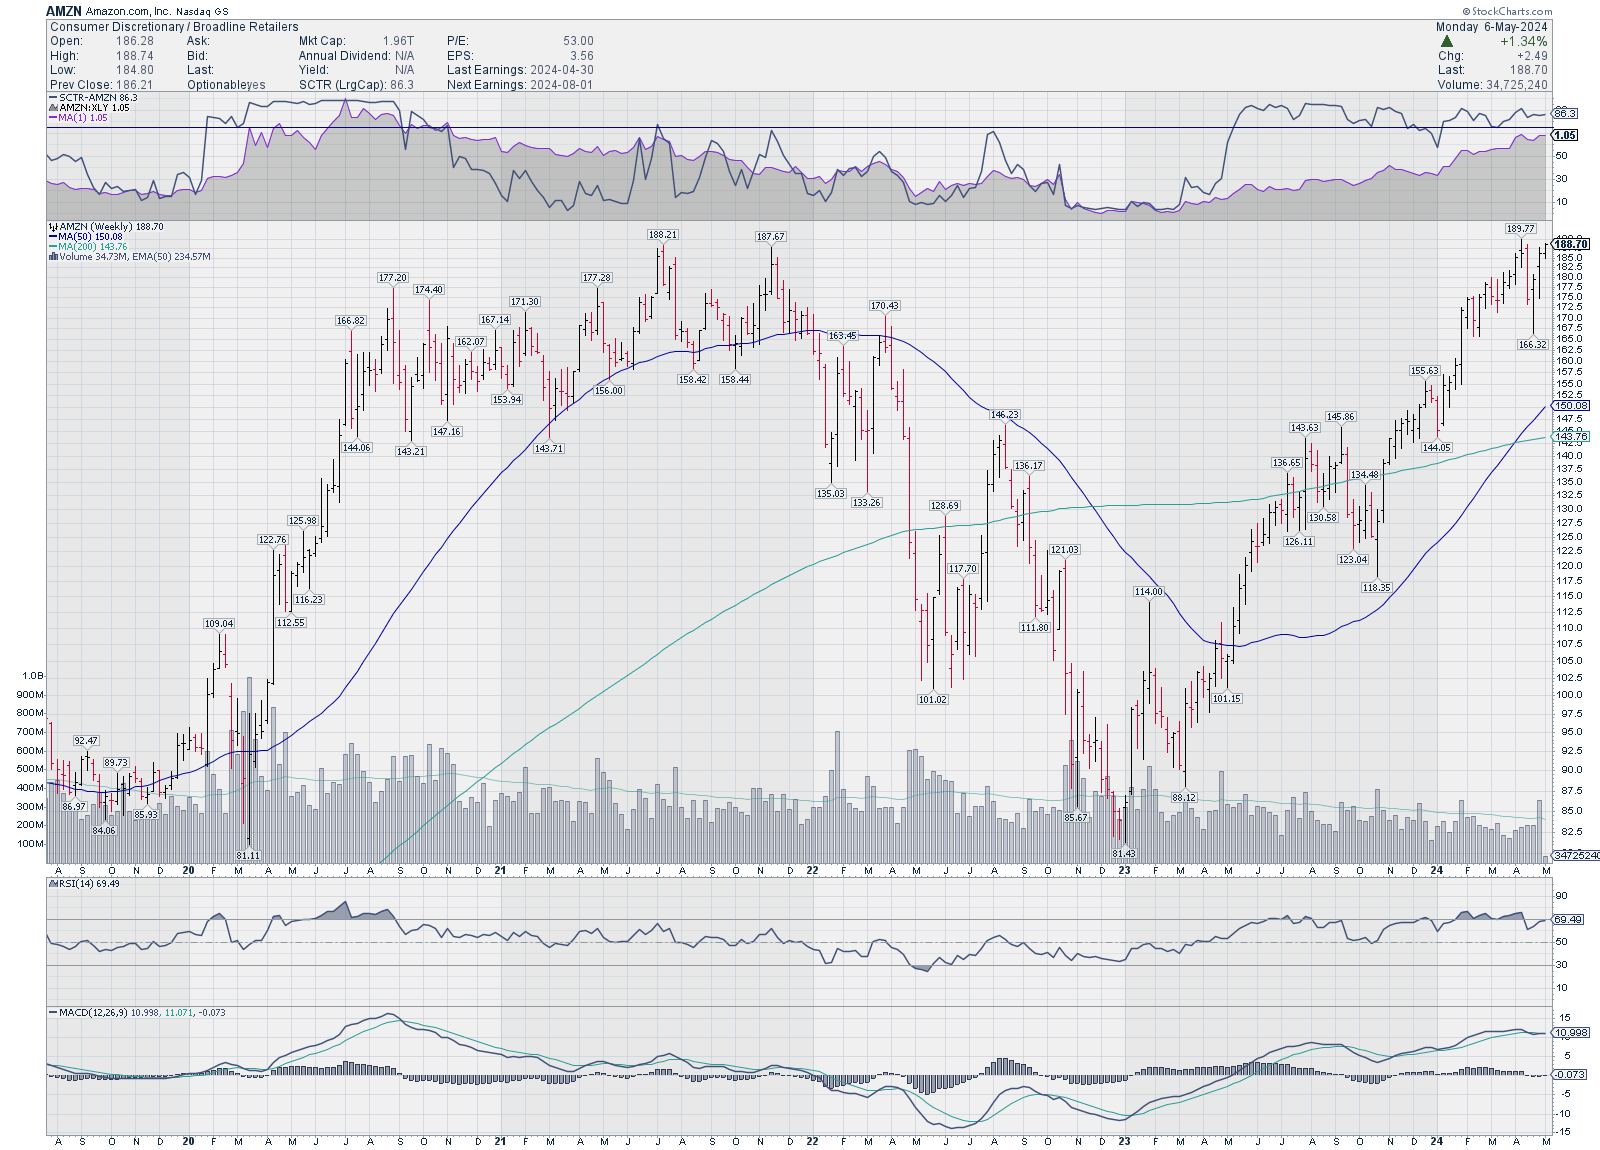
2022 was a rough year for AMZN as it was for so many companies. The situation definitely turned around in early 2023 and the summer correction in 2023 barely shows up on AMZN's weekly chart. MACD has flattened out a bit but it remains very positive. RSI is running near 70 as price goes up and that's another confirmation of strength for me.
Comparisons
How does AMZN compare to the broader S&P 500? The mid-2020 slide down to early 2023 shows AMZN weakening steadily but then early 2023 caused an abrupt turn:
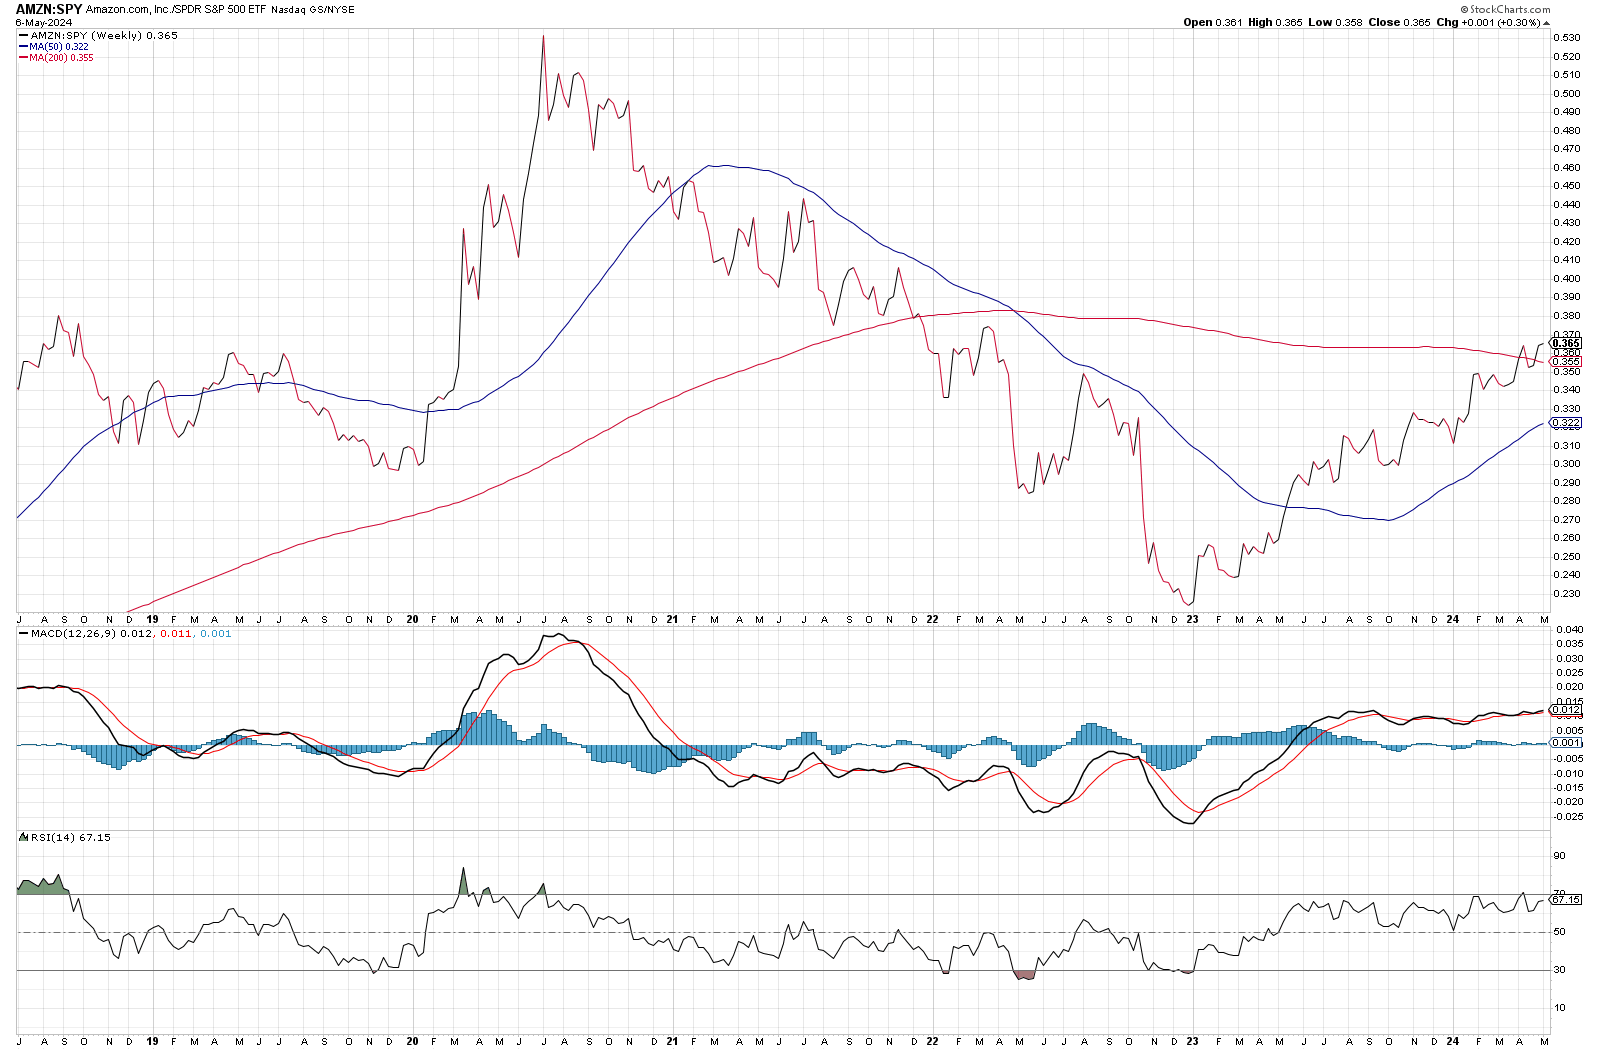
The move for AMZN in 2023 and 2024 looks exactly the opposite from the move during the previous two years. The slopes are almost identical. We also have a very positive MACD and RSI that align with the price movement.
The biggest rival for AWS is Microsoft's Azure and there's a similar pattern here when you compare the ratio of the two:
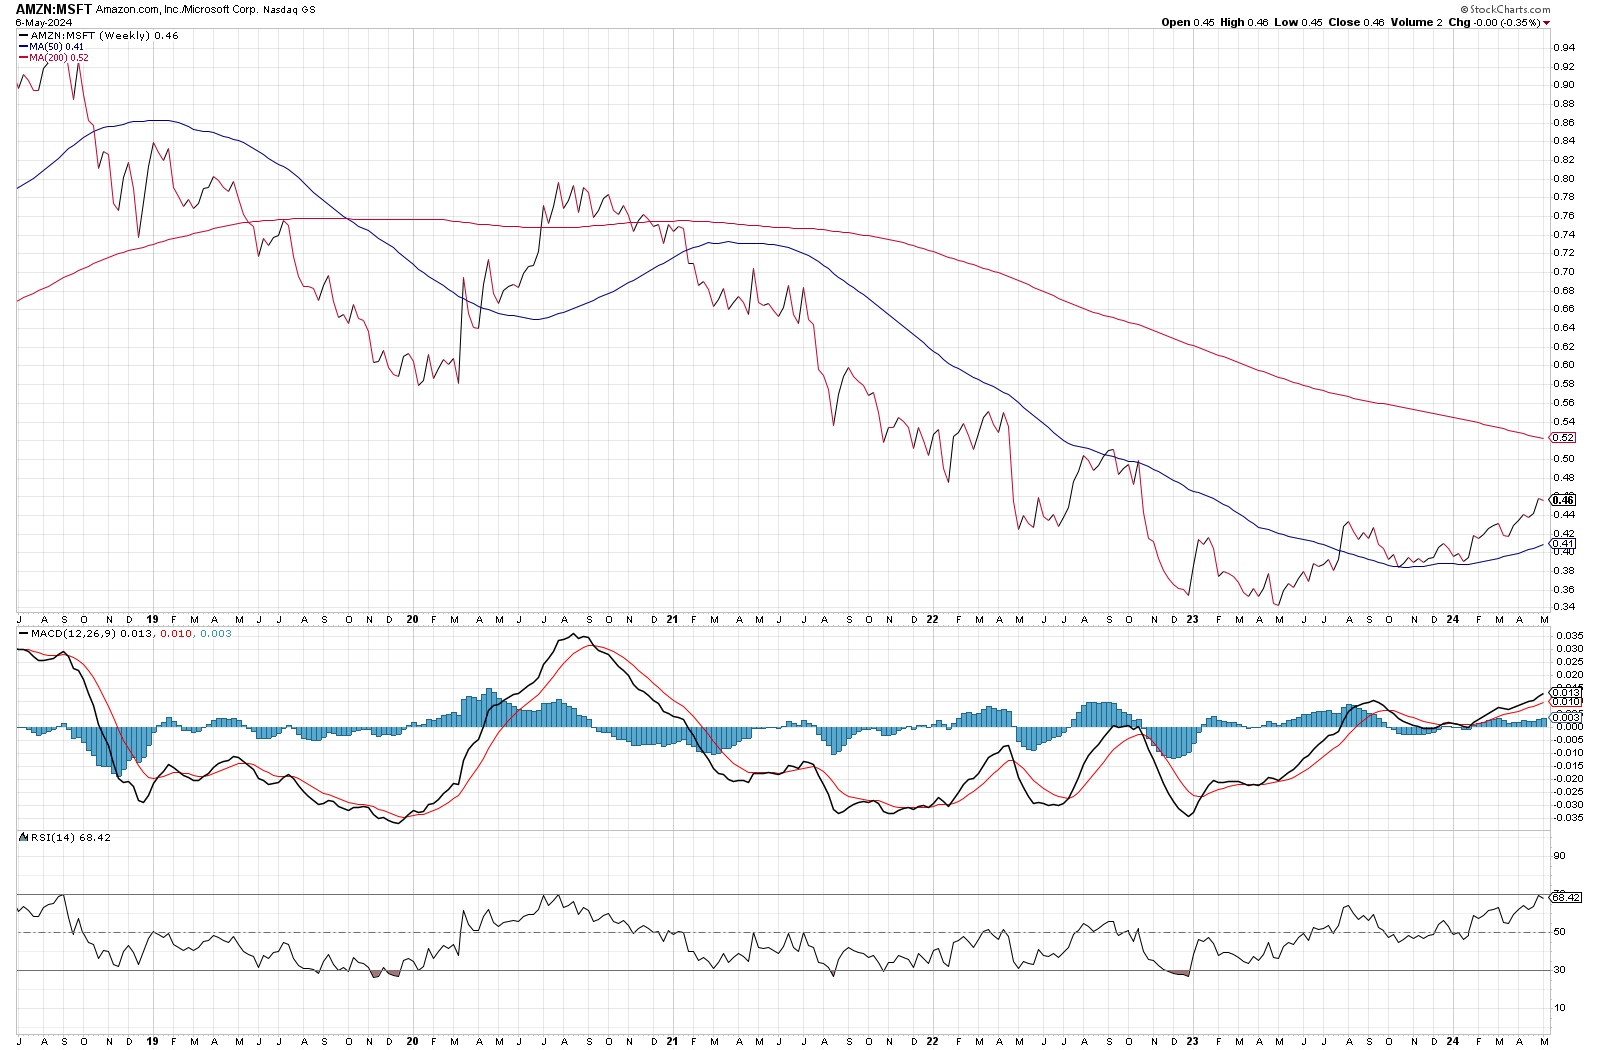
A downward move in this chart means AMZN is losing strength to MSFT. You can see that clearly from 2018 through 2023. However, AMZN turned the corner here as well in 2023.
Institutions
Volume Leaders shows institutional trades along with the trade price, time and size. It's up to us to figure out the sentiment of these trades. 🤔
There are only two trades ranked in the top 100 over the last 30 days:
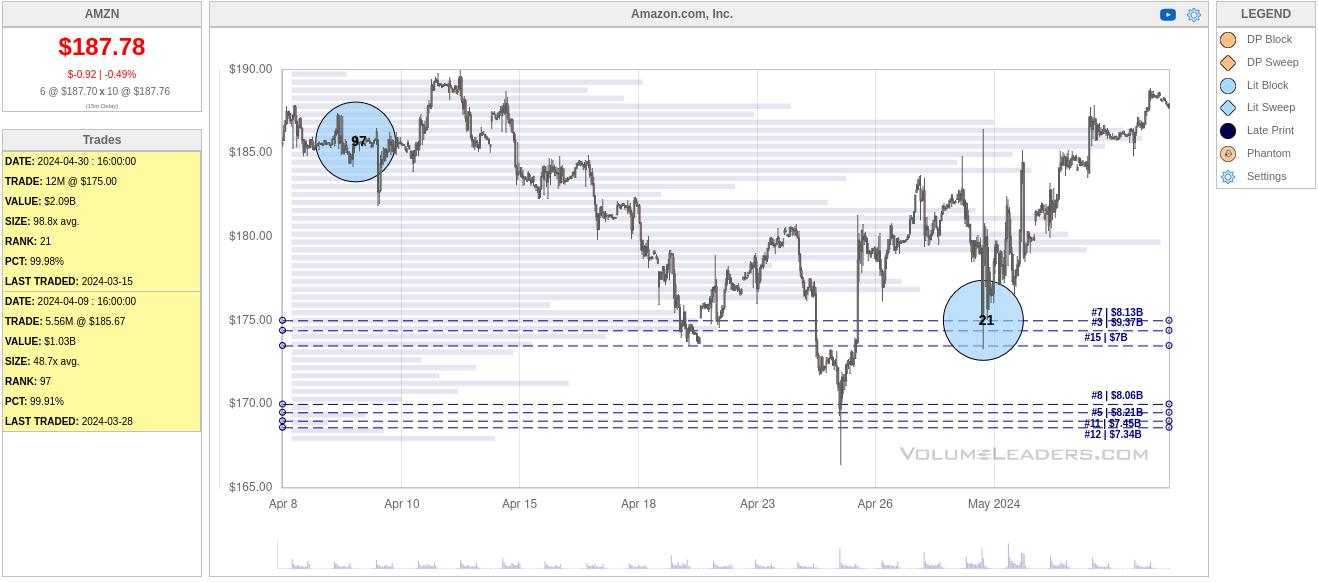
#97 back in early April looked like an opening short or an institution taking profits after the run-up. #21 definitely looks like a buy as AMZN came down to touch $175. If you double-check the AMZN daily chart, that was the day when it reclaimed the 50 day moving average.
If we check a year to date chart, more large trades appear:
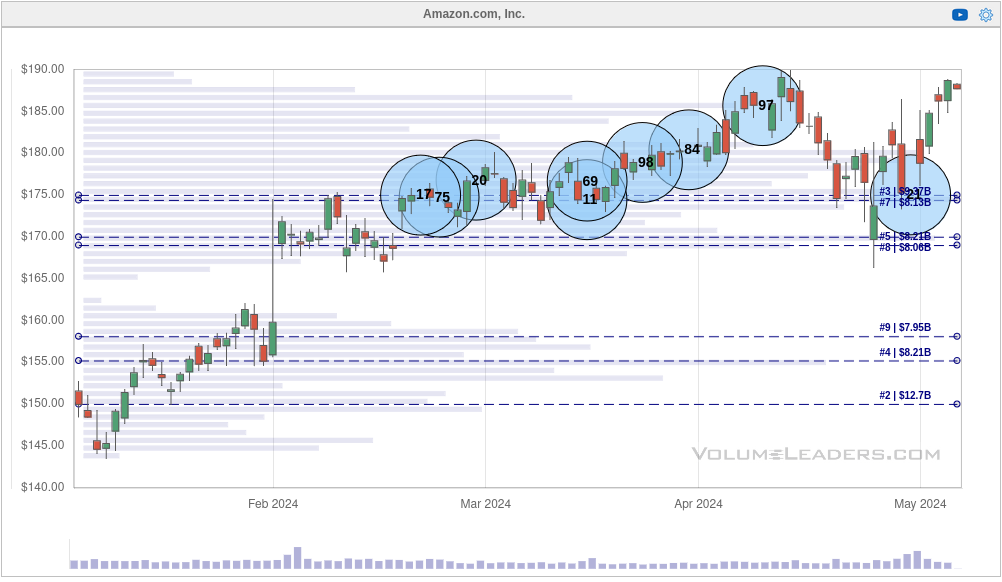
Wow, look at that $175 level! Now the big buy (the #21 trade) makes a lot more sense. AMZN spent quite a bit of time wandering around $175-$180 while institutions built a big position. We can see tons of trades in this area and some massive volume levels from $170-$175. It's no surprise that institutions made a big move again around $175 in the past week.
Analysts
I generally ignore analyst price targets because they can be misleading and sometimes downright false. There have been many incidents in the past where analysts were paid by investment banks to paint a rosy picture for a stock so the bank could get their customers out of positions on a rally. 👀
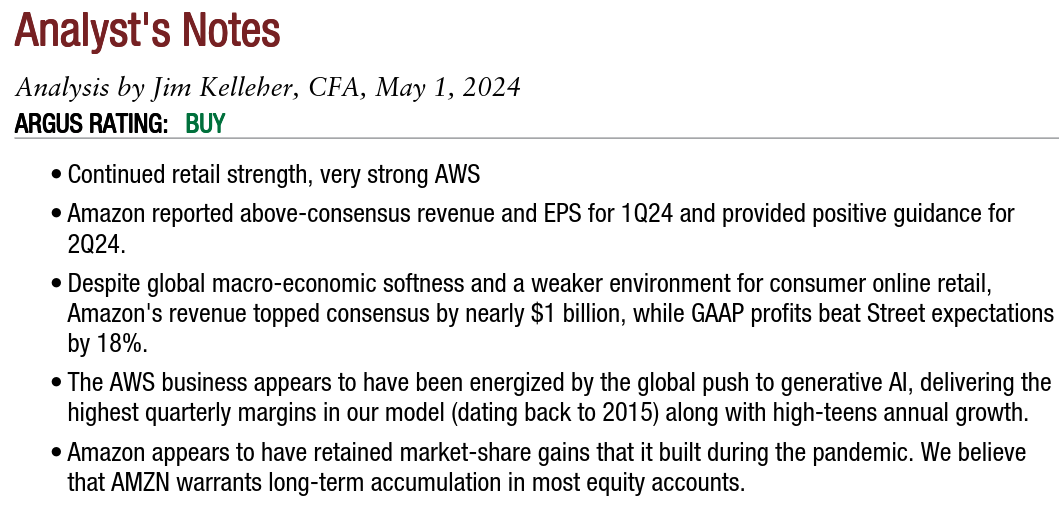
However, their approach to reviewing fundamentals sometimes catches things that I missed. Here's an excerpt from the most recent report from Argus about AMZN:
Thesis
AMZN retains strength among its peers and is building more strength in some areas. It's difficult to deny the market share of AWS over the past several years, too. Daily and weekly charts show a good moving average setup with MACD and RSI converging with price moves. Institutions also returned to buy at their big levels around $175.
This ticks just about all of the bullish boxes for me.
Amazon's implied volatility sank after earnings, but I still went after some short puts this week. I sold two $177.50 puts for June 21 at $2.13 premium for each. My exit criteria here is 50% gain or management at 21 days to expiration (DTE).
Good luck to all of you today! 🍀
Discussion