Analysis for August 17
Everything seems to be going in all directions, but let's look for data that increases our odds. 🤓

Yesterday brought us more bearish price action across most of the market. Some traders are throwing out their previous bets on the end of interest rate increases and they're factoring in the possibility of another rate hike from the Fed.
All investments come with significant risks, including the loss of all capital. Please do your own research before investing, and never risk more than you are willing to lose. I hold no certifications or registrations with any financial entity.
Let's go!
Broad market look
SPX, which includes market cap weighted companies in the S&P 500, is sitting at an RSI of 38%, which is fairly oversold. It can certainly go lower.
The SPXEW index, which throws all the S&P 500 companies into an equally weighted bucket, is down to 33.61% on the 14 day RSI. SPX usually runs higher than SPXEW because it's more heavily weighted in big tech names like AAPL.
40.87% of the stocks in the S&P 500 are over their 50 day moving averages and 52.38% are over their 200 day moving average line. We last saw this level on the 200 MA breadth on June 23.
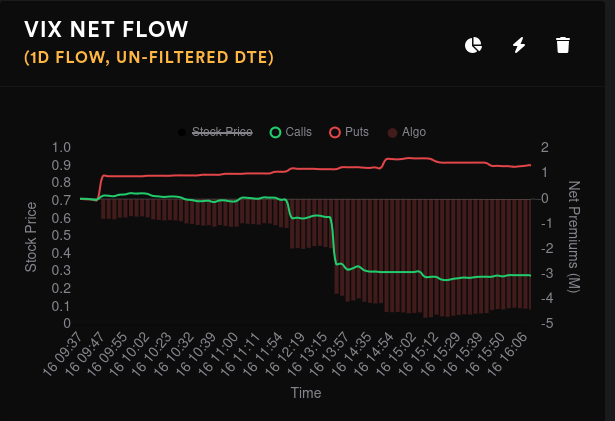
Bullish bets on the VIX moderated slightly with puts coming in the morning and calls aggressively selling off after lunch:
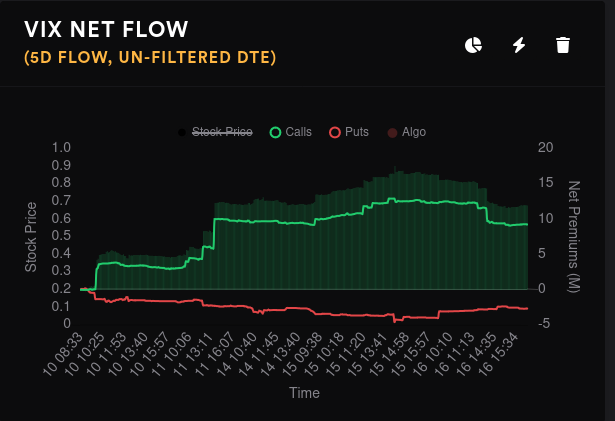
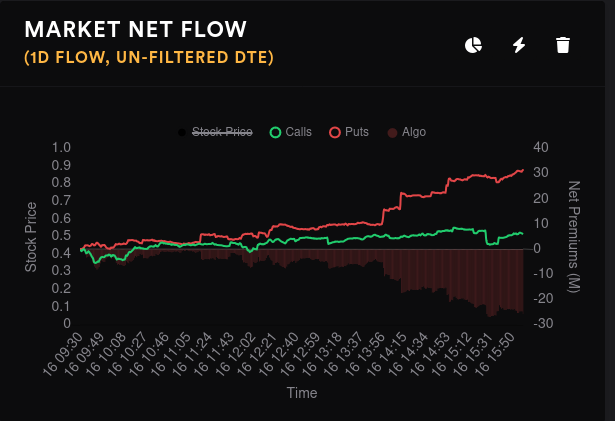
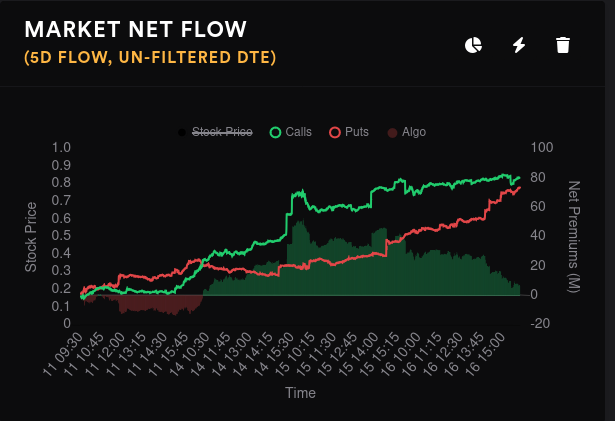
The market sits in a precarious position now and premiums from calls and puts are just about to touch on a 5 day chart:
SPX 4400 (SPY $440) looked like a possible target yesterday if things got worse and the price headed there in the afternoon:

We can always go lower, but it looks like the brakes might be applied at SPX 4215 on the way down.
AMD
NVDA earnings are coming up on 8/23. AMD turned a bit bullish in the afternoon yesterday but it's been a battle for the options traders lately:

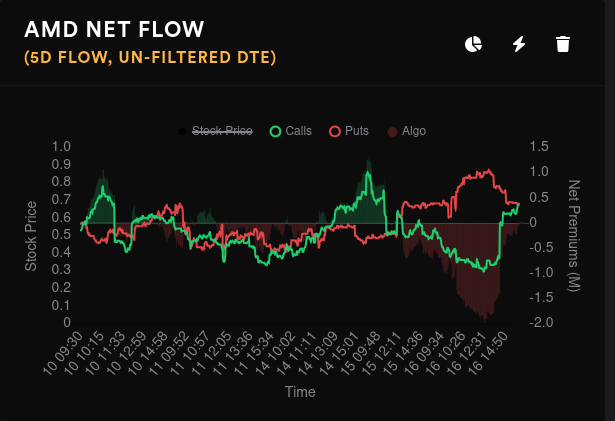
AMD's aggregate GEX has shifted around since I last looked. The biggest magnet for price shifted up to $125 and a lot of the resistance lines flattened out. 9/15 and 10/20 have the most GEX as of today, so we'll look at those right after.

9/15 GEX appears to want $115 as a magnet with the biggest resistance at $120.

So wait, where does the $125 line come from? That shows up in the 10/20 GEX. $125 and $105 seem the biggest magnets for price, but a wall of resistance shows up from $110-$120:

There's still a big money trader betting bearish on $90 for 9/15 and they are still holding that position. This could be a hedge.
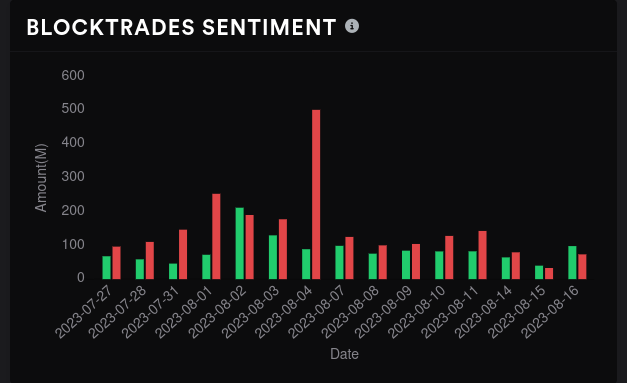
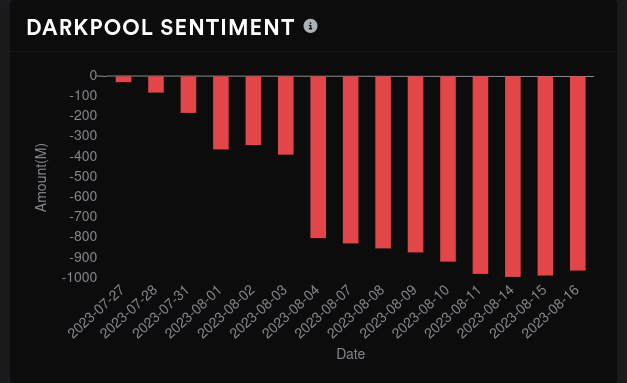
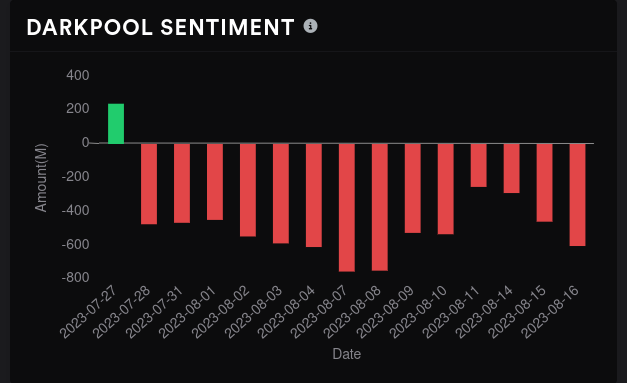
On the dark pool front, we had a day where bullish trades exceeded bearish ones. Overall sentiment is still really bearish but I'll take all the good news I can get. 😅
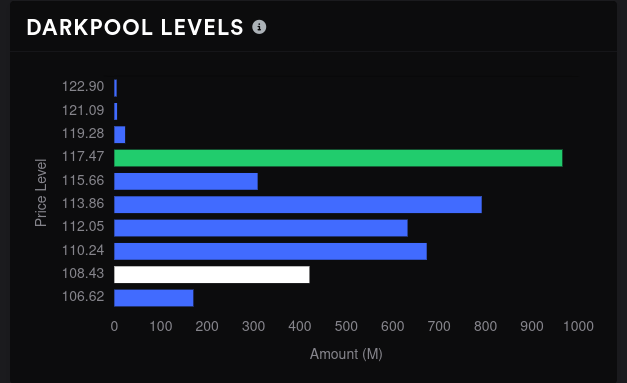
$117 is the largest level but mainly due to all the levels shrinking below it. It could be a resistance level where bag holders might want to exit their position. Below that level, $113.86 looks strong.
TSLA
Although TSLA looks firmly bearish on a five day scale, there was some optimism yesterday afternoon as TSLA's price slid downwards:
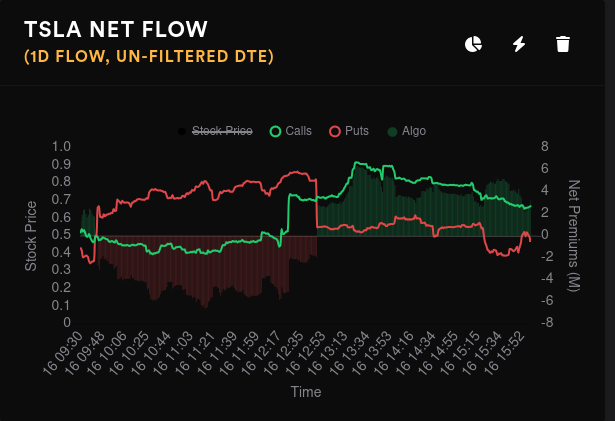
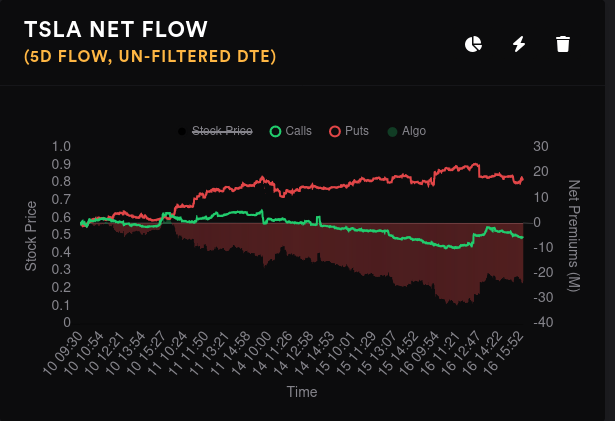
Dealers are still long (customers short), but options seem to be priced for an upward move. Vanna is still crammed into the 2025 expiration, but the dealer open interest shows plenty of indecision:

Aggregate GEX is still looking to get $270, but we have a minefield of resistance lines in between.

8/18 has the most GEX by far and we seem to be stuck in the midst of resistance land:

9/15 still has that $270 magnet and it gets stronger. $210 looks like it provides some downside resistance here.

Everything shifts for 10/20 and there's far more positive GEX than negative. $200-$220 looks like it will fight any downside moves and $230 might be a target for price.

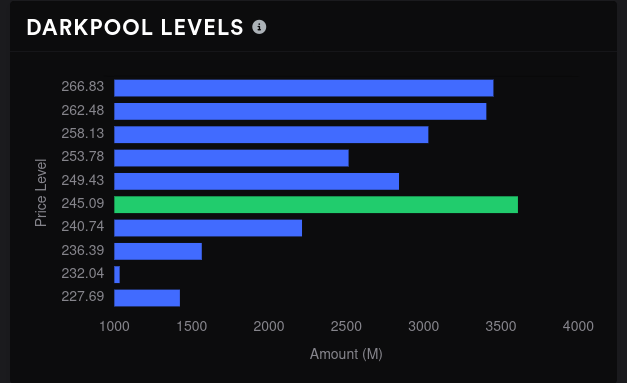
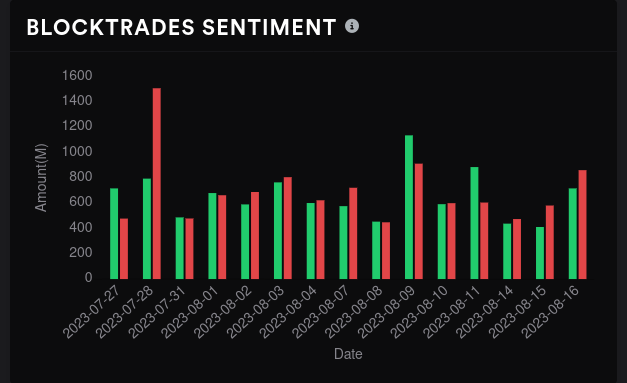
Indecision shows up in the dark pool trades, too. We had higher volume yesterday that was tilting slightly bearish. Our biggest level is around $245 but these levels are fairly close together and they shrank so much lately.
Thesis
Traders seem to be betting on a bearish dip for AMD going into 9/15 with an improvement coming for October and November. I've sold some 9/15 puts at $100 and $105 in a bet that some of the downside resistance at $105 will hold.
As for TSLA, there's a whole lot of indecision across the board. $200-$220 looks like an area where downside moves might slow down, but much of this depends on where the overall market is headed. If SPY continues a run down past $440 and $430, TSLA could easily take out those downside levels.
I sold a $210 put on TSLA for 9/15 as a bet on these downside resistance levels and we will see how that pans out.
As always, I keep my trades updated on the free Theta Gang site and you can find my trade notes there.
Good luck today! 🍀


Discussion