Another look at PYPL for May 3

What's changed with PYPL after earnings and a retake of the 200 day moving average? Let's dig into the data. 🤓

Happy Friday! As we await payroll data that could move the market this morning, I figured it was a good time to revisit PYPL to see if anything changed since my last post in March.
All investments come with significant risks, including the loss of all capital. Please do your own research before investing, and never risk more than you are willing to lose. I hold no certifications or registrations with any financial entity.
Let's get into the data! 🔎
Charts
First up, let's have a look at PYPL's daily chart. The blue trend line through the middle of the chart is the 200 day moving average. PYPL tried to retake the level back in January and failed. It made another attempt mid-March and suceeded with a hard retest of the level in April:
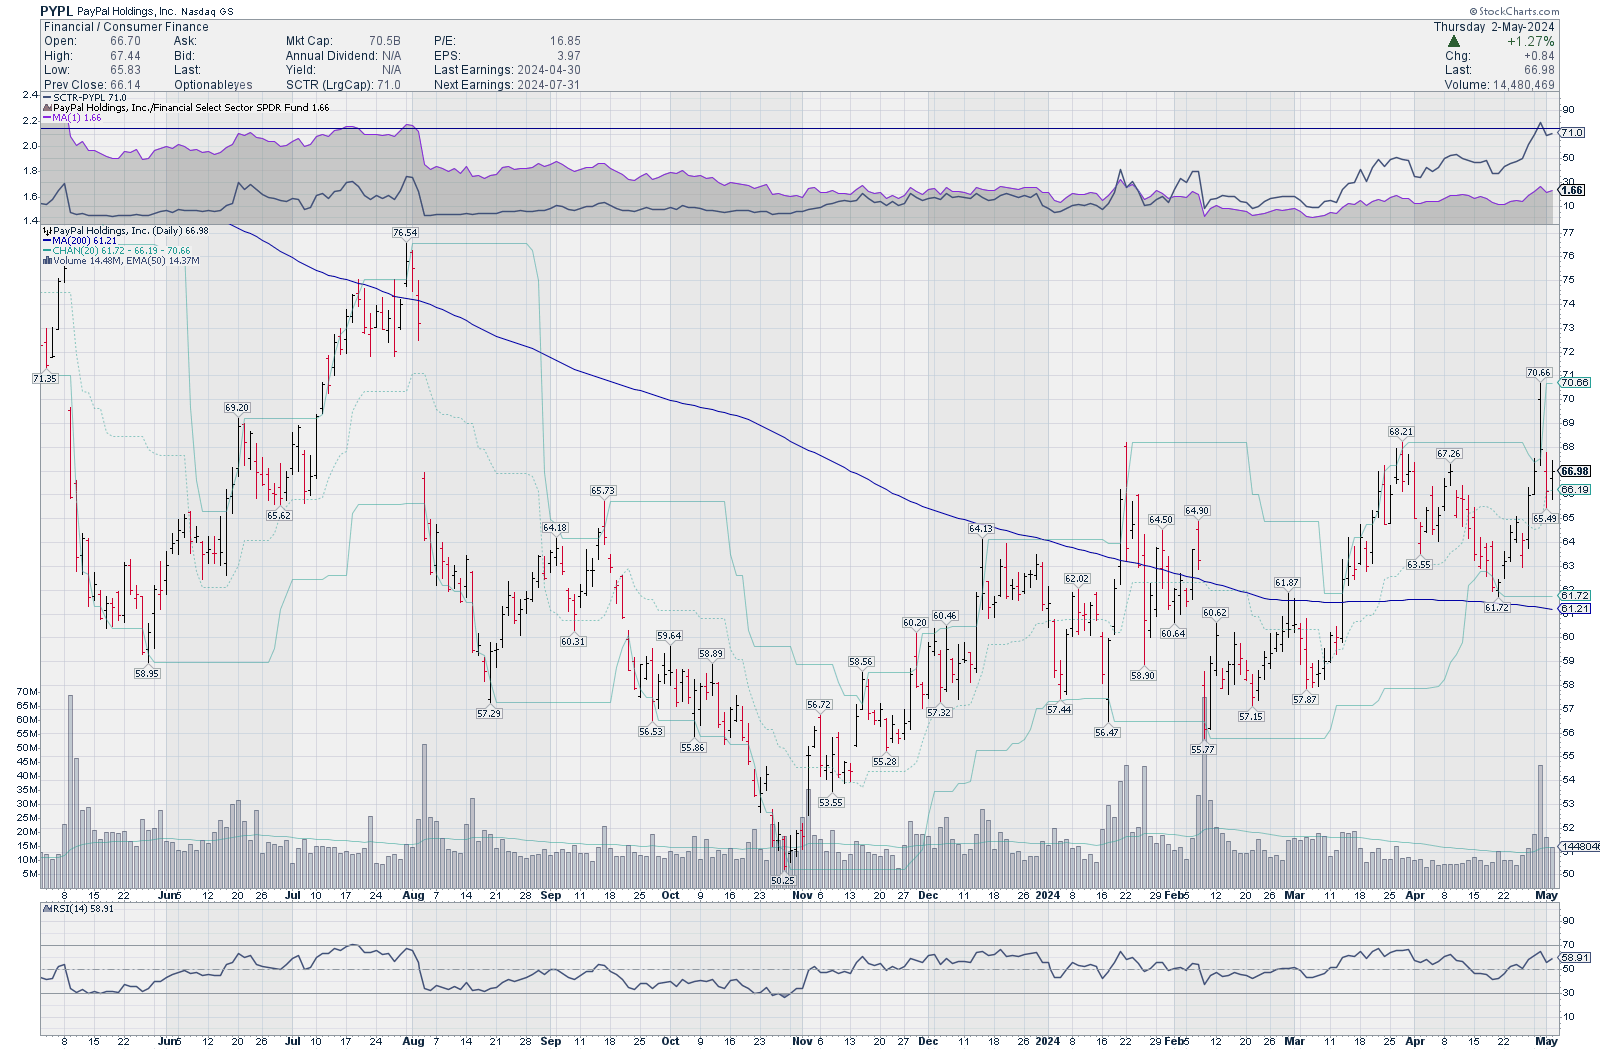
RSI is showing strength around 59% on a 14 day average and volume is picking up since the retest and earnings call on April 30th. If you move up to the top of the chart, you'll see a solid line sitting around 71. That's StockChart's SCTR indicator that measures indicators across multiple time frames. Higher numbers are better here as they indicate more strength across more time frames.
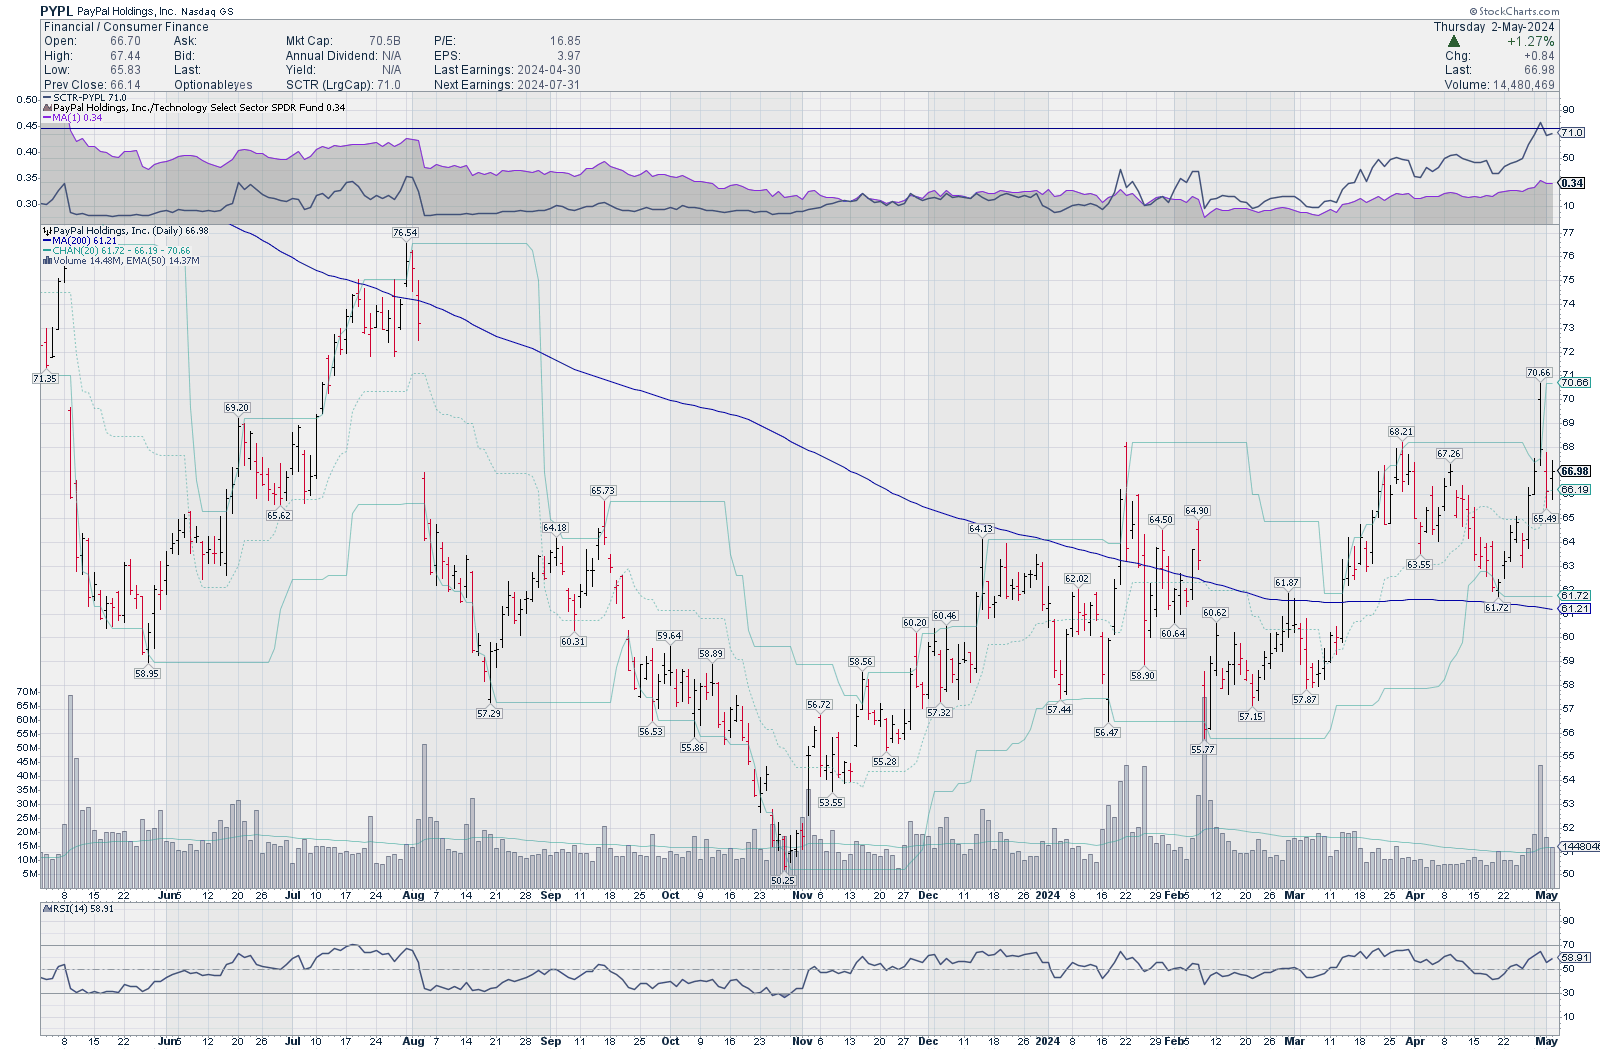
The purple line above the grey area gives us PYPL's relative strength against the Financial SPDR fund (the XLF ETF). PYPL has gained strength here, but some might argue that PYPL is partially a technology company, too. Switching the comparison to XLK (the technology ETF) shows a similar increase in strength:
Institutional trades
Volume Leaders gives us information on big trades made in the markets in certain locations. Although we know the size, time, and price of the trades, we don't know which direction the traders were betting on. They might be going long, going short, taking profits on a long position, or covering a short position.
Let's get a look at PYPL over the past year:
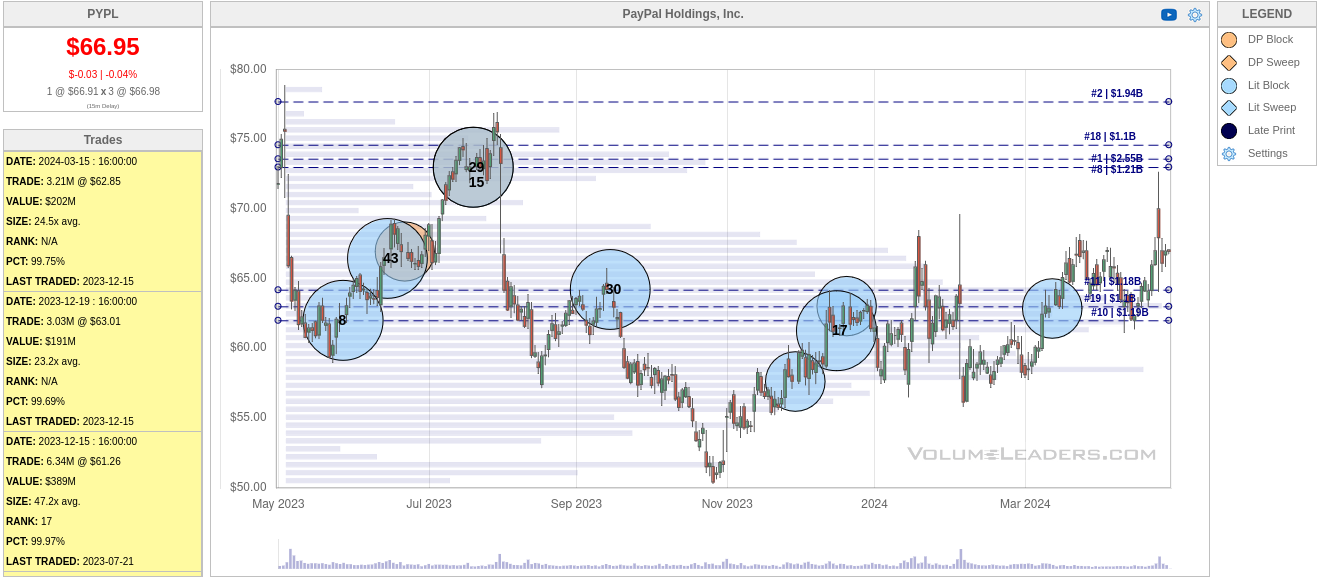
PYPL sits just below $67 this morning. This chart tells me that institutions became bearish around $73-75, but they really are interested in the $60-$65 level. You'll notice that PYPL ran back up to about $71 or so recently and then fell back down once more to the high volume level. The dashed horizontal levels indicate high volume areas and our #1 area sits just under $75.
If we know that PYPL retook the 200MA on March 13, what do the trades look like since that date?
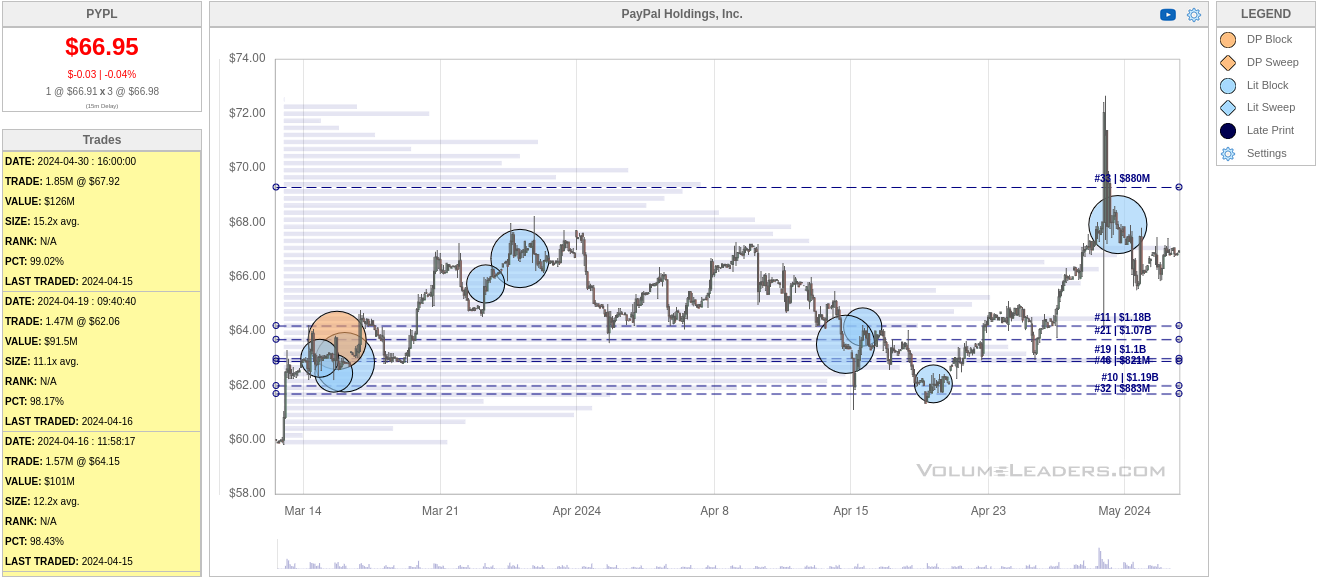
There's plenty of support around $62-$64, but anything over $70 still looks like a no-go. Note that there are no top 100 trades since March 13th. This tells me that institutional traders aren't making big changes to their holdings lately. Sure, the drop from $72 was abrupt, but the bet from institutions was relatively small and came after the drop happened.
All of this leads me to think that institutions are either waiting for a catalyst or they are quietly making small adjustments to their positions as they await the next move. I love seeing a consolidation zone with lots of institutional trades. That pattern shows up here but not with the level of trading I'd like to see.
Fundamentals
PYPL was recently downgraded by quite a few analysts. With that said, I trust most analysts about as far as I can throw them (that's not far), but we can do a little digging ourselves about PYPL's fundamental strength.
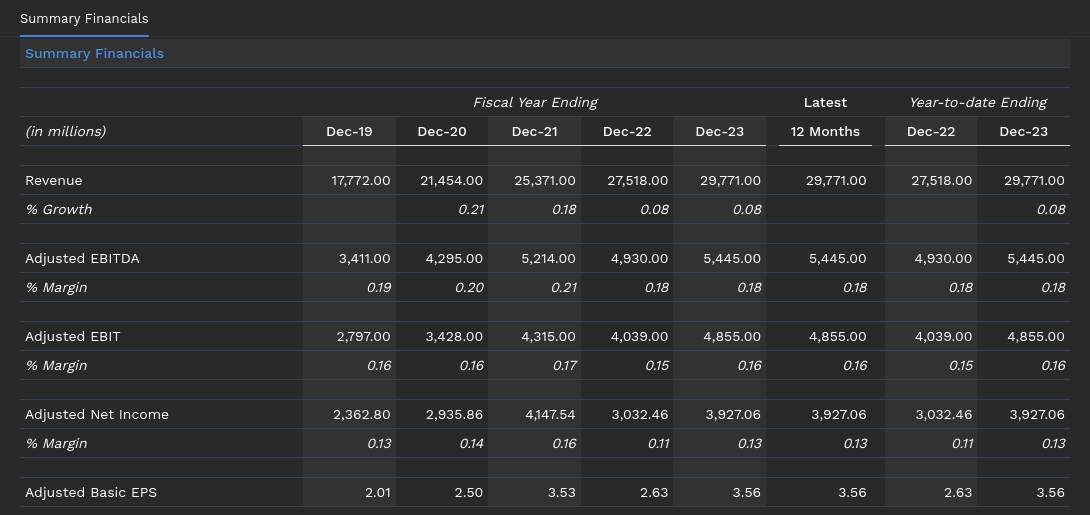
PYPL recently had P/E ratios as high as 47x, but it now sits at 16x for the last 12 months. Earnings reports show that revenue has been increasing by smaller and smaller amounts over the past five years:
Based on the equity waterfall calculations from Finbox, PYPL's implied stock price should be anywhere from about $38 to $58:
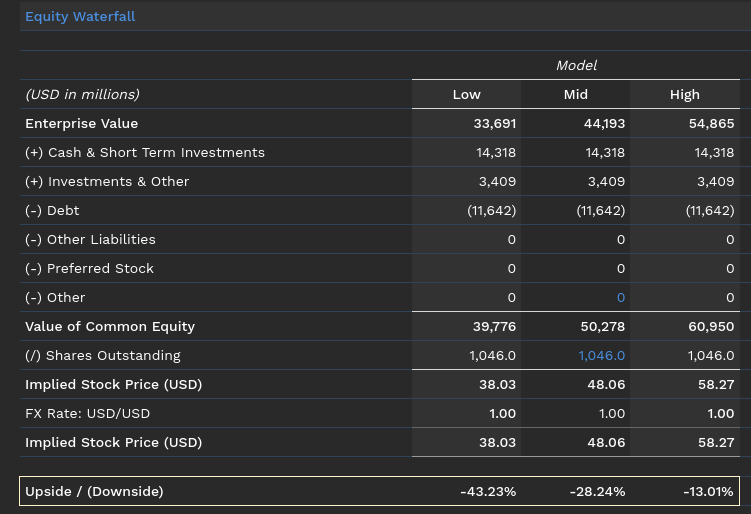
This is a bit worrisome and suggests PYPL is lagging the market on a fundamental basis.
Thesis
Every trader in the market is analyzing various trades with different mindsets. Some might be investing over a number of years while others are looking for minute-by-minute scalps on price moves. Some traders focus heavily on fundamentals while others make decisions based on price and volume.
There's something about PYPL that has traders willing to overlook some financial shortcomings and bet on better future outcomes. As noted in the Volume Leaders charts, they aren't making big bets or adjustments lately. Perhaps they're waiting on some type of catalyst or other earnings reports from companies in the sector.
I did well on some PYPL earnings trades recently, but I don't have any trades on at the moment. I'm eager to see more volume come in to confirm a direction on the chart, or perhaps another retest of the 200MA. Until then, I'll keep an eye on it and consider a short put when volatility creeps up again.
Good luck to everyone out there today! 🍀
Discussion