A look at breadth before CPI

Today's CPI release should be interesting, but let's take a look at market breadth before we get the data. 💪

Another look at the Consumer Price Index (CPI) comes this morning! This could lay out the narrative for lots of rate cuts, a few rate cuts, or perhaps more of the "higher for longer". Let's get a look at breadth today and see where price and volume might be taking us.
All investments come with significant risks, including the loss of all capital. Please do your own research before investing, and never risk more than you are willing to lose. I hold no certifications or registrations with any financial entity.
Here we go!
Institutional volume going into CPI
Yesterday afternoon, I started seeing some weakness in AMD's chart and was suddenly stopped out on my long shares. I closed my short puts there and then Volume Leaders sent me an alert that the biggest trade ever on SPXL was just made prior to the close yesterday:
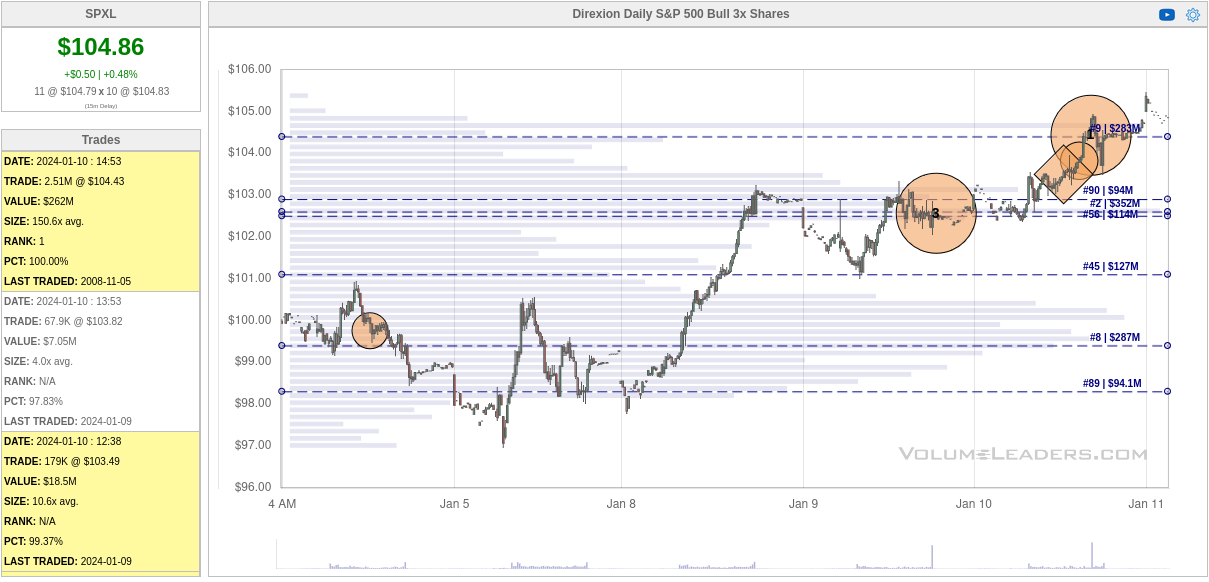
That follows up on a #3 biggest trade on January 9th. Typically, I see institutions quietly trying to establish or get out of a position and then they suddenly drop a massive trade onto the market once they have their bets in place. When I see a #1 trade, I think to myself: "If I worked at a big institution, would I be adding to my long position or taking profits here?"
We're at the highs on weakening breadth (more on that soon), so my assumption is that this #1 SPXL trade is likely a sell before CPI. I could be wrong, but that's my current assumption. 🧠
SPXL is a 3x bullish leveraged ETF for the SPX index. If the SPX moves 1%, I'd expect to see SPXL moving close to 3%. Remember that those fast moves go in both directions. 😉
What happens if we take a look at SPY since January 1, 2023? Can we see where the largest trades are being made and get more confirmation for our assumptions?
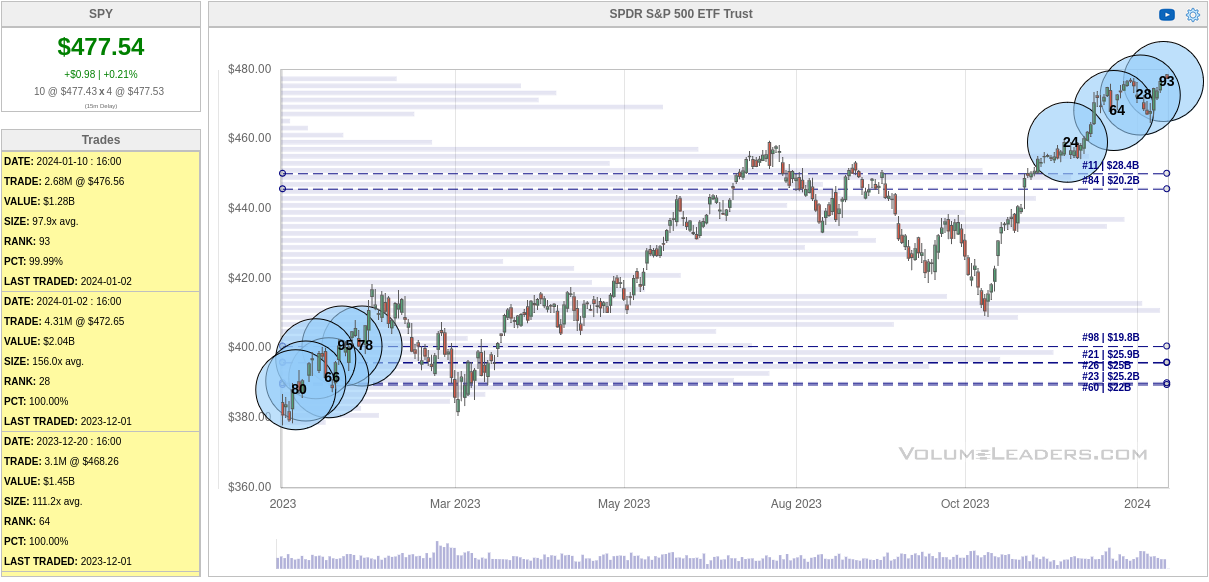
In the chart above, I plotted SPY's 10 largest trades since January 1, 2023. There was a flurry of trading early last year at the lows below $400 and we see another flurry of trading very recently after SPY climbed over $450.
The middle of the chart is quiet, but there are trades there. Those trades are much smaller than the ones at either end of the chart.
So now I have to sit back and think about what institutions are doing here. In early 2023, they bought into strength as we came out of the 2022 slump. In 2024, as we approach an all time high for SPY, would institutions still be buying into strength here? They didn't do it when SPY reached $460 in July of 2023. They didn't get back into the market substantially after the October lows, either.
These recent trades look like exits to me.
Let's go one step further and look at TLT. That's the 20 year Treasury bond ETF. Remember that when the price of the ETF rises, that means Treasury yields are coming down. When the price drops, yields are going up. (Bonds require you to think backwards.)
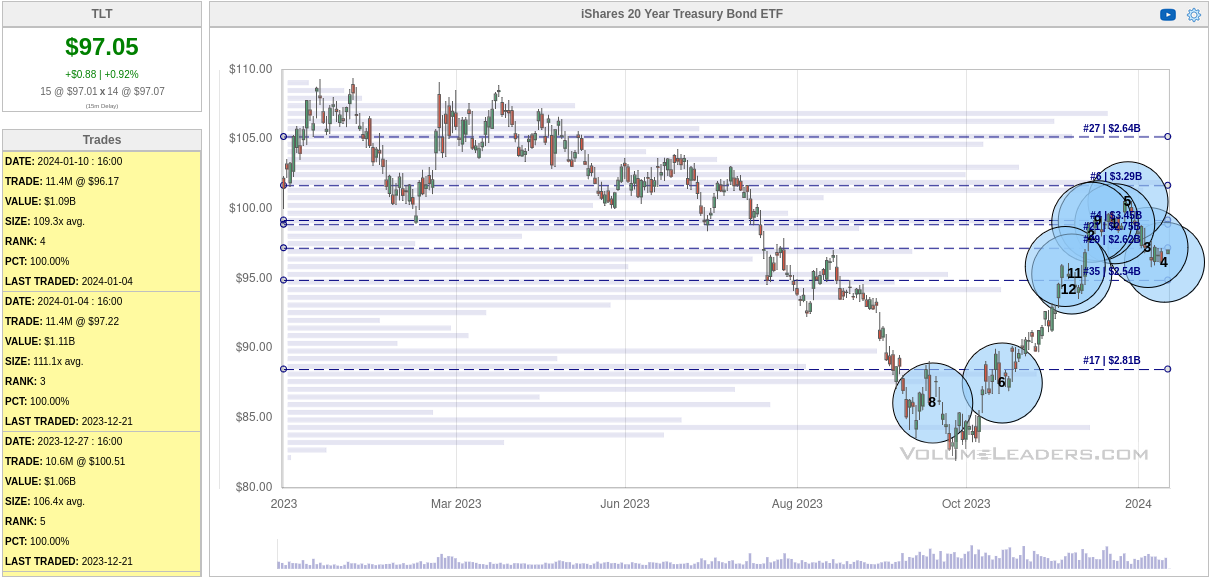
For most of 2023, yields crept up as TLT came down. Perhaps this was because the market anticipated that rates would not be raised again or might be cut. However, the price made a turn towards the end of the year and institutions made trades into that strength.
Look what happened very recently in the chart. Eight of the top ten trades came in after December 6th. If institutions are taking profits here or going short, then they're anticipating a rise in bond yields or perhaps they expect the Fed to keep yields "higher for longer".
Many of the trades on the right side of the chart are the biggest trades that TLT has ever had, including almost all of the top ten biggest trades. That's a lot of money moving through TLT.
A look at breadth
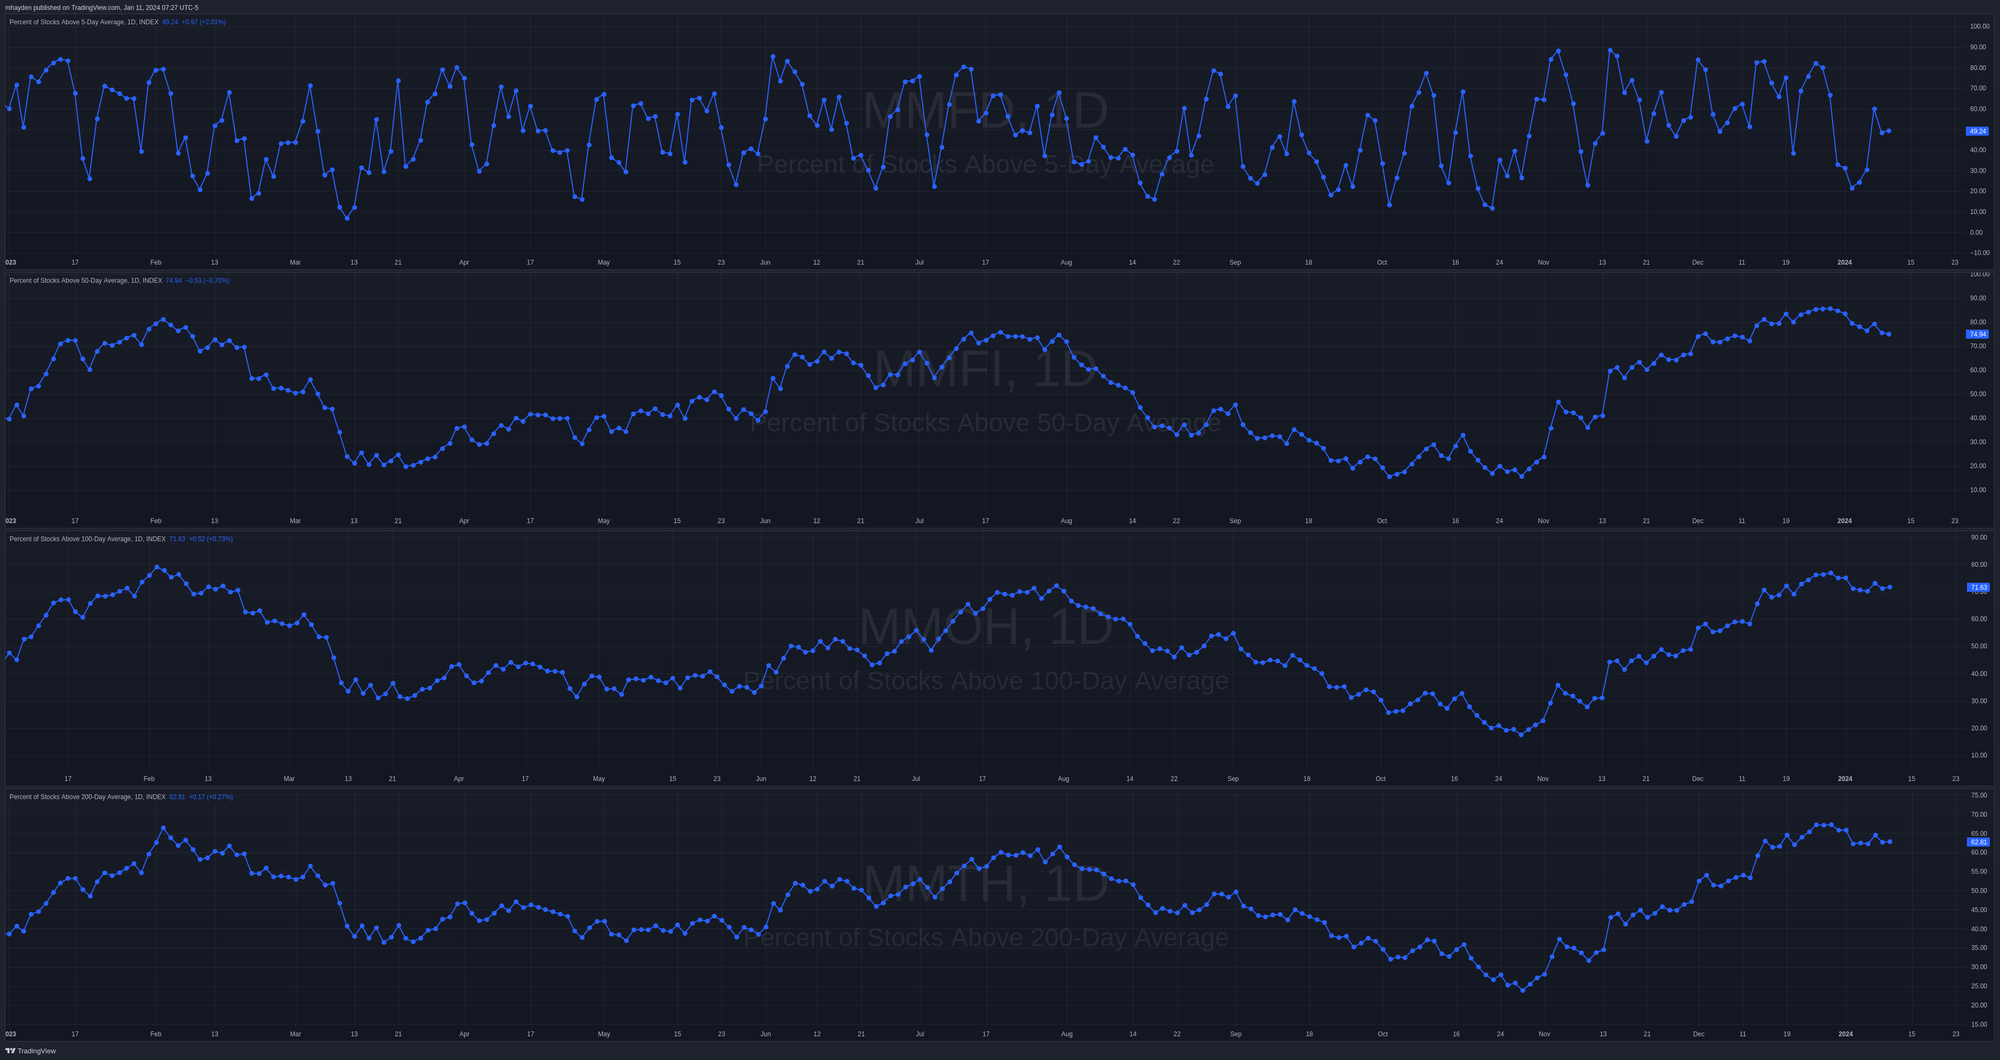
The chart below has four lines on it. From the top, it shows the total percentage of stocks above their 5, 50, 100, and 200 day moving averages. The 5-day chart on top made a lower high recently and sits just under 50% right now. That means that of all the stocks in the market, about half are under their 5MA and half are not.
Moving down the chart, 75% are above their 50MA, 72% over their 100MA, and 63% over their 200MA. Seeing these numbers over 50% is certainly reassuring since it suggests that we're in the midst of a sustained rally. However, these last three charts hint at some stagnation across the broad market.
Another interesting way to examine breadth is by comparing SPY to RSP. As a reminder, RSP is an ETF that tracks the SPX index but every equity inside it is equally weighted. SPY weights stocks differently based on their market cap. So while a huge stock like MSFT can move SPY around a lot since it's heavily weighted, it gets the same weight as the other 499 stocks in RSP.
This chart compares SPY to RSP. If you see the chart moving up, it means SPY is gaining strength over RSP. This suggests that SPY's most heavily weighted companies (the big ones) are moving much more than the remaining companies in the SPX index.
There was a bull flag earlier last year that led to a peak in this relationship around November 13th. What happened then? The biggest stocks in SPY rallied like crazy into the end of the year but the rest of the SPX stocks didn't really get into the party.
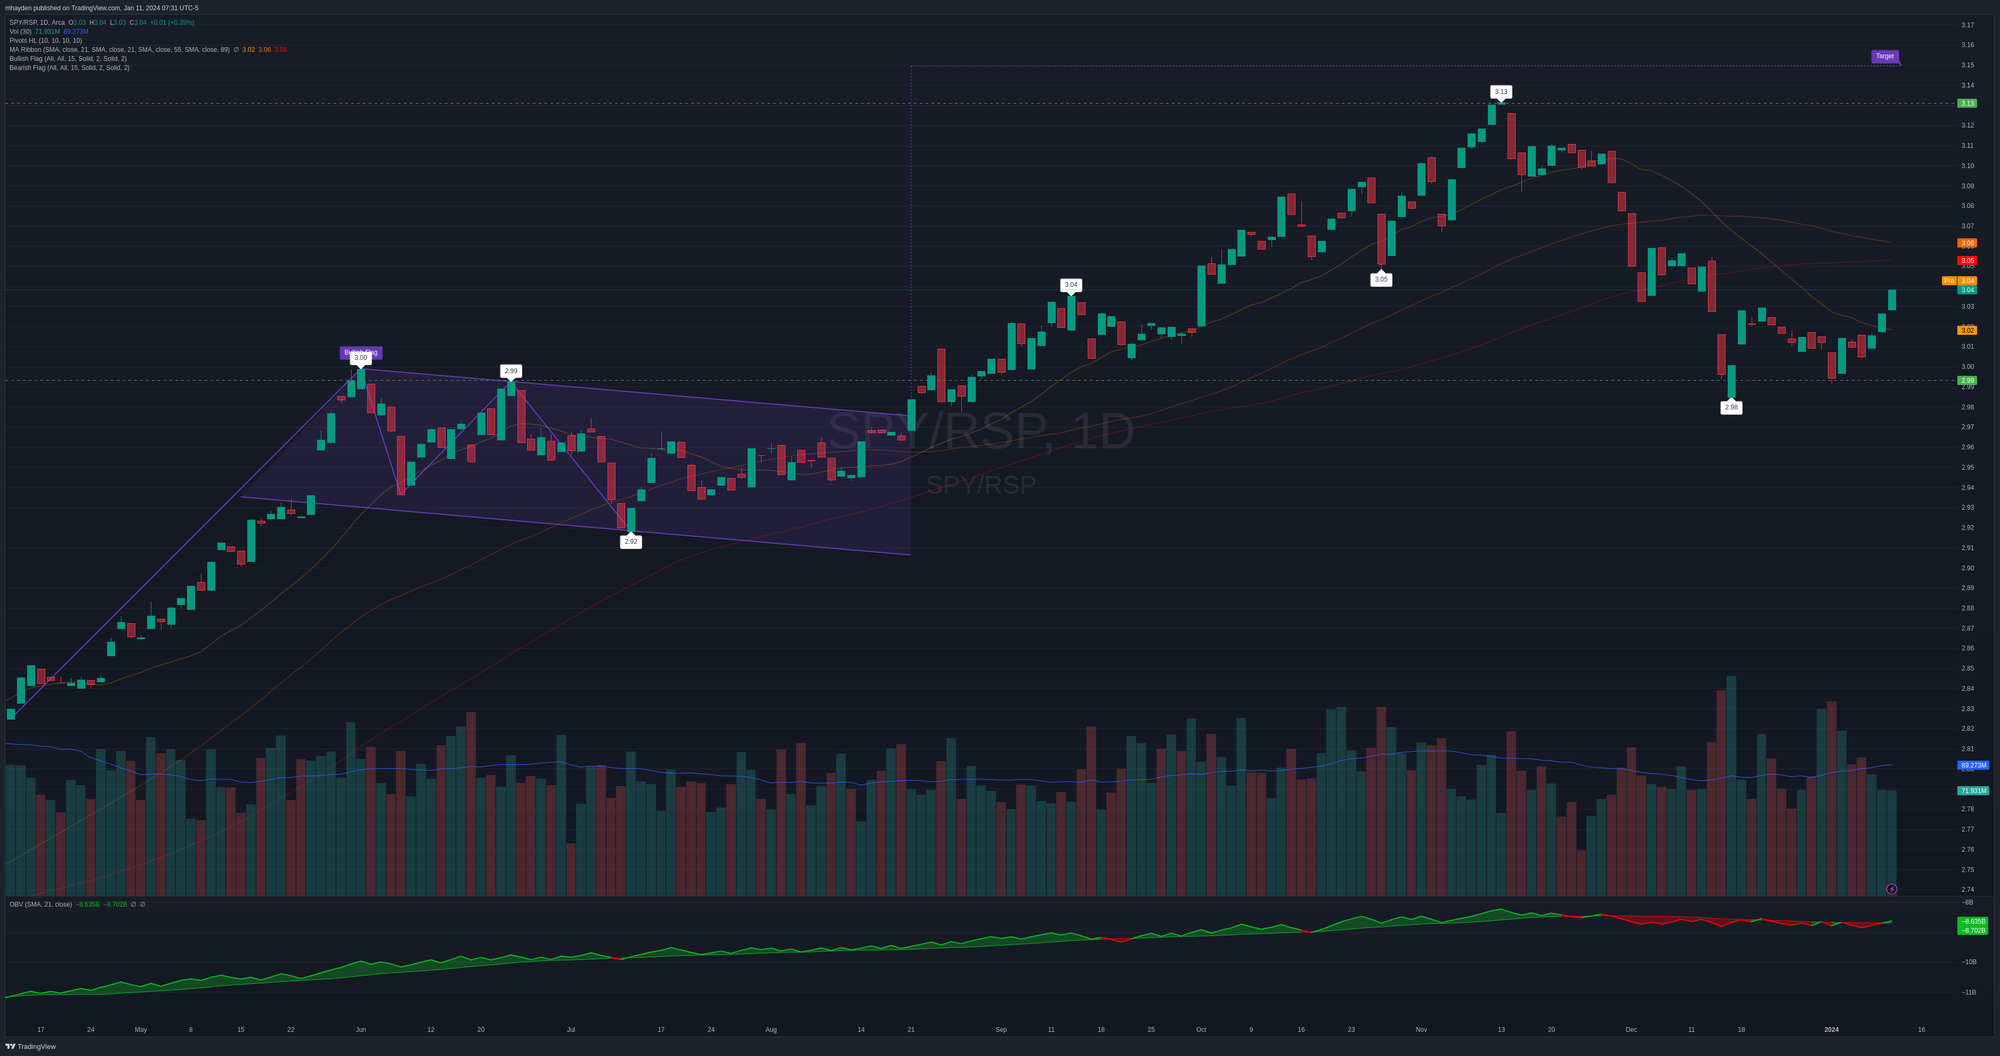
What is the chart doing now? After SPX's biggest names rallied, breadth suffered. December 15th was a low in this relationship and signaled a breadth improvement. However, that has turned again and now SPY is outpacing RSP once more.
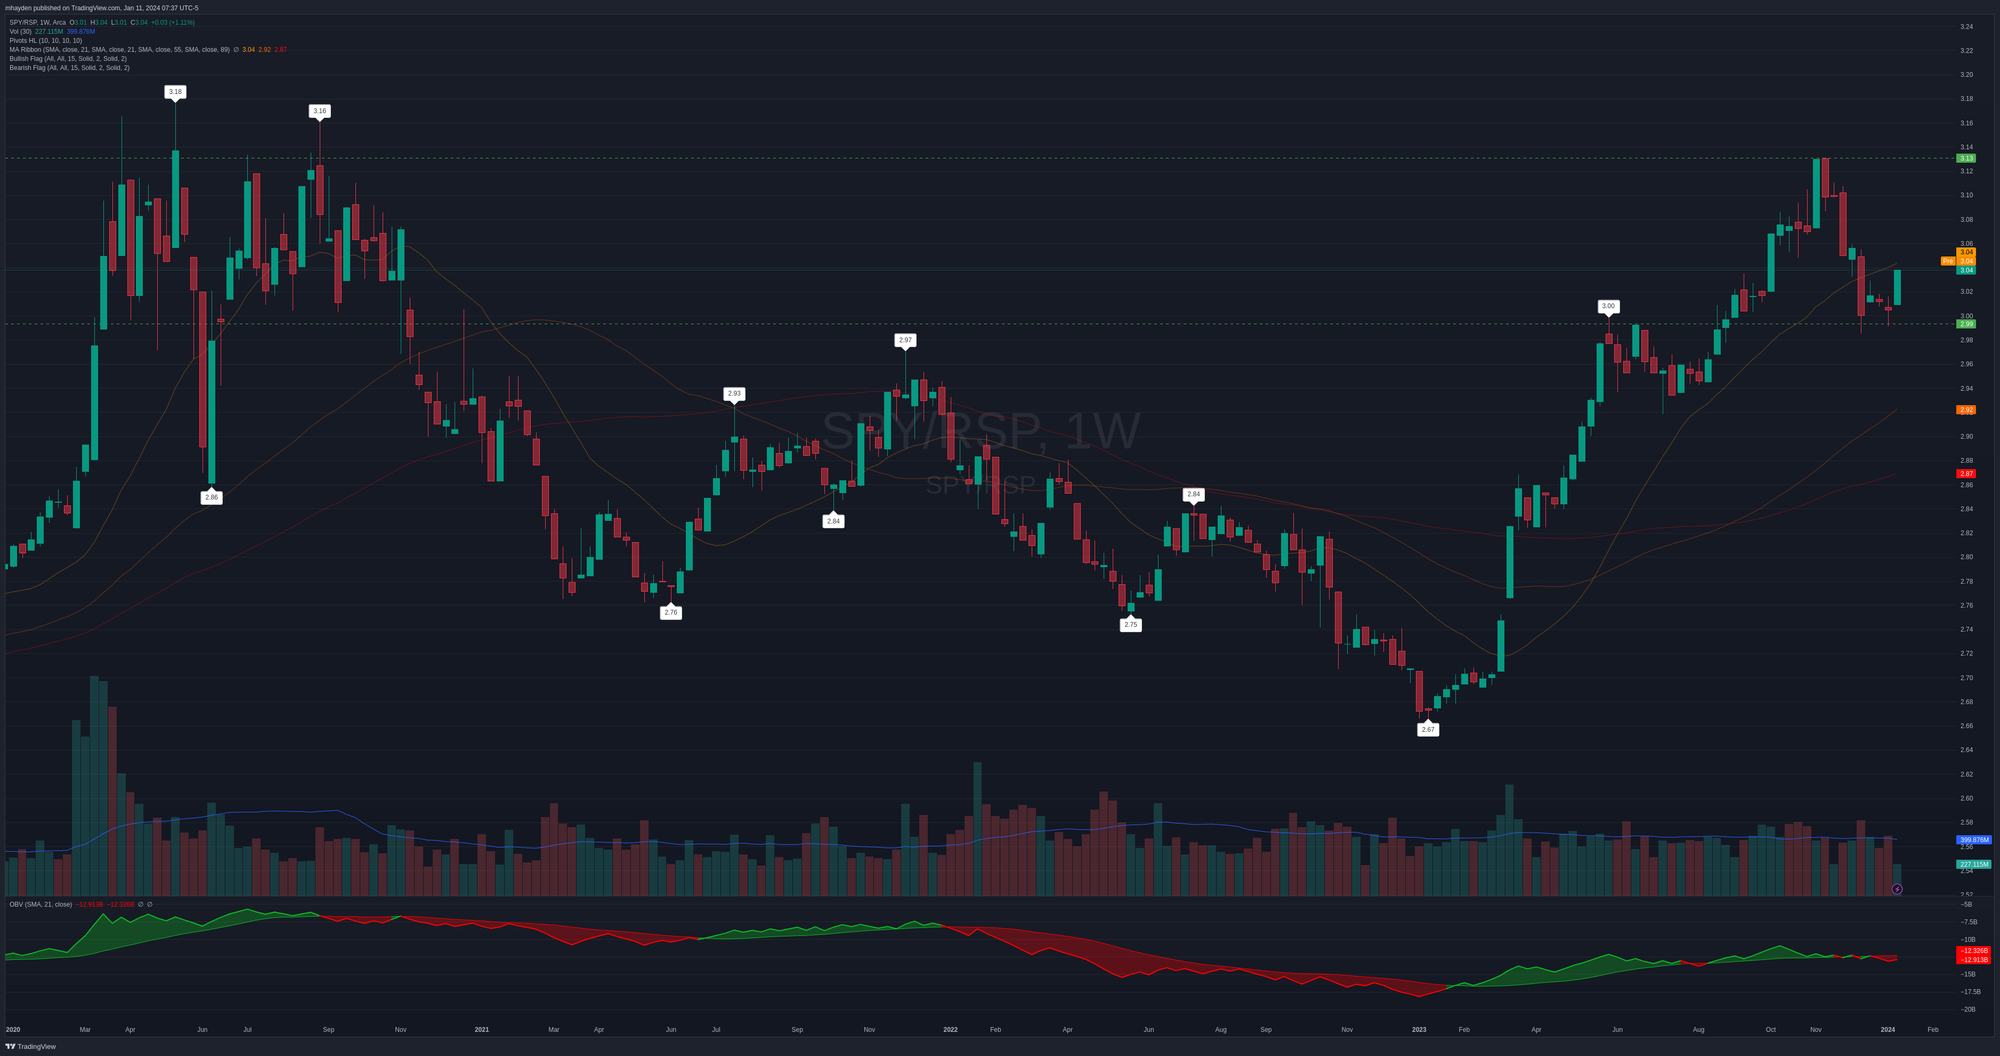
How has this relationship evolved over time? The following chart shows a weekly SPY/RSP chart since COVID. We've run up to this 3-3.2x level once before during the months after COVID and we're approaching that level again now. High levels on this chart indicate that SPY is very extended and low levels suggest that breadth is stronger across all of SPX.
Thesis
I'm eager to see this morning's CPI data and watch the market digest it. Making a trading plan right now before seeing the data (and the response) seems a bit foolish to me, but I know some traders who love to play big news like this. I'm happy to watch from the sidelines and make my move once I know where the market wants to go.
Breadth was doing better recently, but it's not as strong lately. I'd like to see that improve to support more bullish trades.
As I mentioned earlier, I closed out most of my long delta trades yesterday, but I have some small ones still on the board this morning. My long put hedges for later this year keep floating around +10% and -10%. I don't have any plans for those right now.
Good luck today! 🍀
Discussion