Broad market analysis for August 24

NVDA's pre-earnings volume has skewed a lot of data for this morning, so I'll take a look at the broader market today. 🔭

NVDA's earnings yesterday pushed it over $500 in the after hours market and it seems like there's excitement in the market again. I still remain a little skeptical. The AI hype can giveth and it can also taketh away. 🤔
On the flip side, DLTR (Dollar Tree) was hit with a 8.5% loss (at time of writing) after earnings. That surprised me as it seemed to do well with consumers as inflation set in.
NVDA's earnings has skewed options data for most of the tickers I care about, so let's get a broader view of the market today. But first:
All investments come with significant risks, including the loss of all capital. Please do your own research before investing, and never risk more than you are willing to lose. I hold no certifications or registrations with any financial entity.
Happy Thursday! 🌄
Macro view
I've been going on and on about the cost of automobiles and shelter being far too high. Auto reposessions are on the rise and the difference lately is that many auction houses are seeing a flood of cars from big national lenders, such as Wells Fargo and Capital One, instead of the usual repos from "buy here pay here" dealerships.
What does this mean? These large banks do a lot of due diligence before issuing loans and it's surprising to see the volume of their loans turning into repos. However, if you owe the bank $60K on a car that is now worth $30K, what makes more financial sense?
- Pay down the loan aggressively to save your credit and keep the car, knowing that it's throwing money into the garbage
- Walk away from the loan, take a hit on your credit, and save some money
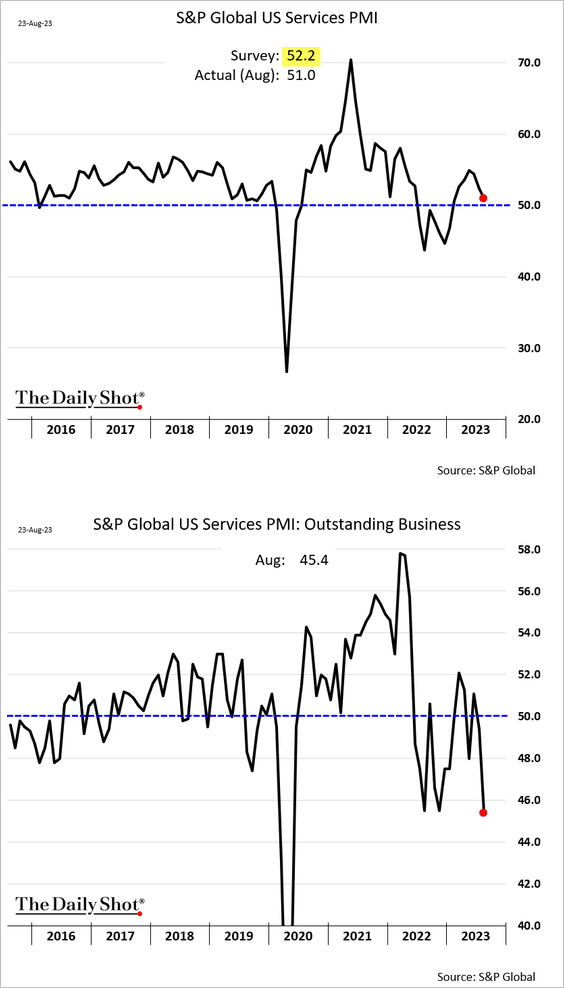
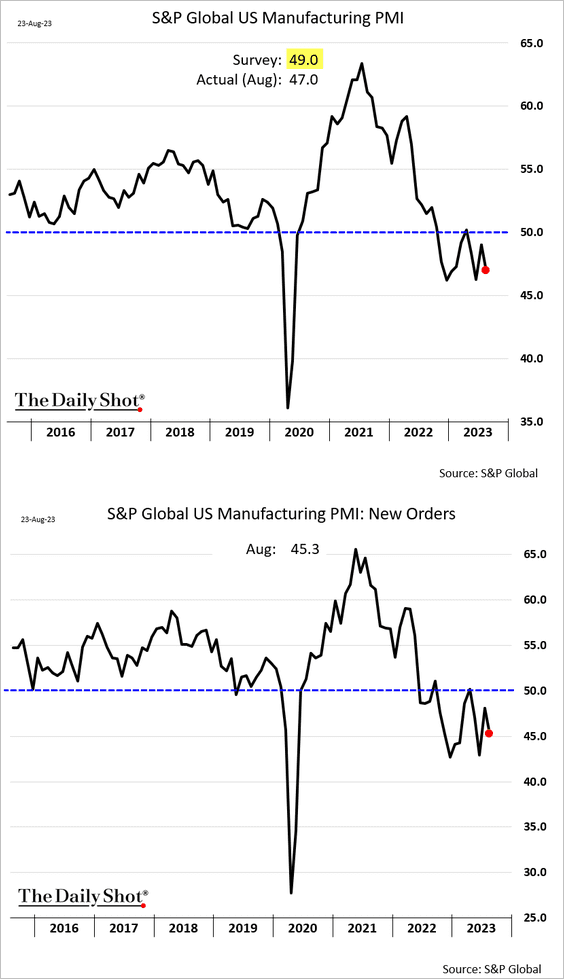
Services and manufacturing growth are both lagging, and so is customer demand:
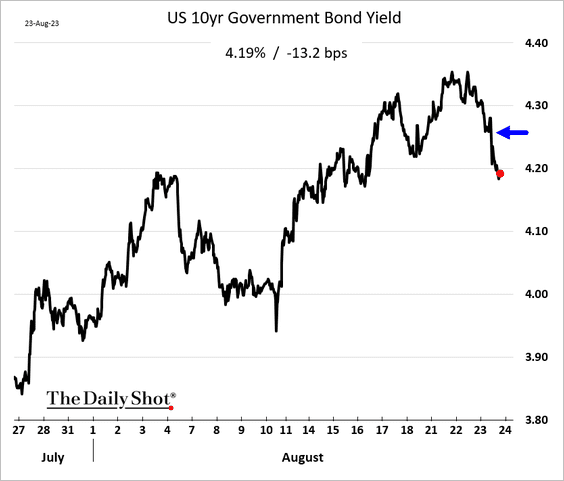
That led to a drop in Treasury yields which added fuel to the stock market:
Home prices are wild:
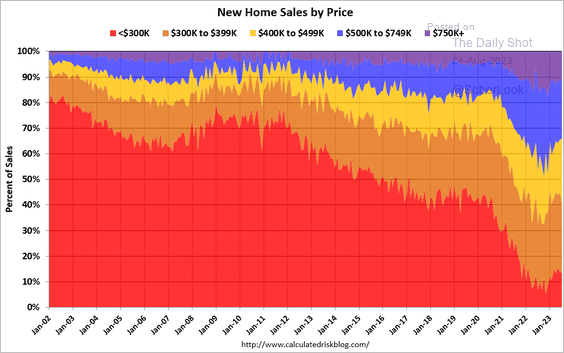
Sky-high home prices with fewer housing starts (new houses being built) are crunching family finances across the country. Automobiles remain expensive, banks are tightening borrowing requirements, and existing auto loans are well above the value of the cars associated with them. All of this leads to reduced customer demand and raises the chances of a recession.
Volatility
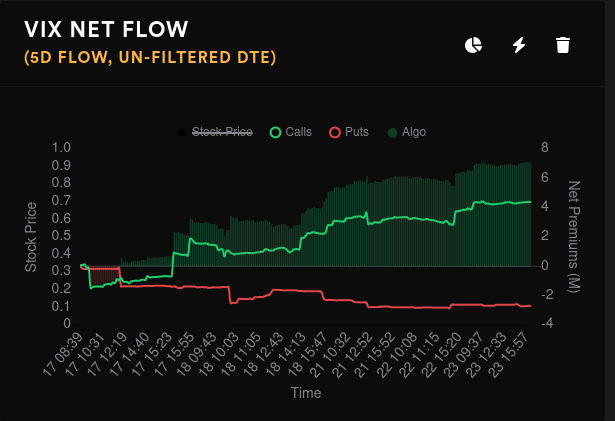
The VIX has seen more and more bullish bets over the last four days and yesterday's flow turned bullish in the late afternoon. I'm interested to see how (or if) this changes after NVDA's earnings.
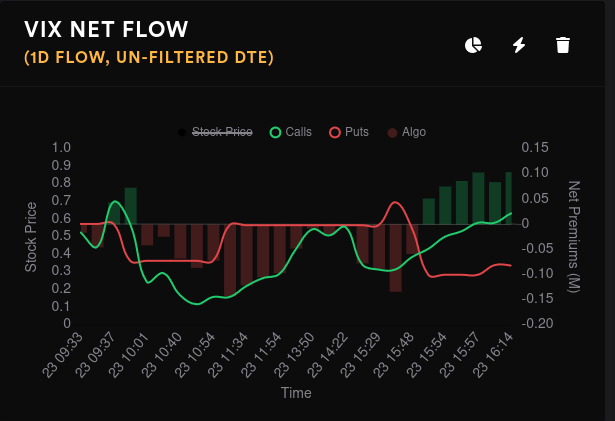
Increasing volatility increases deltas on options contracts. Your 0.30 delta call might suddenly become 0.35 delta. If you're long on that option, you'll see the value increase, which is great! Options sellers will find this frustrating.
If you like to trade with a bullish bias among increasing implied volatility, look for tickers with negative vanna.
Breadth
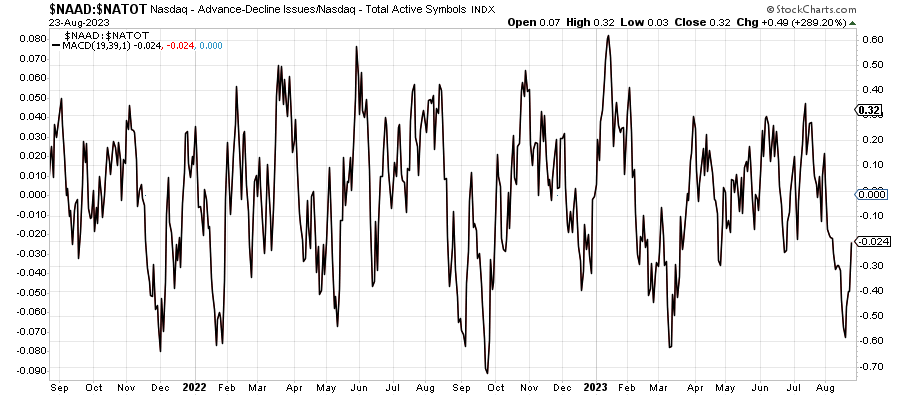
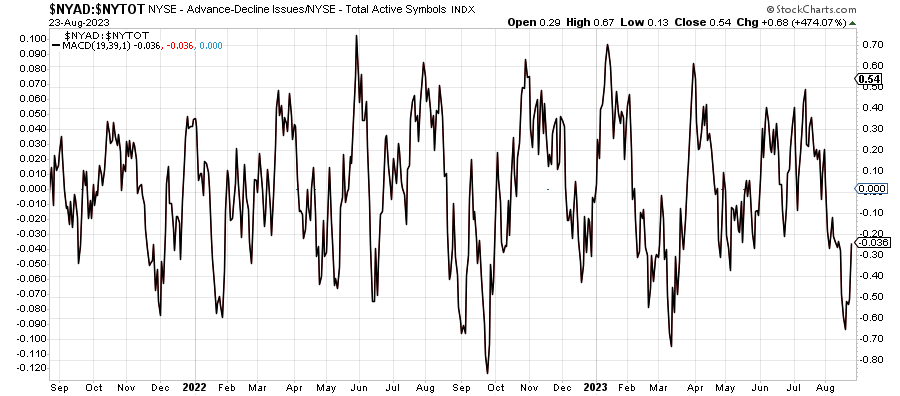
Looking at total advancers and decliners across NASDAQ and NYSE, it's clear that we just went through a big drop and we're moving back towards the mean.
SPX has an RSI of 47%, which is right in the middle. SPXEW (where all stocks are equally weighted) comes in with an RSI of 38%. It's clear that the big stocks represented in SPX are the strength behind the market yet again.
34% of stocks sit above their 50 day moving average and 50% are above their 200 MA. The number over the 50MA has made a higher high and higher low recently. The 200MA chart is similar.
We last saw an extreme of 97% on the stocks over 200MA back in April 2021 and a 2% back in March of 2020.
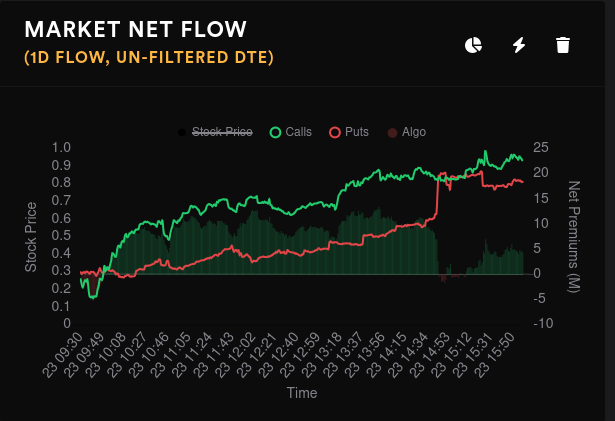
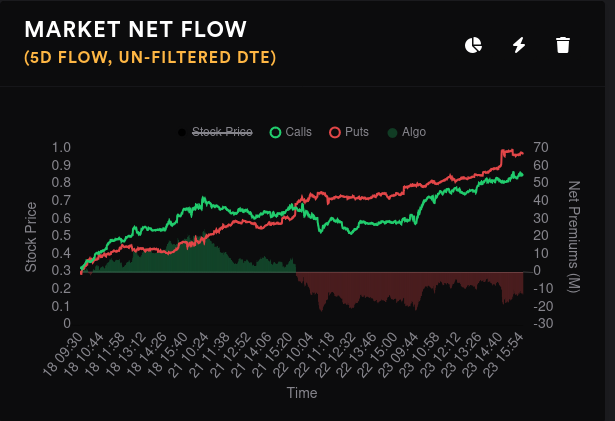
Options flow and vanna
Overall net flow in the market increased into a frenzy recently with NVDA's earnings, the Fed's Jackson Hole meetings, and lots of indecision over a future interest rate hike.
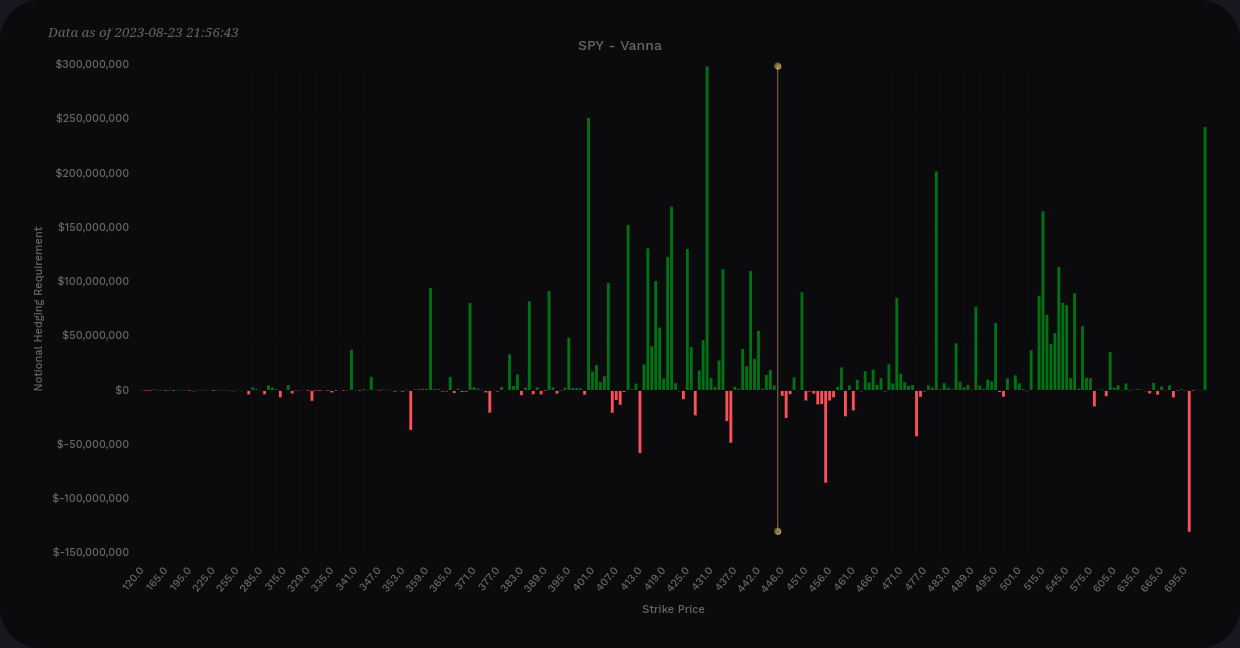
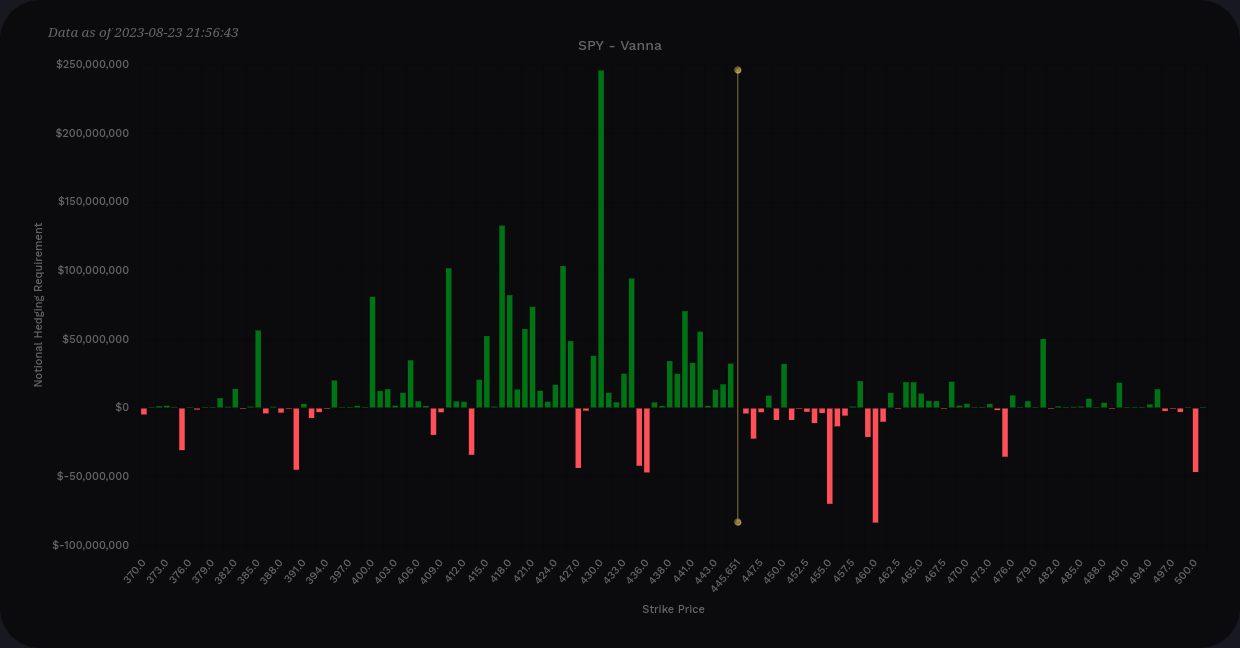
SPX has a very positive vanna chart at the moment with a small range of negative vanna just above the current price. This could briefly give us some upward pressure on price if IV continues to expand, but this chart looks bearish to me if IV continues expanding aggressively.
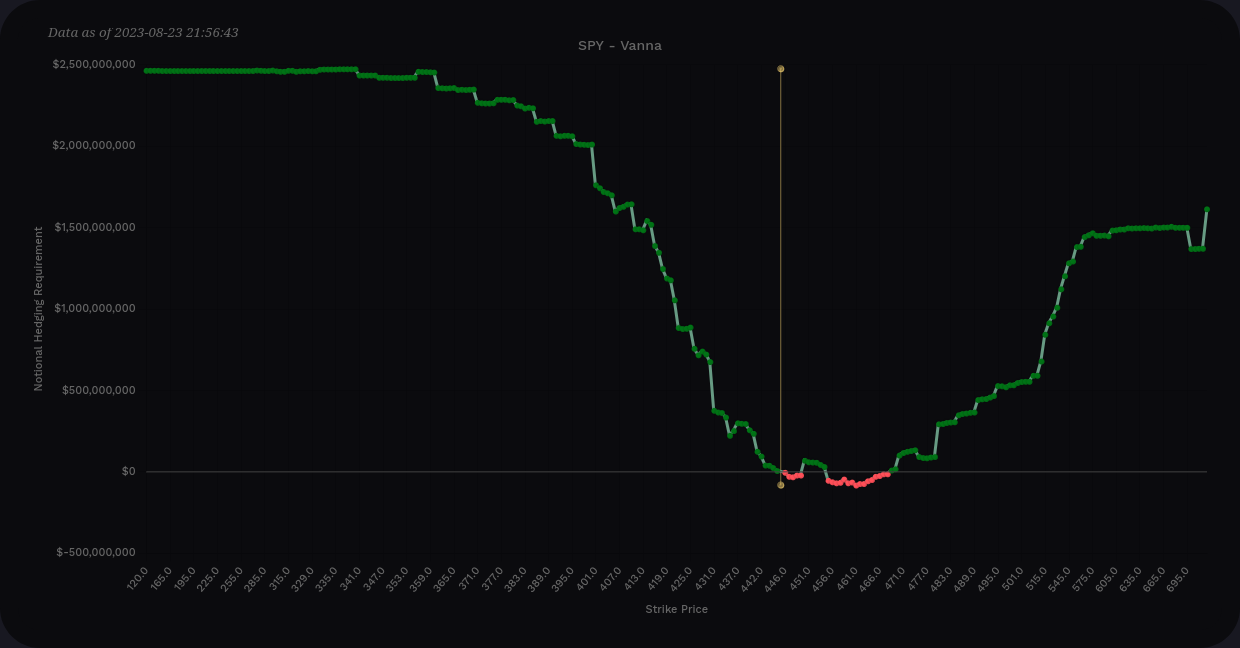
Considering vanna now through 9/15, much of the vanna above the current price disappears:
Gamma exposure
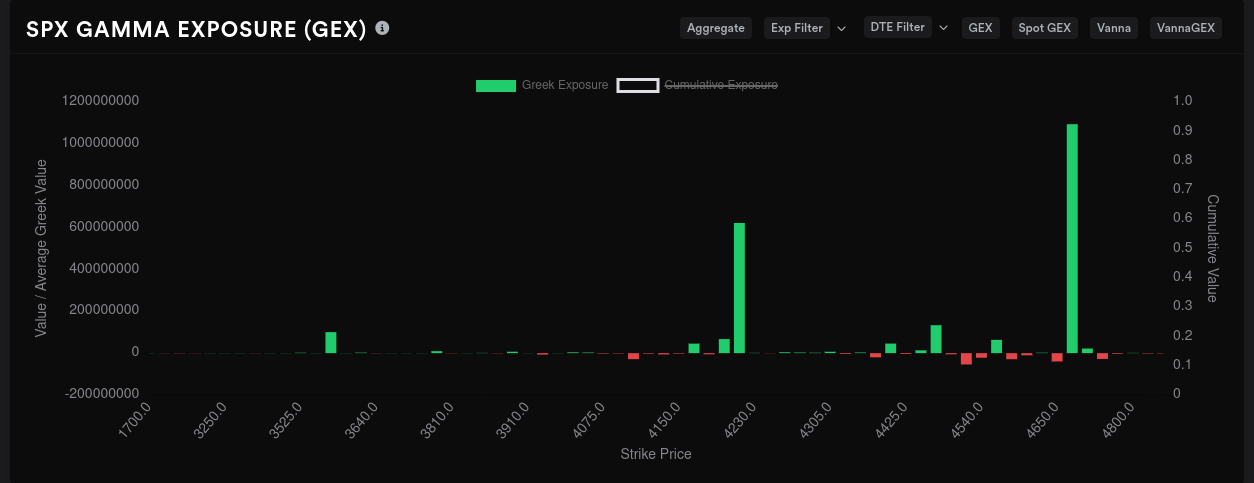
Does GEX correlate some of this data? 9/29 looks like the hottest GEX expiry right now followed by 9/15:

Let's look at the aggregate GEX first. 4350 is the largest magnet for price by far and we're pinned in by 4325 and 4400. There's more support on the downside at 4215, but we fall off quickly after that.

How about 9/15? Well, our 4325/4400 boundaries are back, but the biggest price magnet fell to 4250. 4300 is also fairly negative, but it's half the size of 4250. This seems a bit bearish to me since SPY is over $445 in the pre-market today.
However, there's a good chance that the 4400 could repel a move to the downside and we would bounce right back up.

Moving out to 9/29, where did the negative GEX go? 👀
The pins spread out to 4215 and 4670. That's a wide spread there. There's no clear price magnets on this chart that I can find.
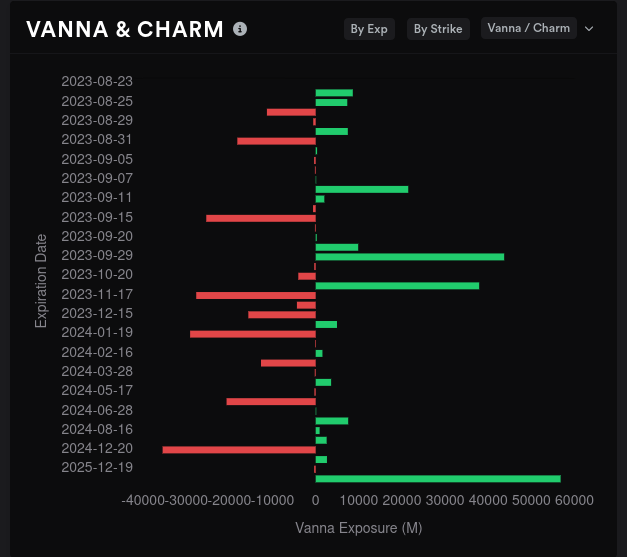
SPX has negative charm for 9/15 and 9/29 flips to positive charm. Expanding IV would be bullish for 9/15 and bearish for 9/29. 9/15 shows up as a bullish expiry.
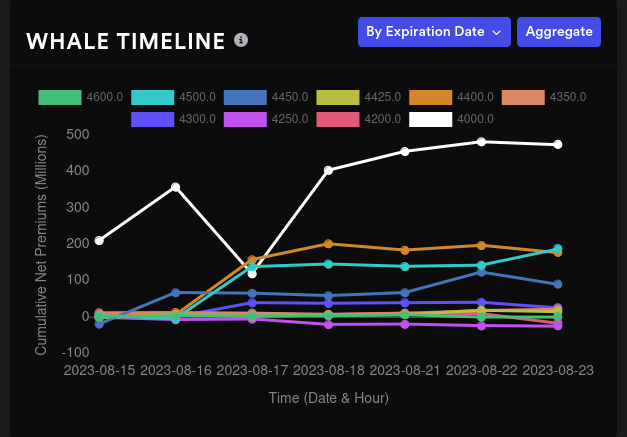
What are whales doing with options trades on these expration dates? Here's a look at 9/15 first and then 9/29. 9/15 shows a big bullish move up for 4000 and 4500 is trending more bullish. 9/29 shows bearish bets on 4000 and 4375:
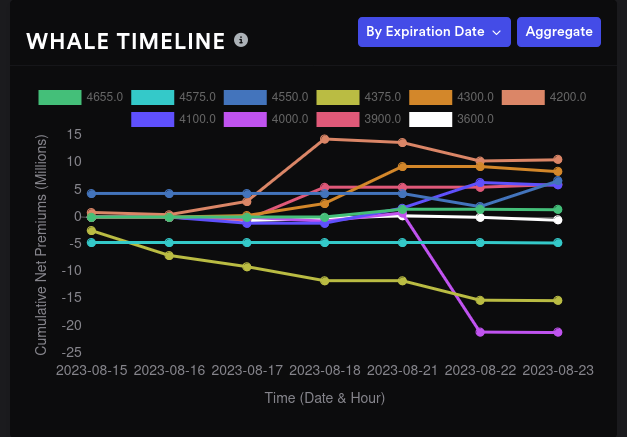
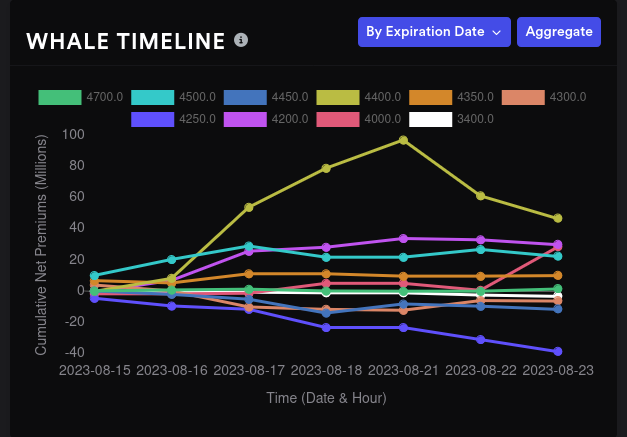
Looking out a bit further, 10/20 shows a bullish bet on 4400 that is getting pulled back. 4250 is trending bearish there.
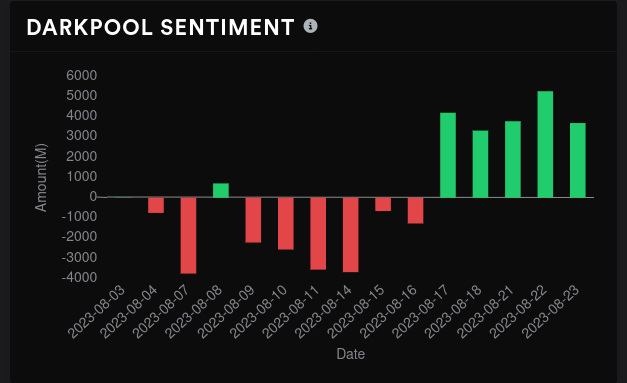
Dark pool data
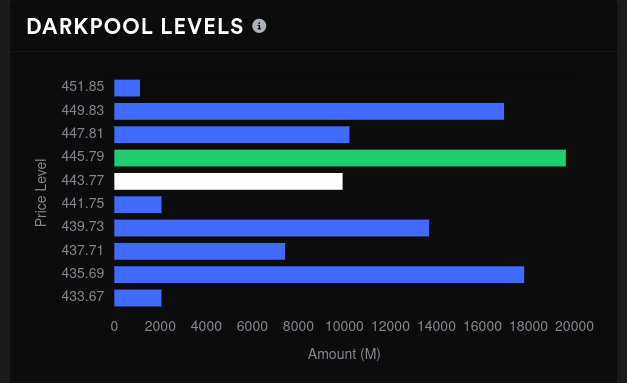
We can examine SPY's dark pool trades for correlation. There was a big delayed buy around $438.10 yesterday that showed up in Tradytics.
Although sentiment is positive for SPY right now, it decreased a bit yesterday. Our biggest level is around $446 with a secondary level around $436. The big level around $450 could serve as resistance or become a base for a higher move. Based on the data we saw on SPX, I'm thinking this might be a resistance zone temporarily.
Thesis
The market feels irrational to me right now, but markets can stay in this pattern for a good while. Breadth suggests we're coming out of a low spot and we're stuck in the middle for the next move.
As for me, I've moved a bit more money into short term treasuries (SGOV) and I'm looking to exit most of my long positions by getting assigned on covered calls for 9/15. I'm usually pretty terrible about staying in the market too long when I see red flags and I'd like to avoid making that mistake again.
There's a lot of chop right now, so give yourself a little extra time if you're trading options and be sure to examine the sizes of your bets. Good luck to all of you! 🍀
Discussion