Broad market look before NVDA earnings tomorrow

NVDA earnings are coming! Market liquidity is drying up as everyone awaits the results. Let's dig into some charts of the broad market to see what's happening today. 📊

Happy Tuesday! 👋 NVDA's earnings are tomorrow after the closing bell and it seems like the whole market is waiting on the edge of its seat for the results. Liquidity seems to be down across nearly every ticker and ETF that I examine.
All investments come with significant risks, including the loss of all capital. Please do your own research before investing, and never risk more than you are willing to lose. I hold no certifications or registrations with any financial entity.
Let's dig into some data and see what we can learn.
SPY
The S&P 500 index came out of the recent market bottom with a fury, but there are several things to notice:
- This current recovery has failed to make a new high and each day presses higher only a small amount.
- A gap was left behind around $547 that might be filled before a move higher is made.
- The highest volume area is near where SPY sits right now (~ $560).
- Since the gap, we have an attempt as a three white soldiers candlestick formation (bullish) followed by a doji, hanging man, and a harami. The candlesticks themselves are screaming out a warning that there's no firm control of the market right now.
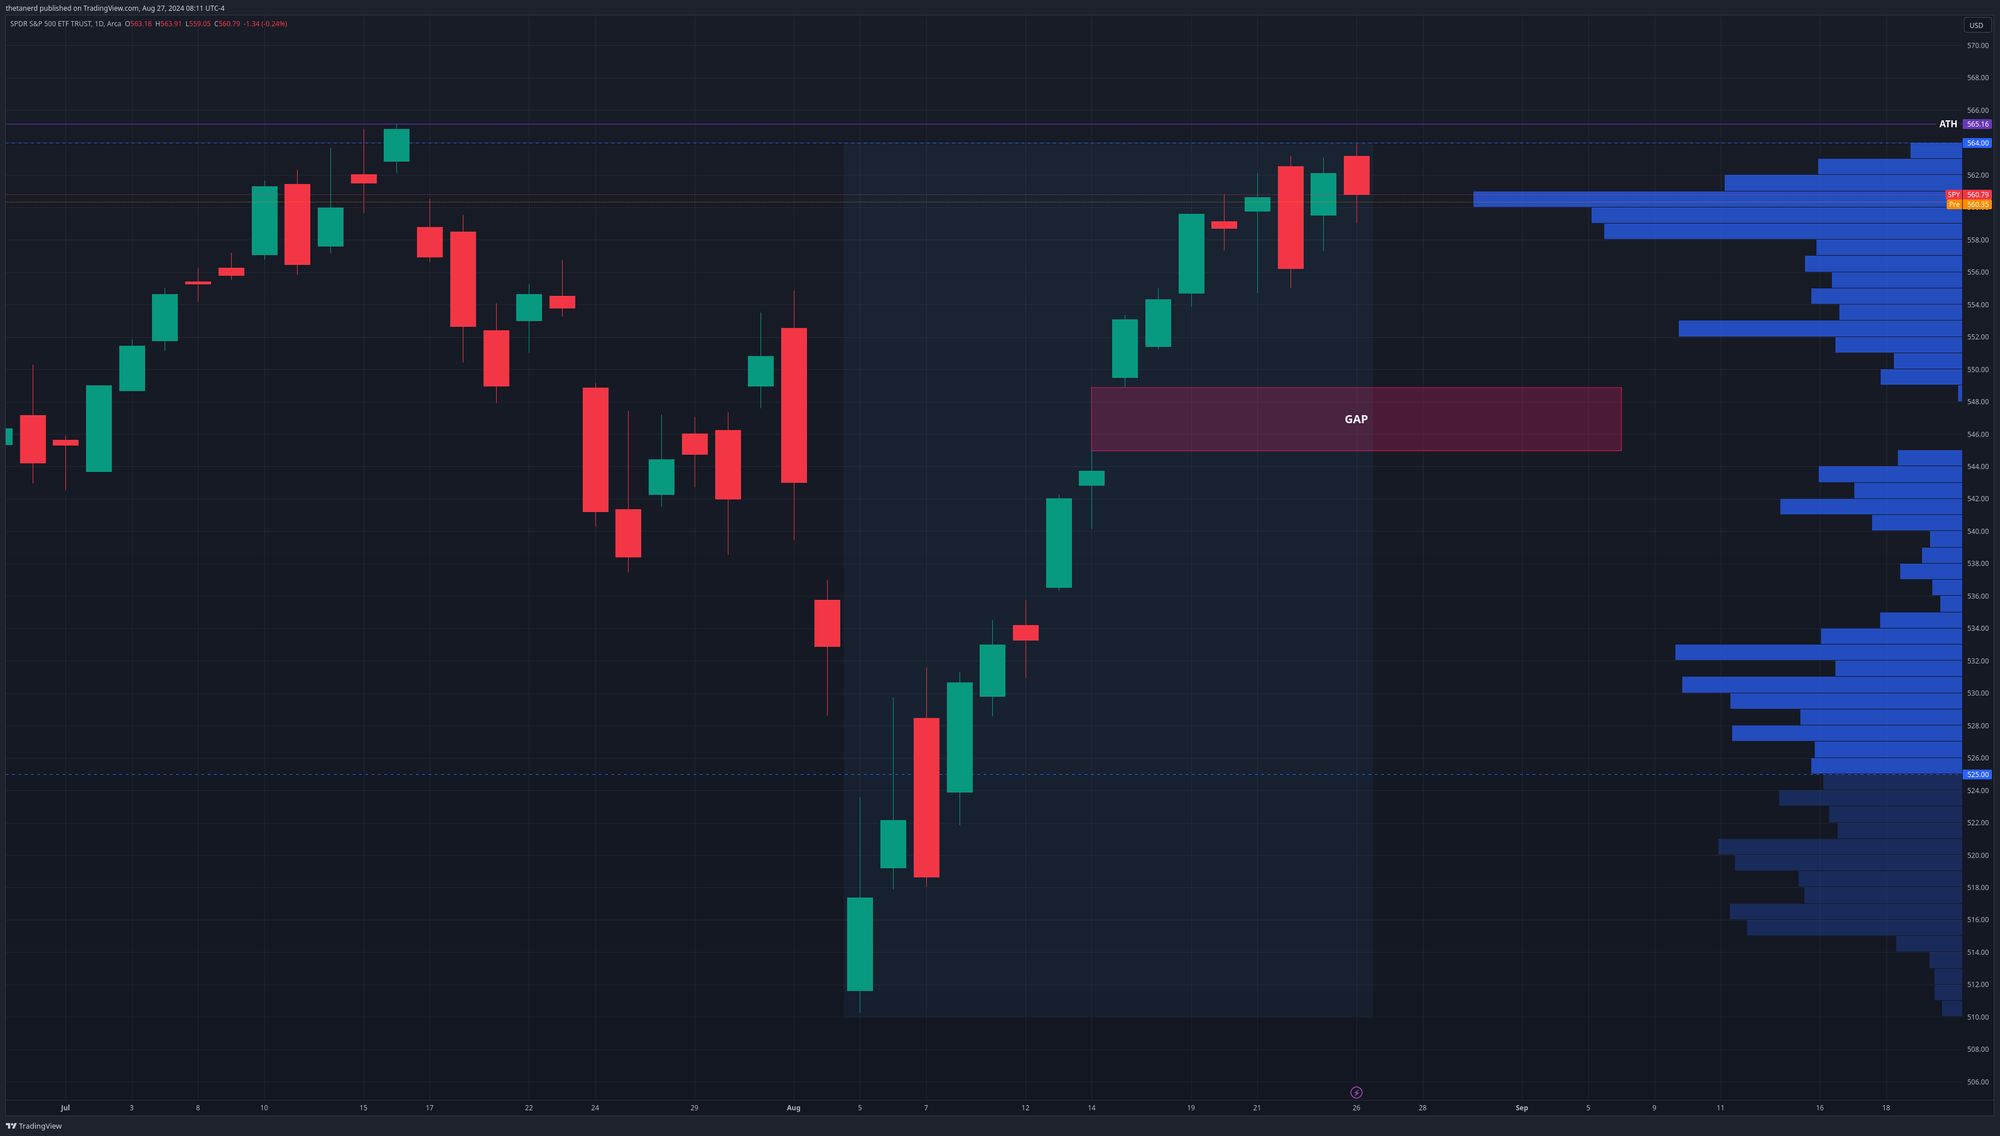
SPY would need to crack the current all time high of $565.16 with some decent volume before I could get behind it in a bullish trade. However, we can throw more warnings onto the pile when we examine a few indicators, including the VPCI and RSI:
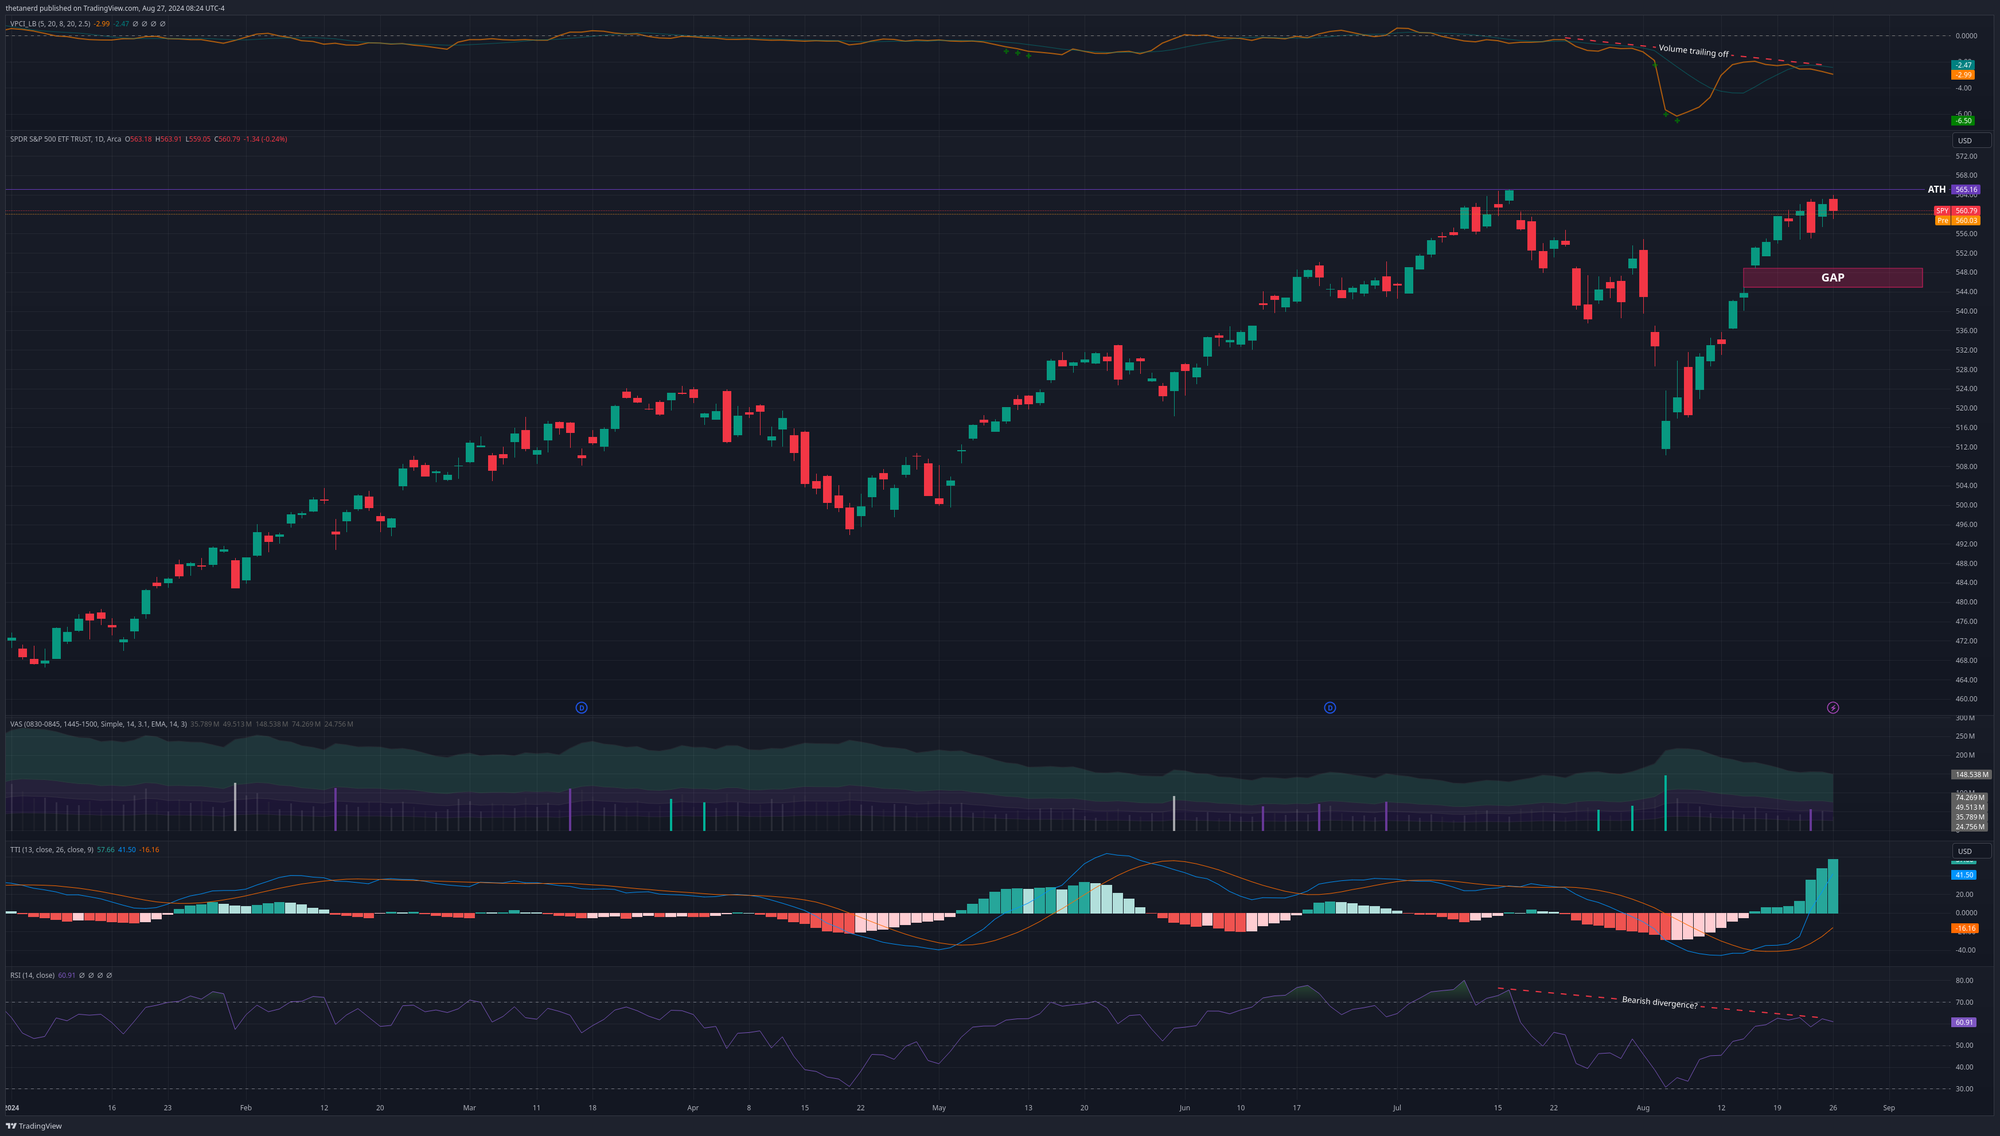
Both the VPCI and RSI are showing a bearish divergence as we attempt to make a new high. If SPY was moving up with conviction and strength, I'd expect to see the VPCI at zero or above. I'd also expect to see the RSI making an equal or higher high.
I'm not seeing either.
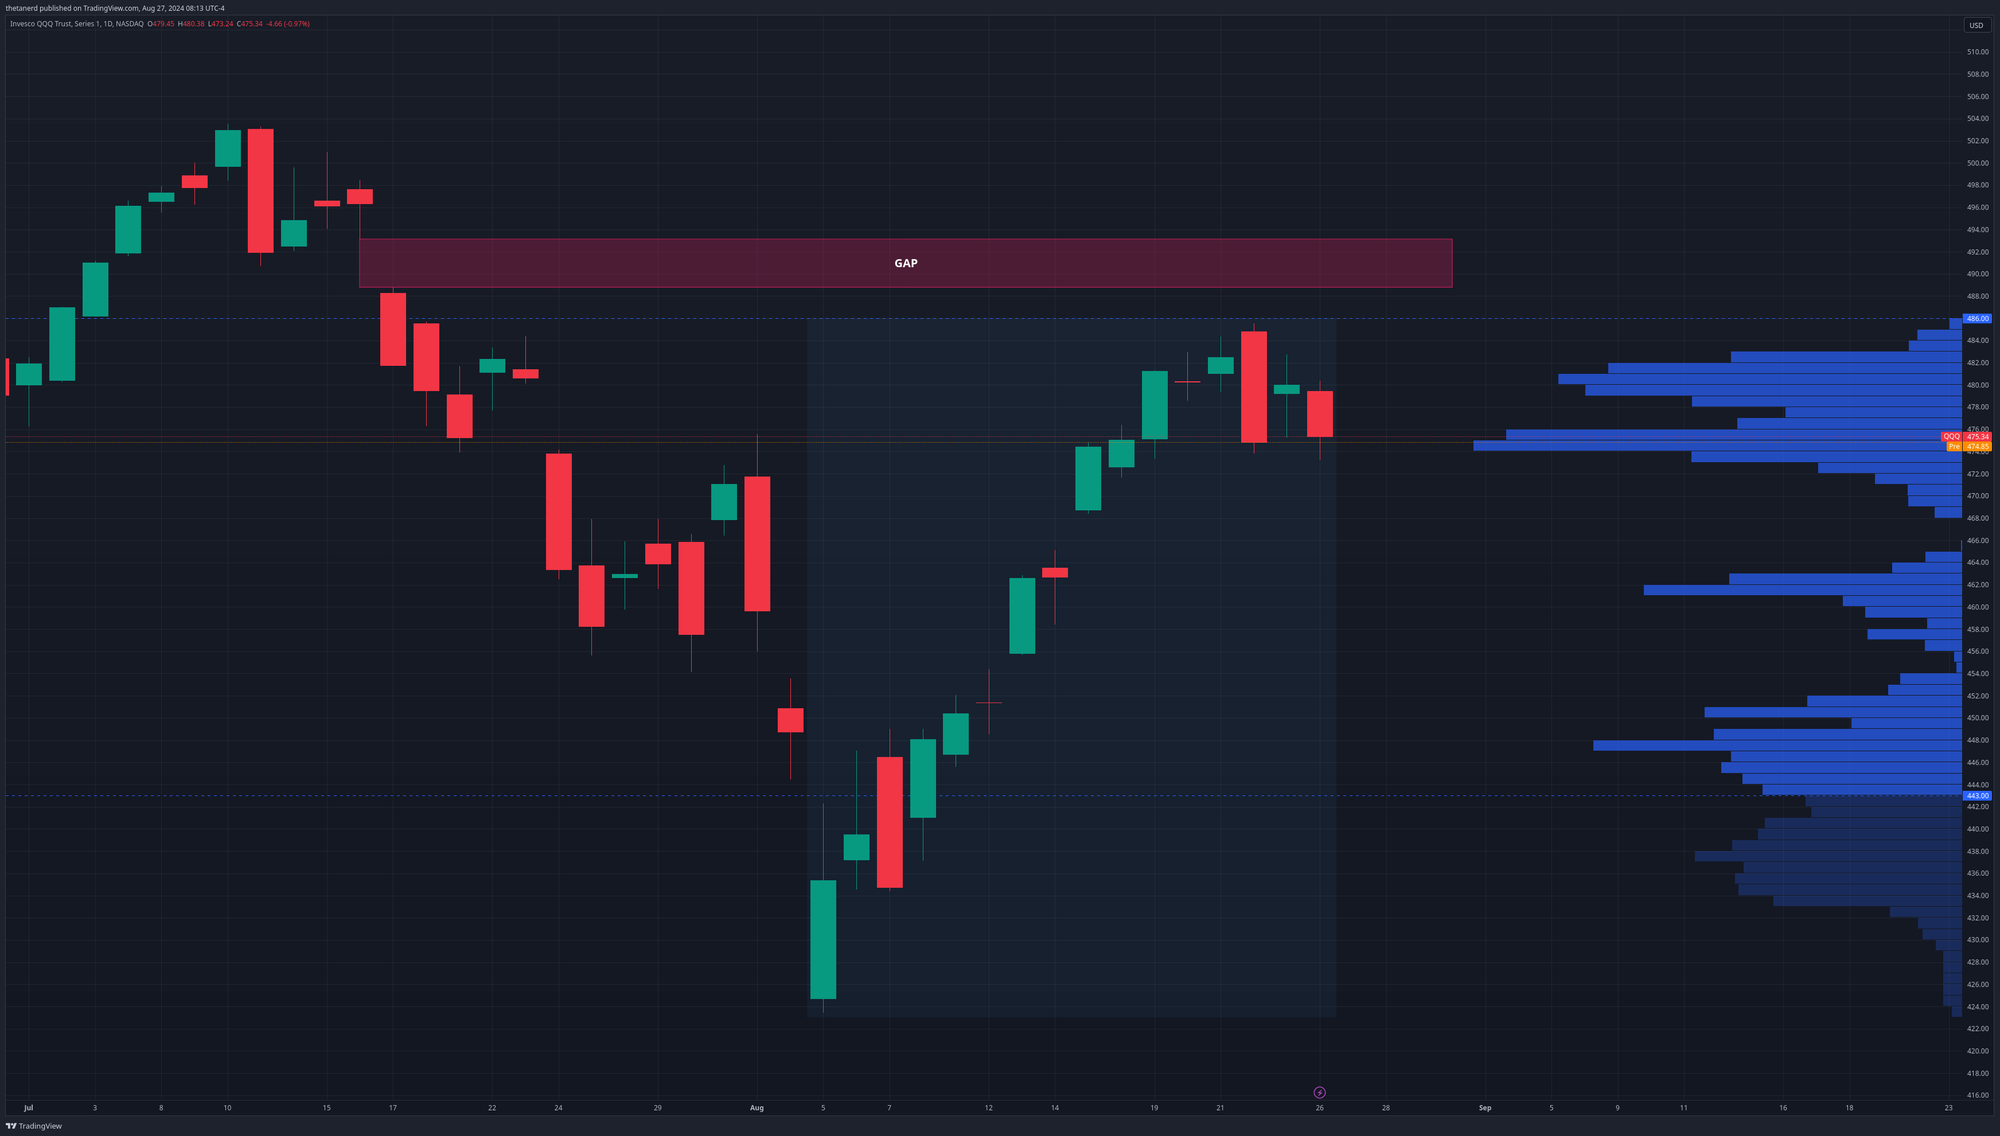
QQQ
Over in the land of NASDAQ, we have a very different story. We have a gap above the current price and we're making a much lower high now relative to the high that SPY is trying to make:
If we add on some indicators, we see similar bearish divergences in the VPCI and RSI indicators:
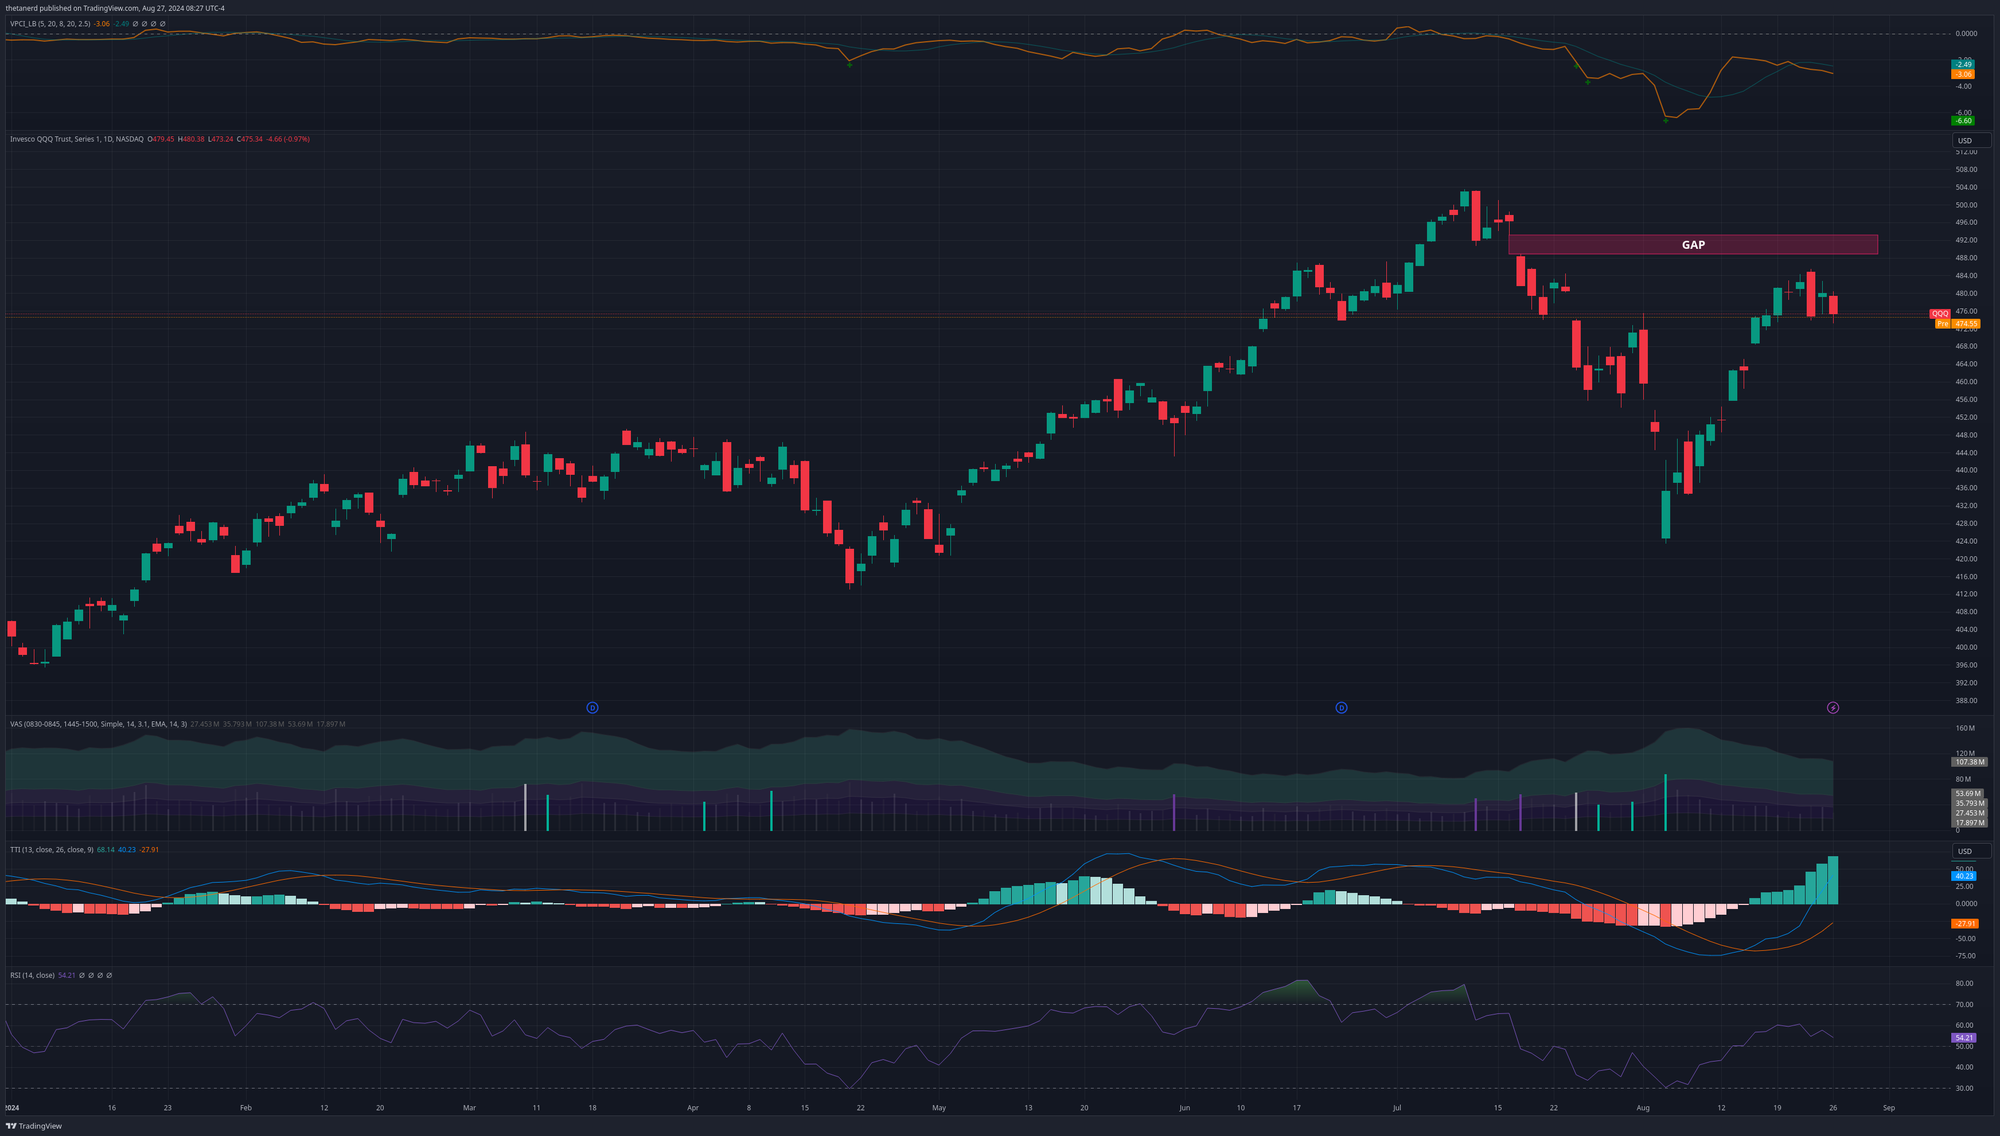
This isn't a setup that makes me bullish.
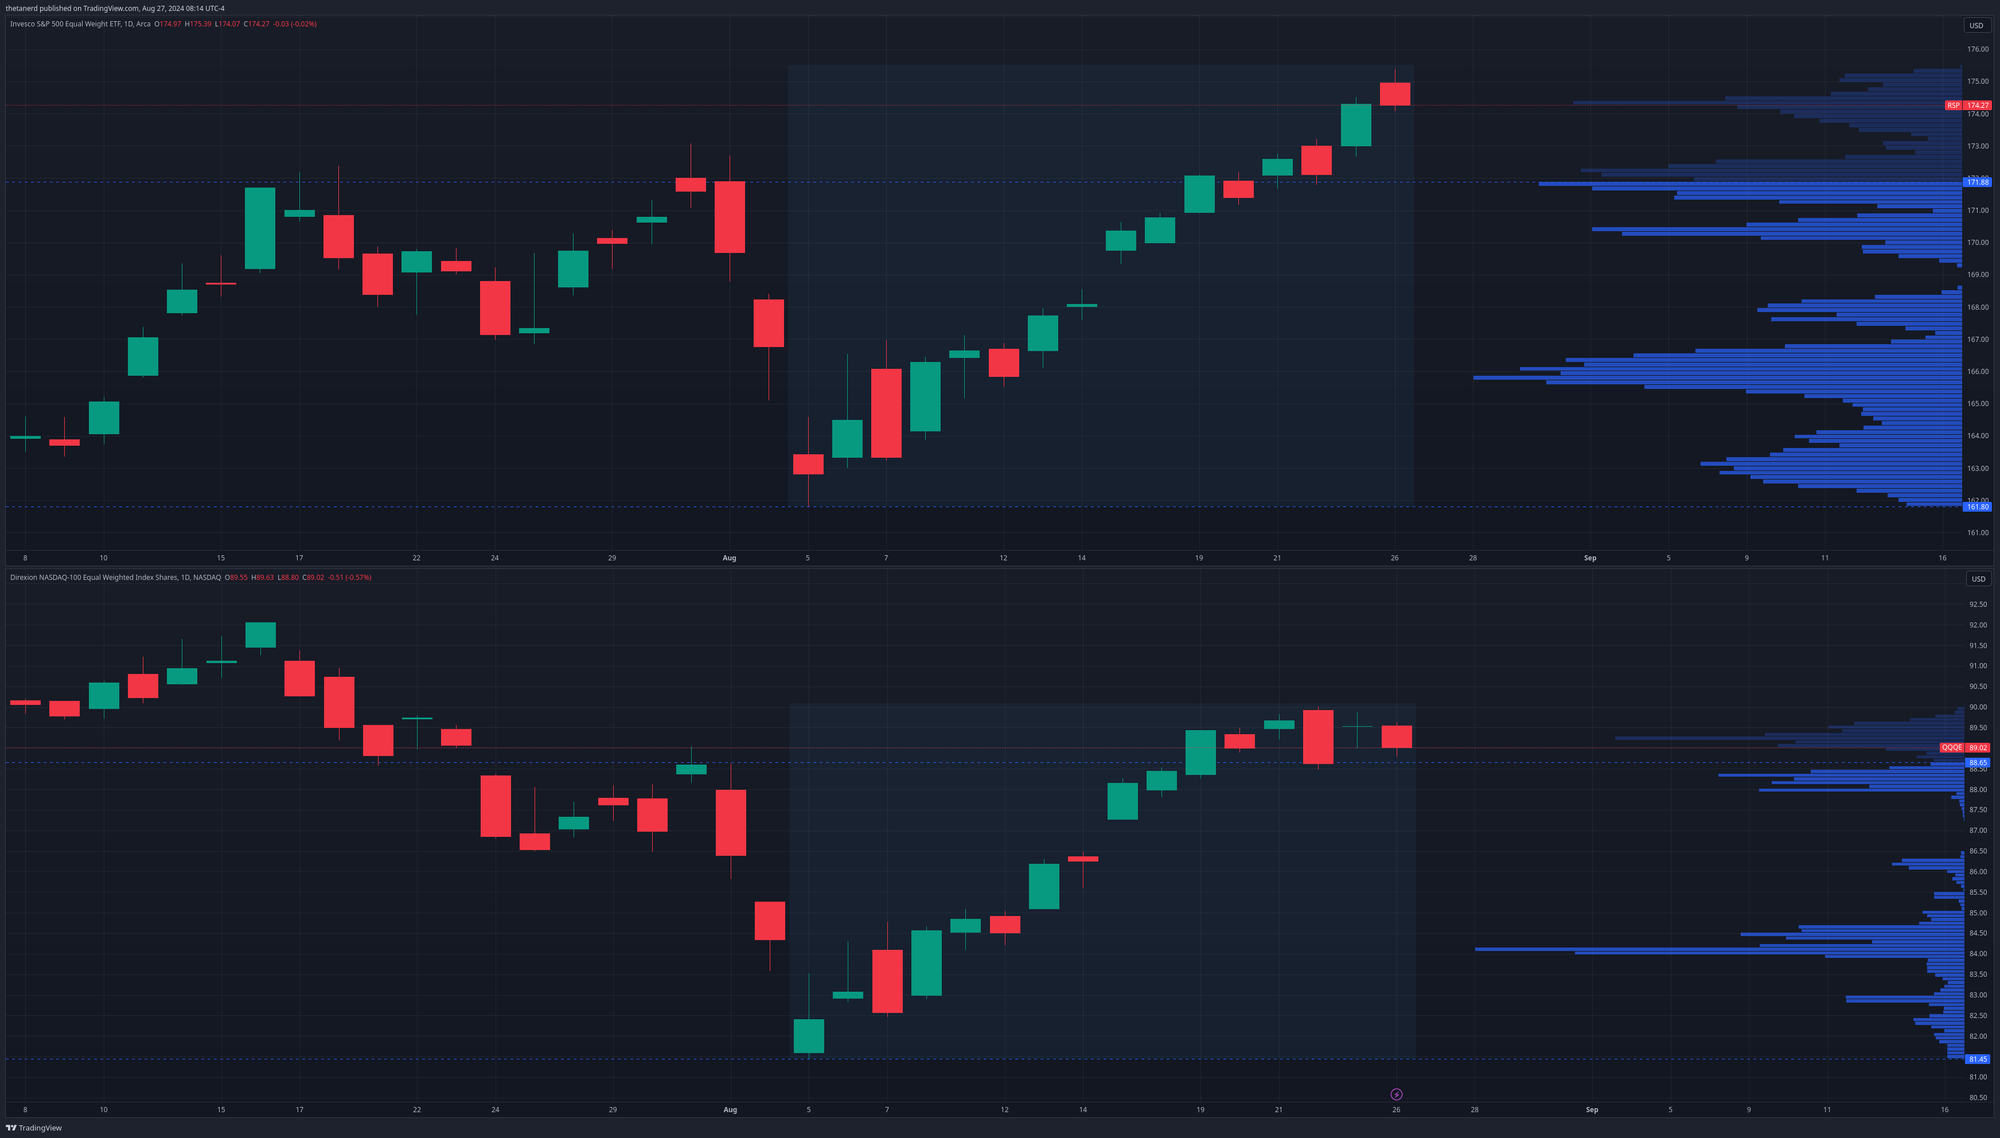
Equal weights
Remember that SPY and QQQ are market cap weighted and that means that larger companies are over-represented in the index. Although NVDA might be a huge part of SPY, it's the same size as everyone else in these equal weight indexes.
In this chart, RSP (equal weight S&P 500) and QQQE (equal weight NASDAQ 100) look a little better than their market-weighted counterparts. RSP is making a new high with much better looking candlesticks, but QQQE looks noticeably weaker. The gap from QQQ's chart has already been filled in on QQQE's chart:
Point and figure breakouts
I've been really intrigued by point and figure (PnF) charts lately and I set up a scan on StockCharts to find bullish breakouts on PnF charts with other good technical indicators. For example, to make this list, the chart needs a bullish percent price oscillator indicator, an improving RSI over 49, improving strength over RSP, and a SCTR of 60 or higher.
What's sitting at the top of the list today?
Utilities, physical gold, low volatility stocks and energy top the list. The first tech name on the list is EBAY around #25. 🤯
Thesis
We're in an environment of uncertainty with interest rates, macroeconomic changes, important elections, and the future of AI. Liquidity is also drying up in most tickers that I follow and that can lead to stagnant markets and/or wild price swings with news updates. Something will break loose soon, but I have no idea which direction we might go.
Good luck to everyone this week! ☘️
Discussion