A broad look at the market in October 2024

Let's skip the individual stock charts this week and get a broader view of the market using put and call analysis. 📝

We're in some wild times right now with the overall market moving up along with oil and the US Dollar. Treasury yields are climbing and spooking potential homeowners who were expecting better deals on mortgages. Gold and silver are also rising?
The market is sending some very confusing signals right now. Let's take a broad look at the market today using some charts from SentimenTrader. Thanks again to the team at SentimenTrader for giving me a couple of months to check our their platform! 💙
All investments come with significant risks, including the loss of all capital. Please do your own research before investing, and never risk more than you are willing to lose. I hold no certifications or registrations with any financial entity.
It's data time.
Open interest ratios
The folks over at SentimenTrader have some charts which track open interest ratios over time. These charts take the total number of open puts divided by the number of open calls. When the indicator rises, the number of open puts is increasing faster than the number of open calls. Calls are rising faster when the indicator falls.
These charts are very spiky if you plot the indicator by itself. I've plotted a 100 day moving average of the indicator to reduce the noise and make it easier to spot a trend.
First up is SPY:
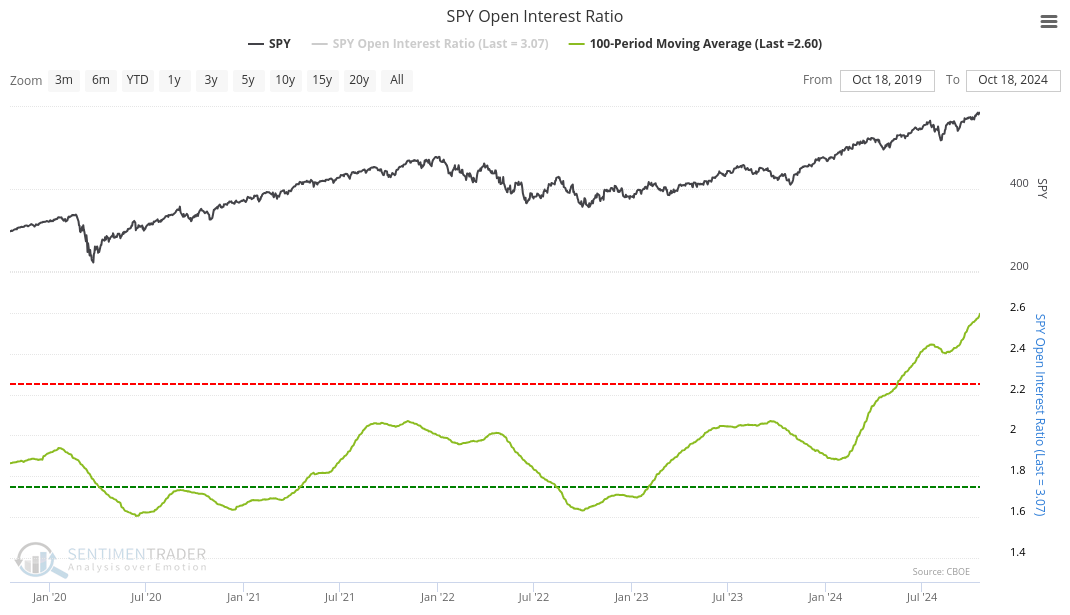
This is a five year view with the COVID drop on the far left. Open put contracts fell off abruptly in the 2020/2021 rally out of the brief recession, but then put contracts increased and held into the 2022 bear market. The ratio decreased into the end of 2022 as the market began to find its footing. However, the 2024 bear market has seen a dramatic increase in open puts relative to calls. The ratio has not been this high in five years.
Does the chart of QQQ's open interest tell the same story?
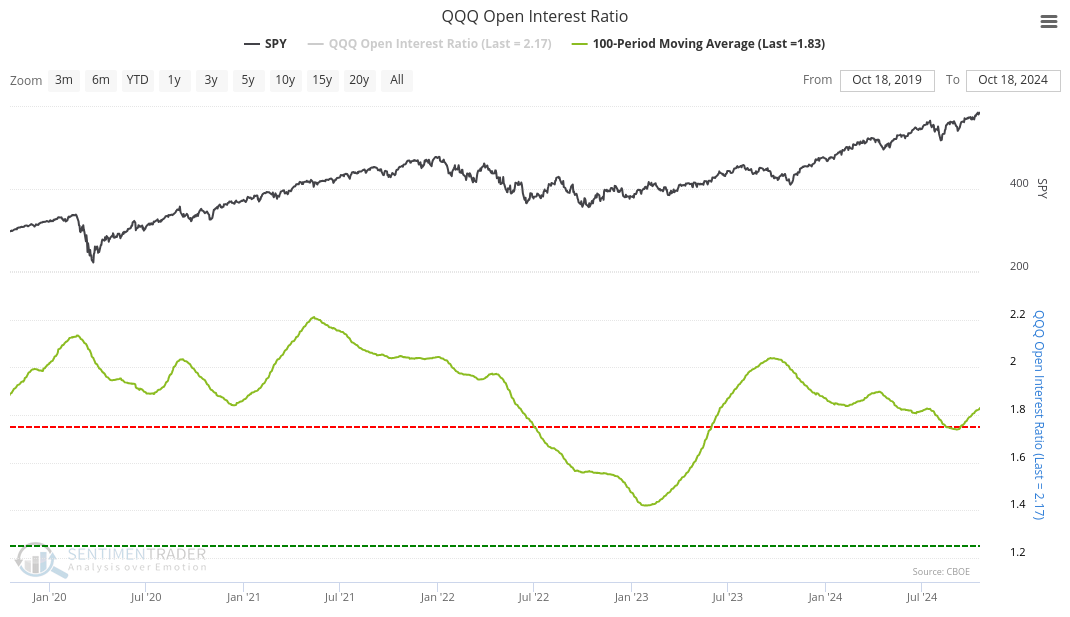
The QQQ open interest ratio bottomed at the end of 2022, peaked again in late 2023 and then slowly retreated throughout 2024. It's trying to make another stand lately and it could take out July 2024's high. Either puts are much less active on QQQ lately or calls are receiving more attention here.
How about the Dow?
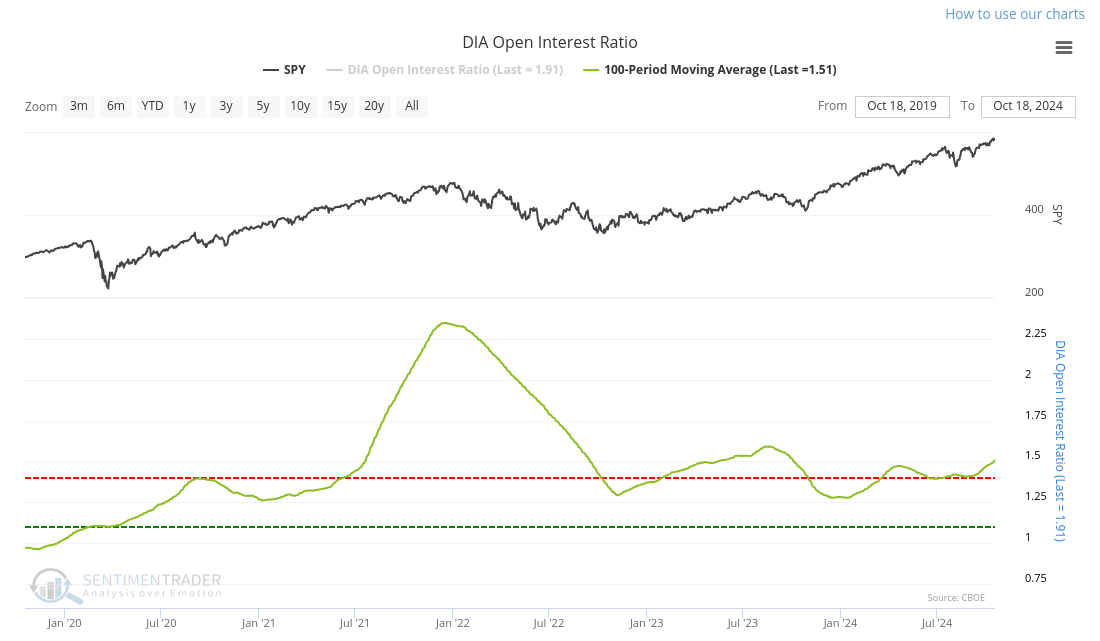
This one is totally different. Dow traders went heavy on puts during the late part of 2021 and those tapered off as the 2022 bear market started. It followed a pattern similar to QQQ since July 2023.
Let's get a look at IWM, too:
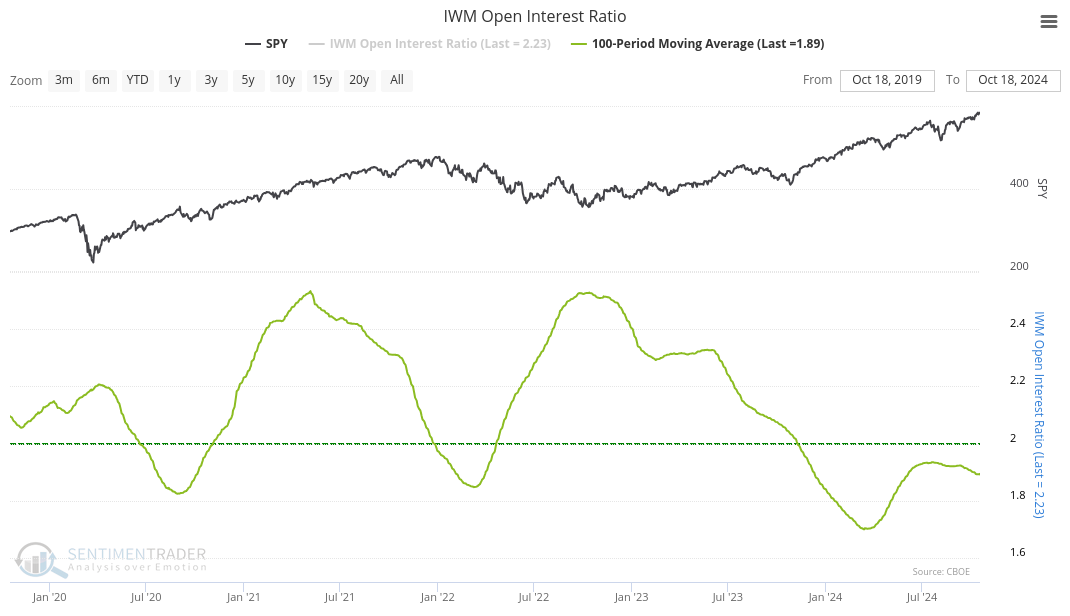
As you might expect, IWM is whipsaw city. However, note that the current open interest ratio is below the lower extreme, which suggests that trading has reached a very bearish level. Note that IWM typically doesn't hold with an open interest down here for very long in the past, but 2024 is an exception.
SentimenTrader's backtests show that IWM's open interest spends less than 30% of its time below the lower extreme.
Finally, let's examine OEX, the S&P 100 index:
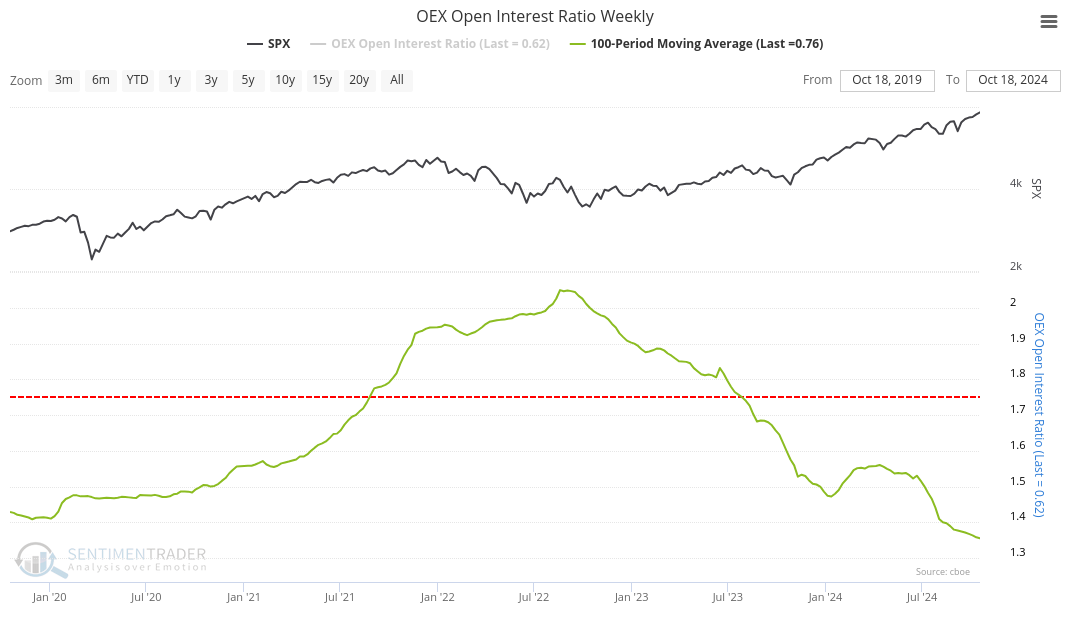
The S&P 100 contains the largest stocks in the S&P 500 that have been responsible for much of the gains in 2024. Put contracts surged before the 2022 bear market but then they fell off steadily into 2024. There was a little fear at the beginning of 2024 that caused a brief rise, but we're at levels now that we haven't seen since before COVID.
Retail versus the big guys
SentimenTrader also tracks some interesting options metrics around small and large options orders. Their two main charts are ROBO (retail only buy to open) and LOBO (large only buy to open):
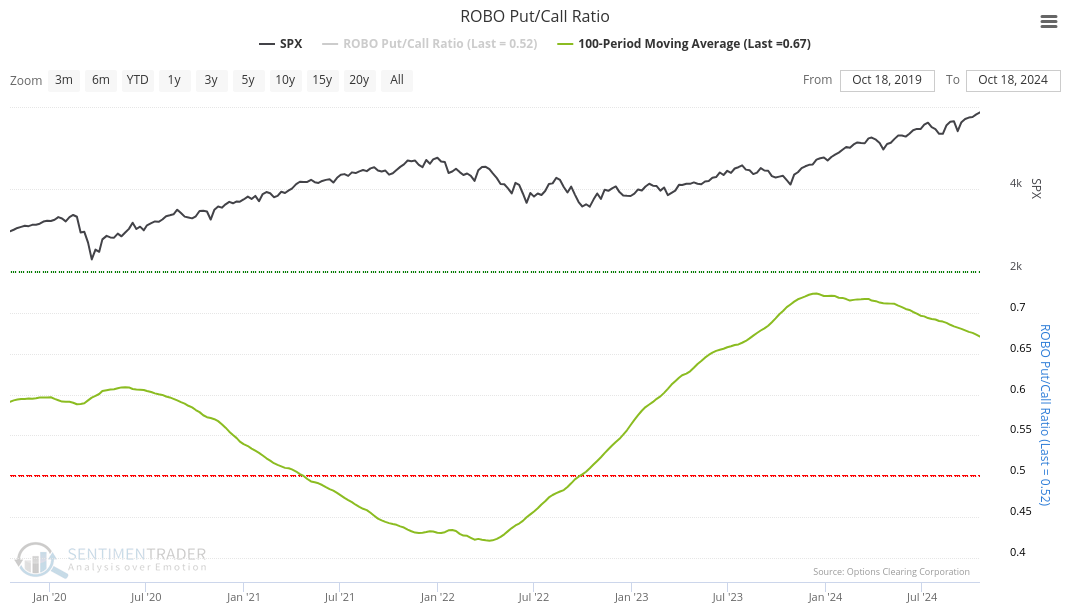
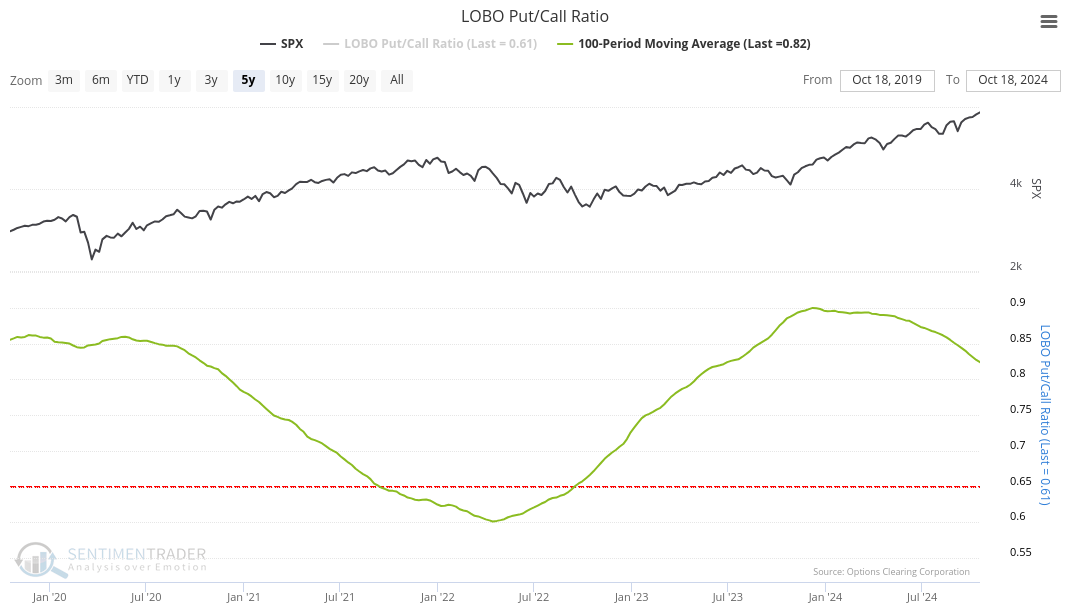
ROBO (first, left) and LOBO (second, right)
When these indicators run towards the red line (lower), this is typically a bearish sign for stocks. A run to the green line (higher) is typically bullish. It seems like both groups, retail and large traders, are fading this rally. However, if you look back to the 2020/2021 rally, the indicators were very, very early in predicting the 2022 bear market.
I haven't backtested these indicators to see how they perform over longer time periods, so your mileage could vary on these. 😉
Thesis
The market is still sending a lot of confusing signals right now and markets are dealing with a lot of variables. We have an upcoming US presidential election, plenty of geopolitical conflict, inflation worries, and an unusual commodity cycle. Combine all of this together and you've got some fearful traders in the market who are eager to protect their 2024 gains.
The old adage "the trend is your friend until it bends" is a helpful reminder here. We're trading at all or near time highs in most indexes and although it's easy to argue that the trend is strong right now, it does make many traders a bit uneasy. As Chris Ciovacco notes in his weekly videos, it's not unusual to get decent pullbacks of 5%, 10%, or even 15% in a bull market. We might be due for one of those soon before a potential move higher.
Good luck to everyone this week! 🍀
Discussion