Broad market overview for November 26th

Let's get a broad look at the S&P, NASDAQ, and the Russell to see where we might go this week. 📈

Thanksgiving week has come and gone here in the USA and it's time to get back to trading with more volume. I'm in Las Vegas this week for AWS re:Invent, so my updates will likely be a bit less frequent. I have some spare time now, so let's get a look at some charts.
All investments come with significant risks, including the loss of all capital. Please do your own research before investing, and never risk more than you are willing to lose. I hold no certifications or registrations with any financial entity.
Volland is down this afternoon so this will be mainly a charts-only post.
Ciovacco Capital has a good update this week
I look forward to the Ciovacco Capital videos each week and the latest one is quite brief:
The TL;DR is:
- Markets look pretty good, especially on a weekly timeframe
- Very few of the current indicators look bearish and those that do are almost turning bullish
S&P 500
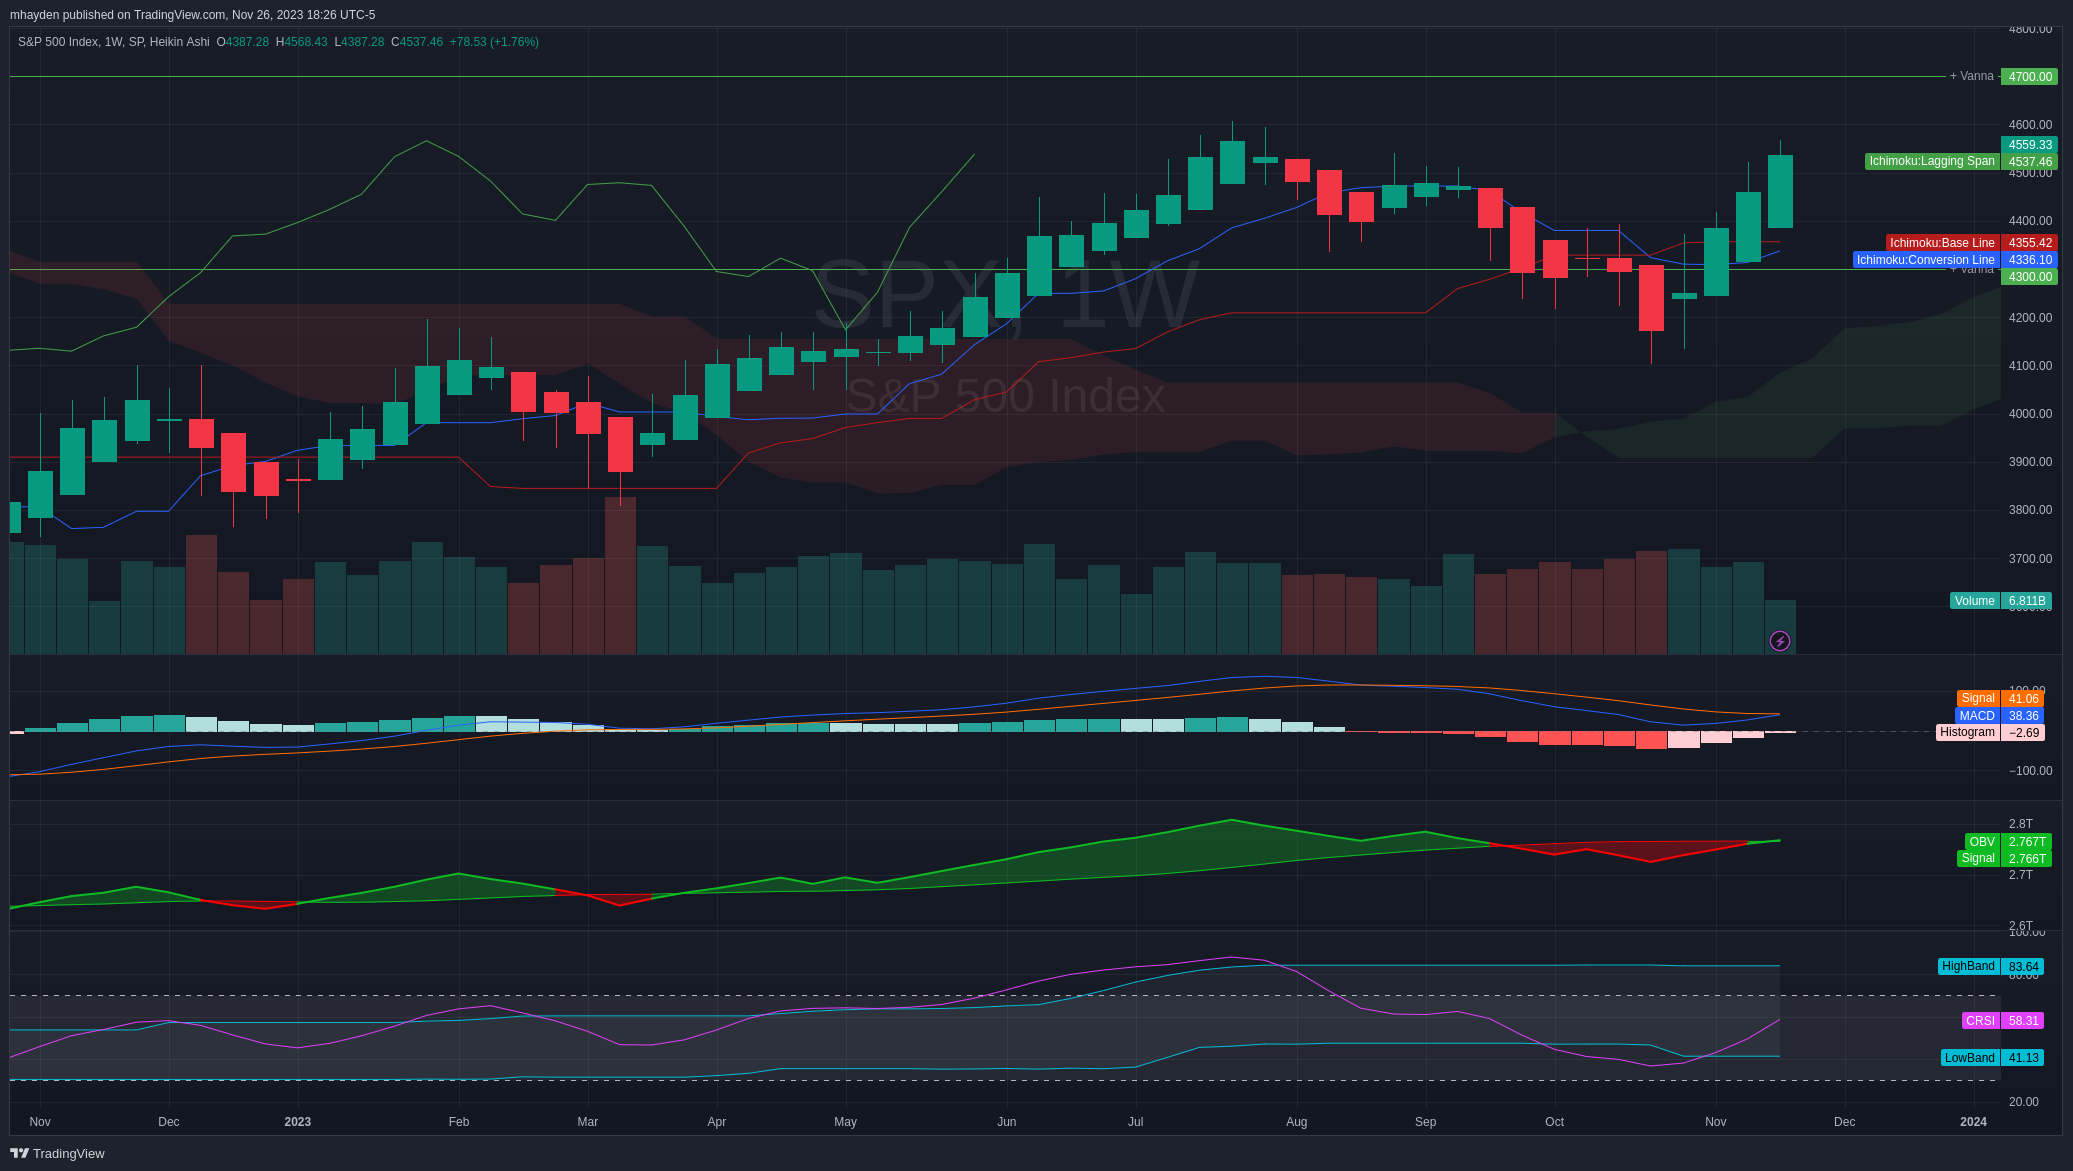
SPX is looking fantastic for the year so far:
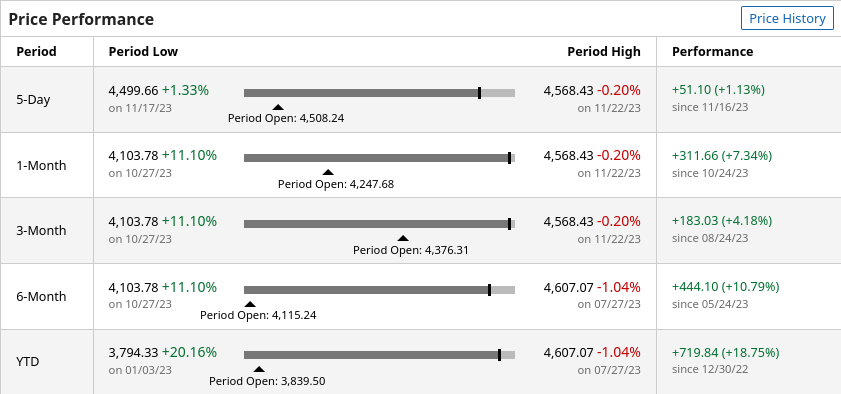
SPX ticks all of the green boxes except for the blue/red lines on the Ichimoku cloud. I'd like to see the blue line above the red line for a perfect indicator, but we already have bullishness across the board on the cloud. The MACD is on the cusp of a bullish cross, volume is supporting the price move and we're halfway up the cRSI channel.
The Heikin Ashi candles also point to a strong rally with three straight weekly candles without any bottom wicks. I get excited when I can catch three of these in a row.
In addition, my last look at SPX in Volland showed 4300 and 4700 as massive positive vanna levels. It looks like we're on the move towards 4700 now.
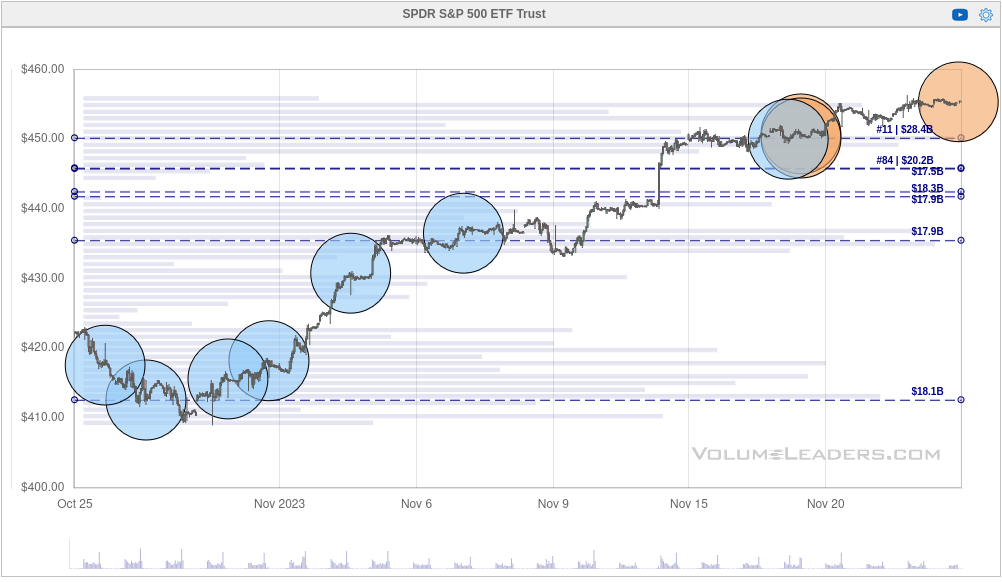
Volume Leaders shows some interesting dark pool trades recently up in the $450's, but none of these rank in the top 100 trades for SPY. There were lots of trades at the $450 level with more at $455 last week.
Just as a reminder, this tool doesn't show the direction for trades – just the volume, price, and time. Everything I can find on the chart suggests SPX has more room to run and we don't hit an interesting vanna level until 4700. This really makes me think these recent trades were longs, not shorts. 🤔
NASDAQ
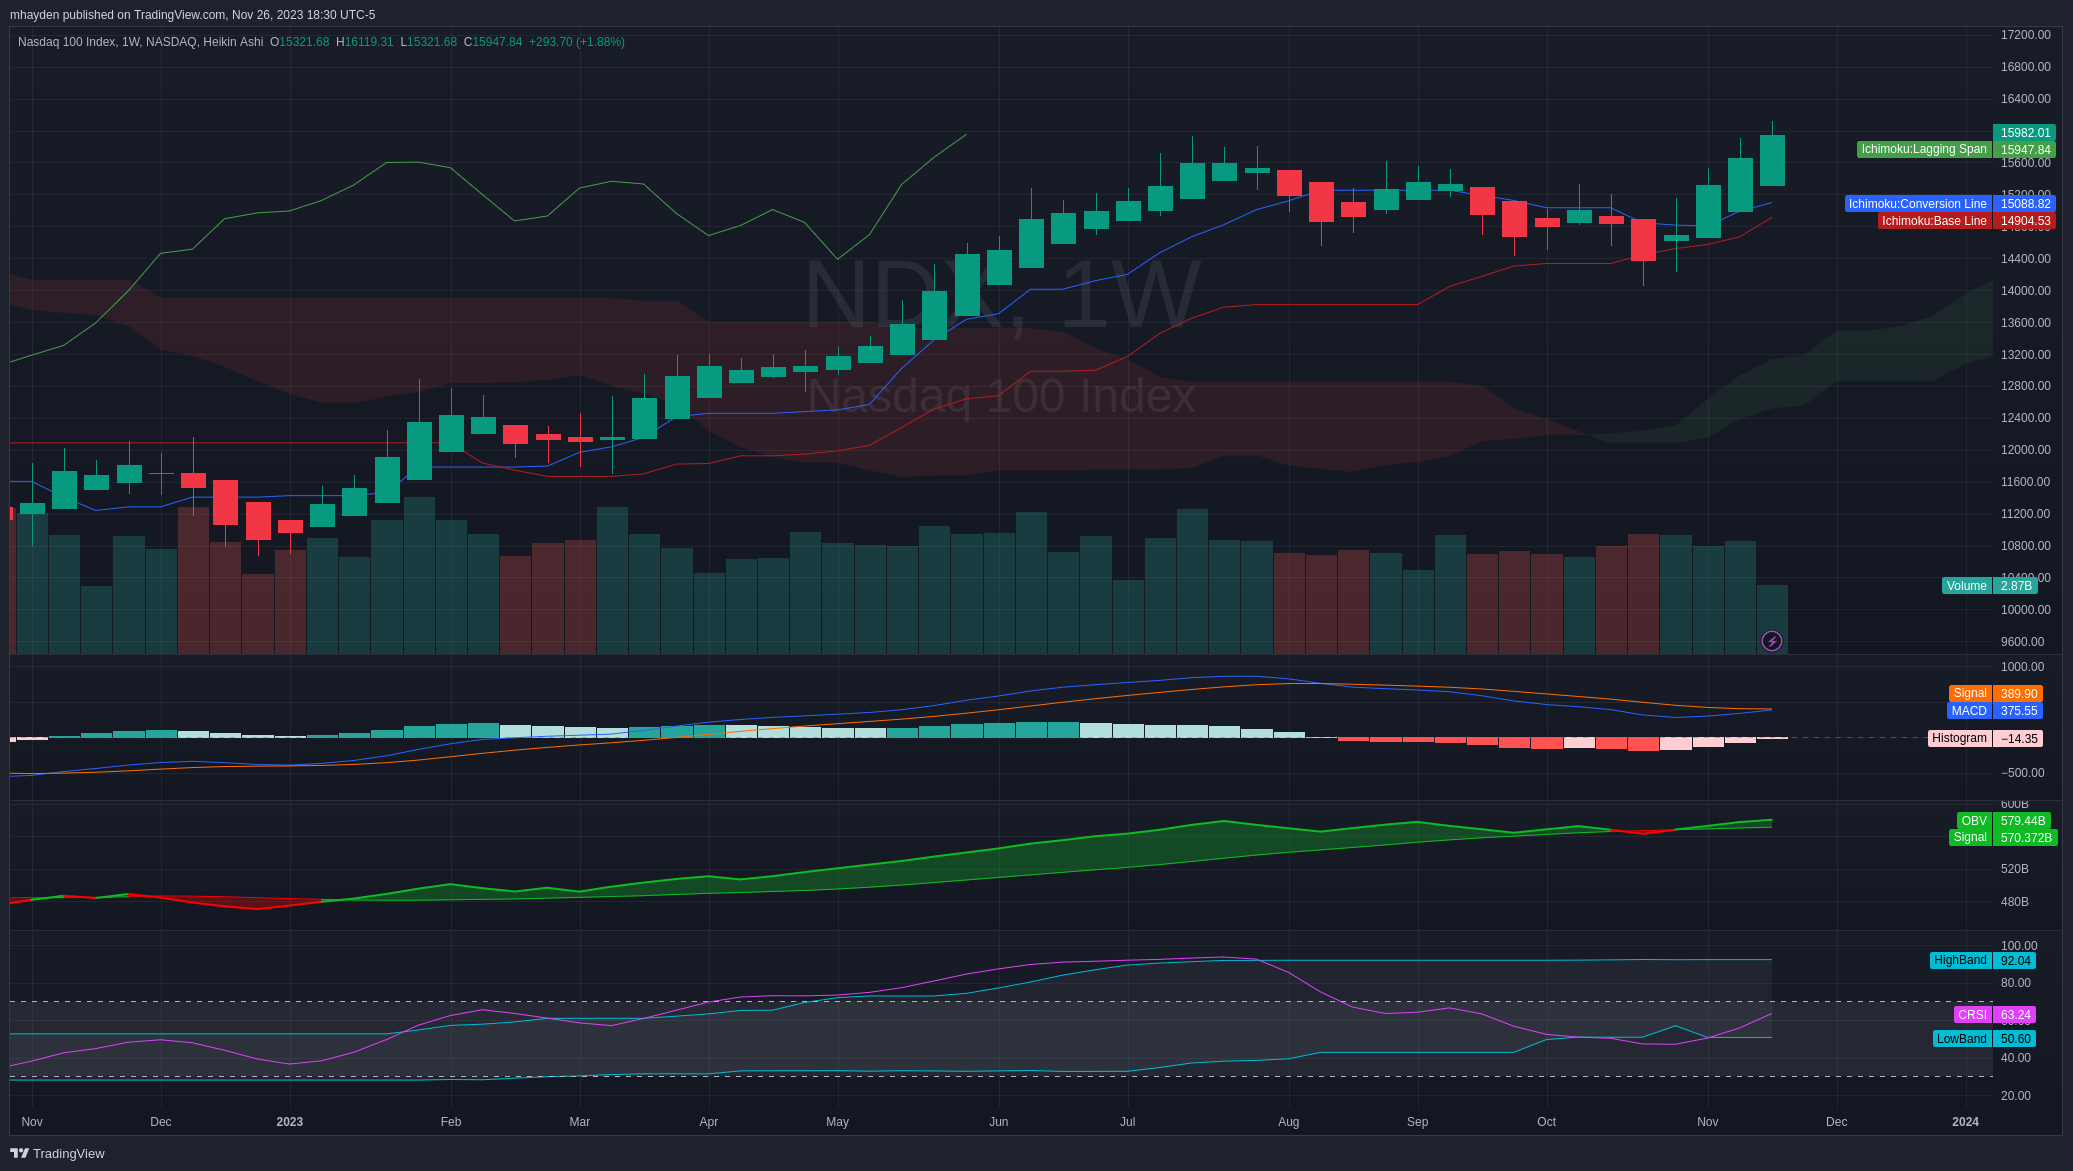
The NASDAQ had some good gains so far this year as well:
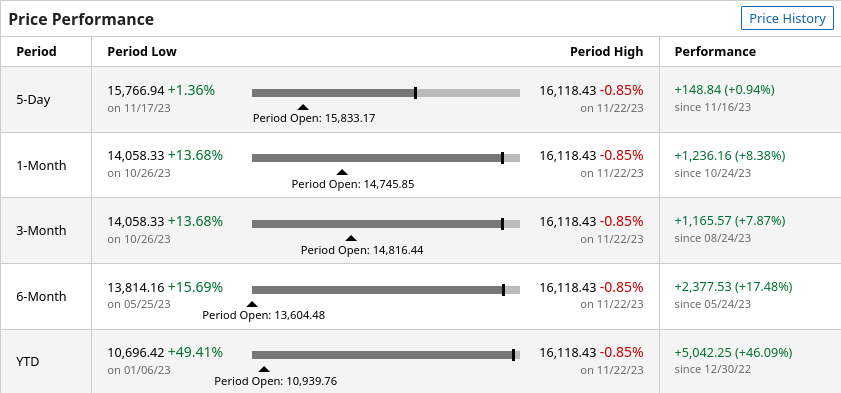
The NASDAQ chart looks even better than the SPX chart. All of the Ichimoku cloud indicators are firmly bullish. The MACD is on the cusp of a bullish cross as well here. Volume also supports the price movements and there's even more room in the cRSI channel for a move up. There's also three bullish HA candles in a row with no bottom wicks.
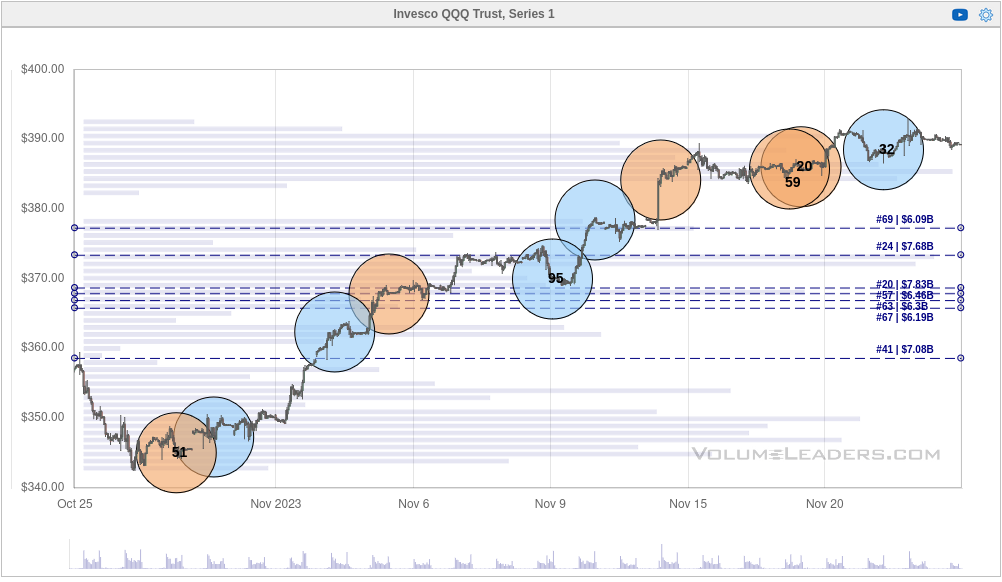
QQQ is a bit different here since it has some top 100 trades showing up recently at the highs. #20 and #59 show up above $380 and then #32 showed up last week above $388. Previous volume is a bit thin up here but the NASDAQ seems to have plenty of strength and room to run based on the chart.
Russell
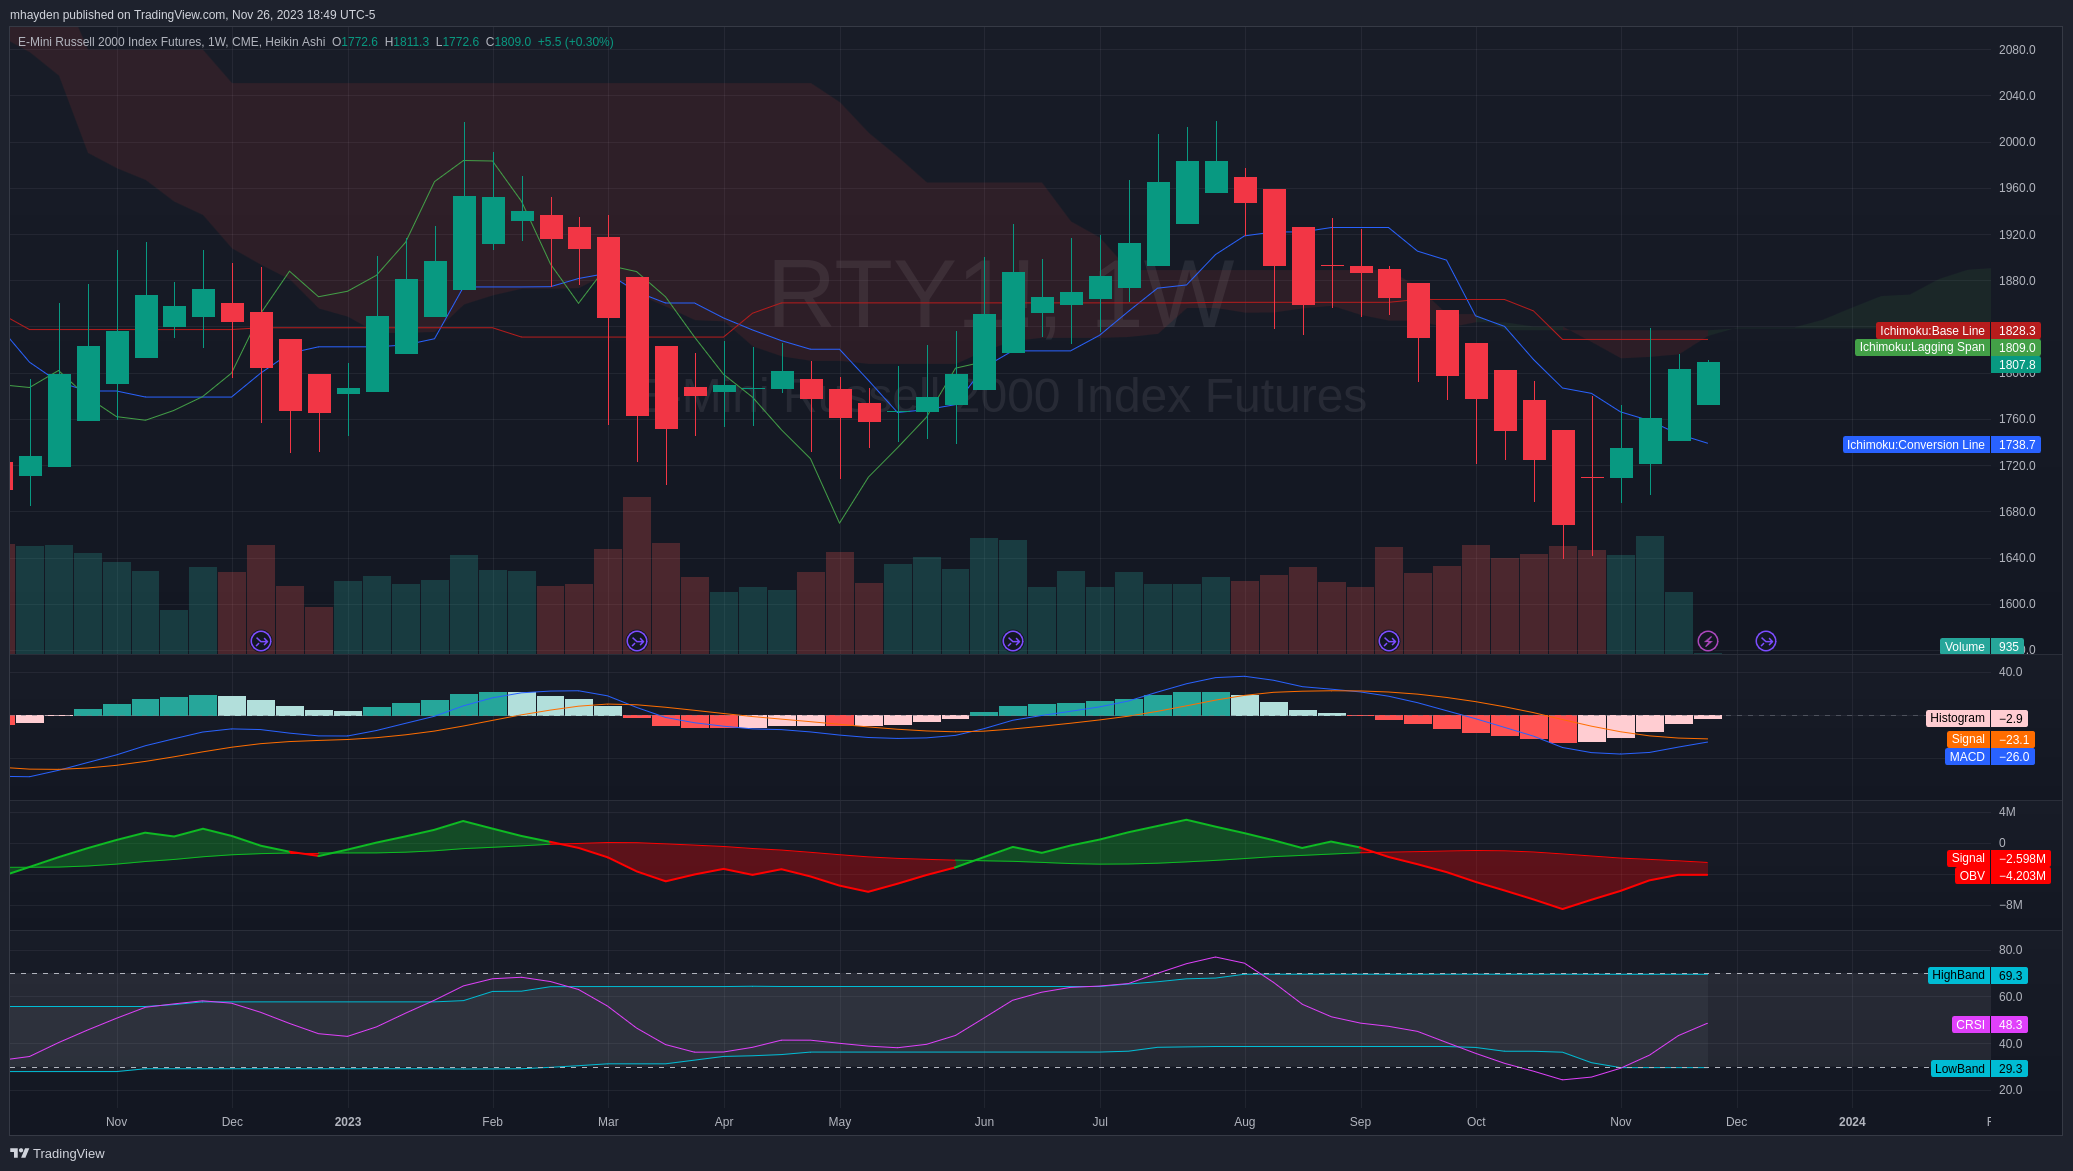
I keep hearing the argument that the Russell small-caps stand to benefit the most as interest rates come down because these companies can turn the ship a little faster than the larger companies. I'm not sure if that's true, but the Russell 2000 has been all over the place this year, especially when you compare it to SPX and NDX.
RTY futures are making a good move up with two bullish HA candles with no bottom wicks. However, the MACD remains below zero and the OBV is below the trend line. On the bright side, the MACD is just about to make a bullish cross and the cRSI has room to grow.
There's definitely a lot less strength here in the Ichimoku cloud. The blue line is under the red line, price is under the cloud, and the cloud is extremely thin. The Russell looks to be turning a bullish corner but I might wait a little longer before making a trade here to see if it closes a candle above the cloud.
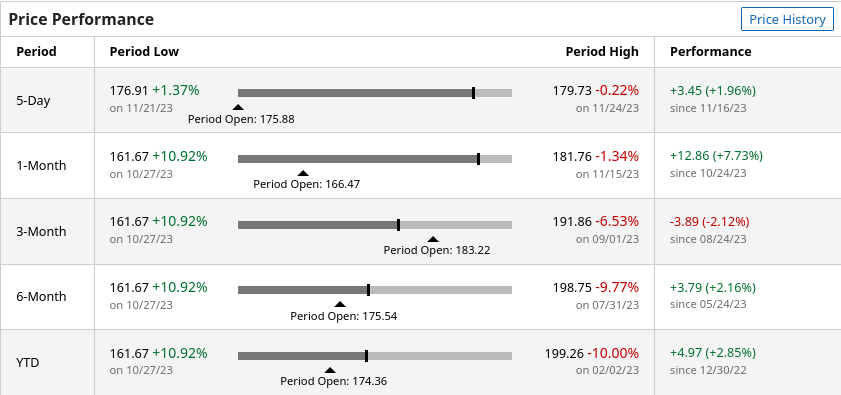
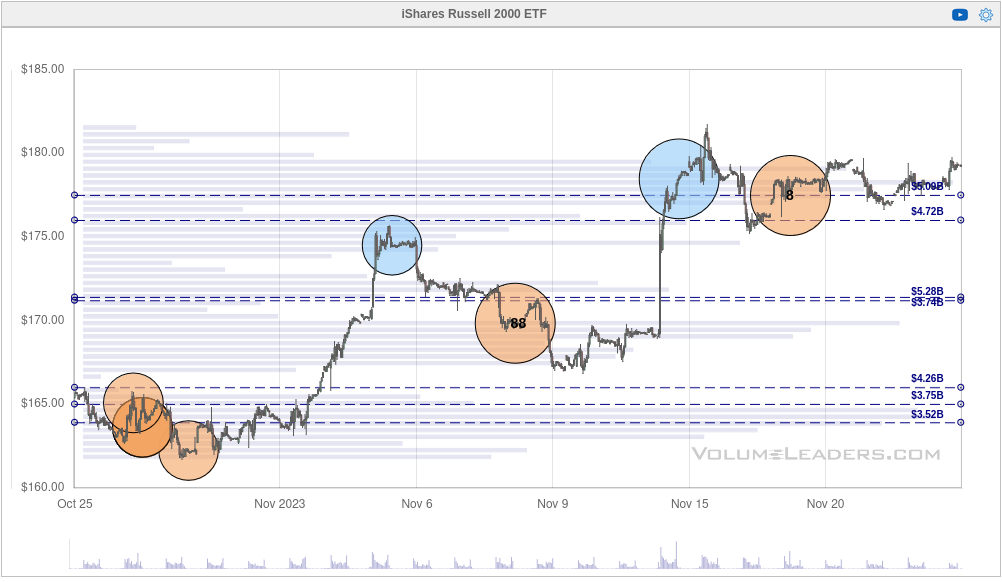
IWM has some interesting trades, including a #8 trade around $177.47. This looks good for a move up but it still feels a little too early to me for now. I'd like to see IWM take $180 and hold that level.
Thesis
When it comes to strength, NASDAQ definitely leads the pack. The S&P 500 is close behind and the Russell finishes third. All of these are looking much more bullish lately and that's something worth noting, especially if you had trouble finding a reason to be bullish from 2022's drop.
The only real curveball I'm dealing with here is that the SPX/VVIX correlation closed above zero last week and that usually signals a turnaround in the VIX:
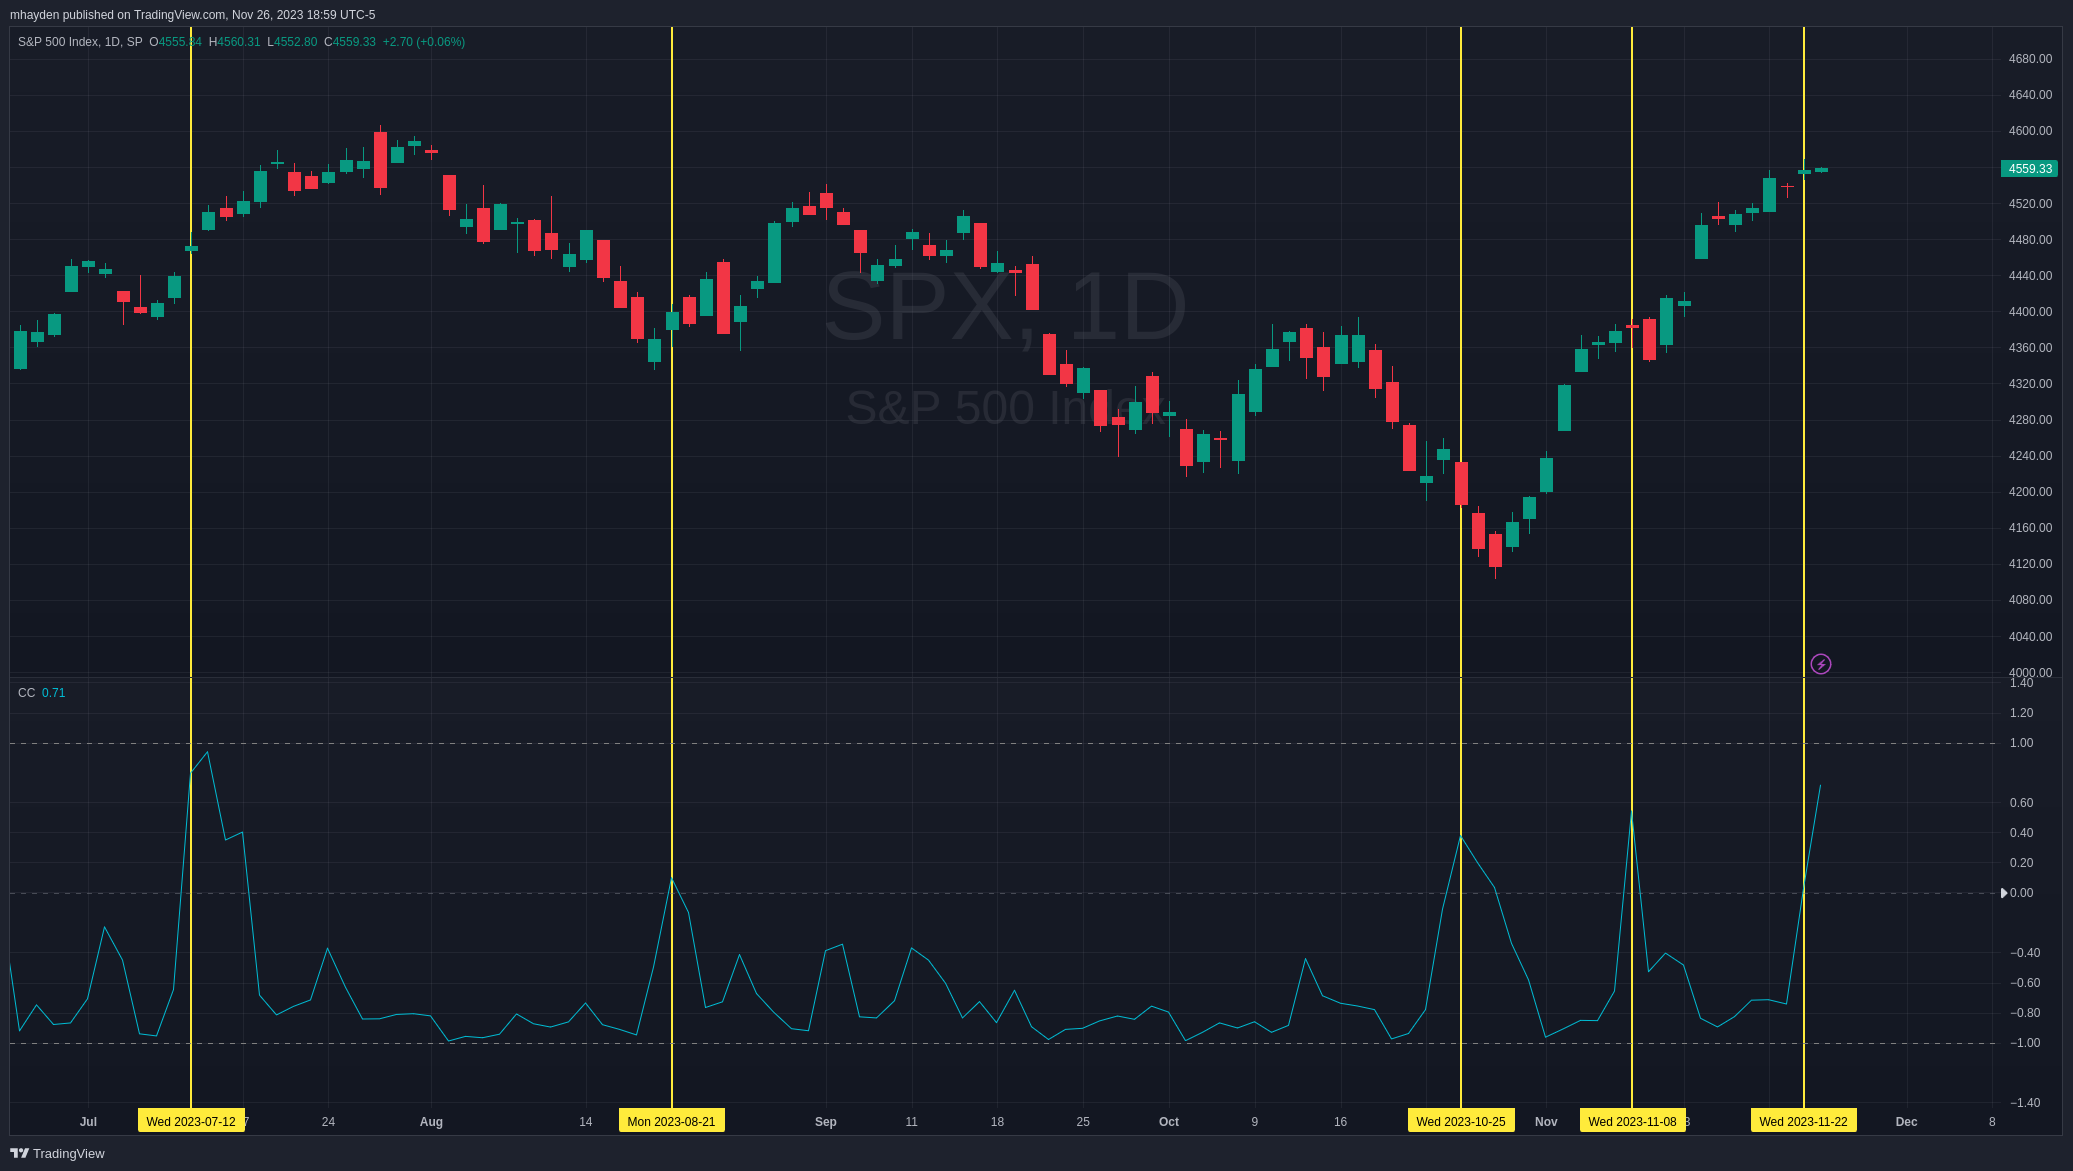
Sometimes the turn takes some time, but it often happens. Perhaps this is a sign that the market might consolidate for a short while before making its next move. Perhaps we're looking at a pull back to a recent gap. I'm not sure yet, but I closed out some of my longs last week just in case.
Good luck to everyone this week! 🍀
Discussion