But I was promised a rally!

A correction? A rotation? Either way, think about how you will react and think less about why the market does what it does. 🧠

Happy Wednesday, everyone! The market turned a corner yesterday and headed a bit lower. My social media timelines are half filled with "the market's going to crash!" and "buy the dip!", but I'm doing my best to focus on the data that's in front of me.
Today's post is all about where we might find support if this is a brief pullback, a deeper correction, or something else entirely.
All investments come with significant risks, including the loss of all capital. Please do your own research before investing, and never risk more than you are willing to lose. I hold no certifications or registrations with any financial entity.
Trading means avoiding thoughts about why the market does something or what it's going to do next. You can't tell the market what to do and trying to make sense out of it will make you very tired. What's critical is how you react when the market moves.
Digging into SPX
The S&P 500 index drives much of the market and we have tons of tools for analyzing what the overall market seems to be doing based on the recent moves. Remember – we're not trying to understand why the market is doing what it's doing. We're trying to plan our moves based on its moves.
First up is Gammalab. I've been trying this service for a week or two for a better look at options positioning on SPX. I'm not sure if I like it yet, but the price is pretty cheap.
This chart shows the net gamma levels for SPX. 5300 is the largest bar and it has been the largest for quite some time:
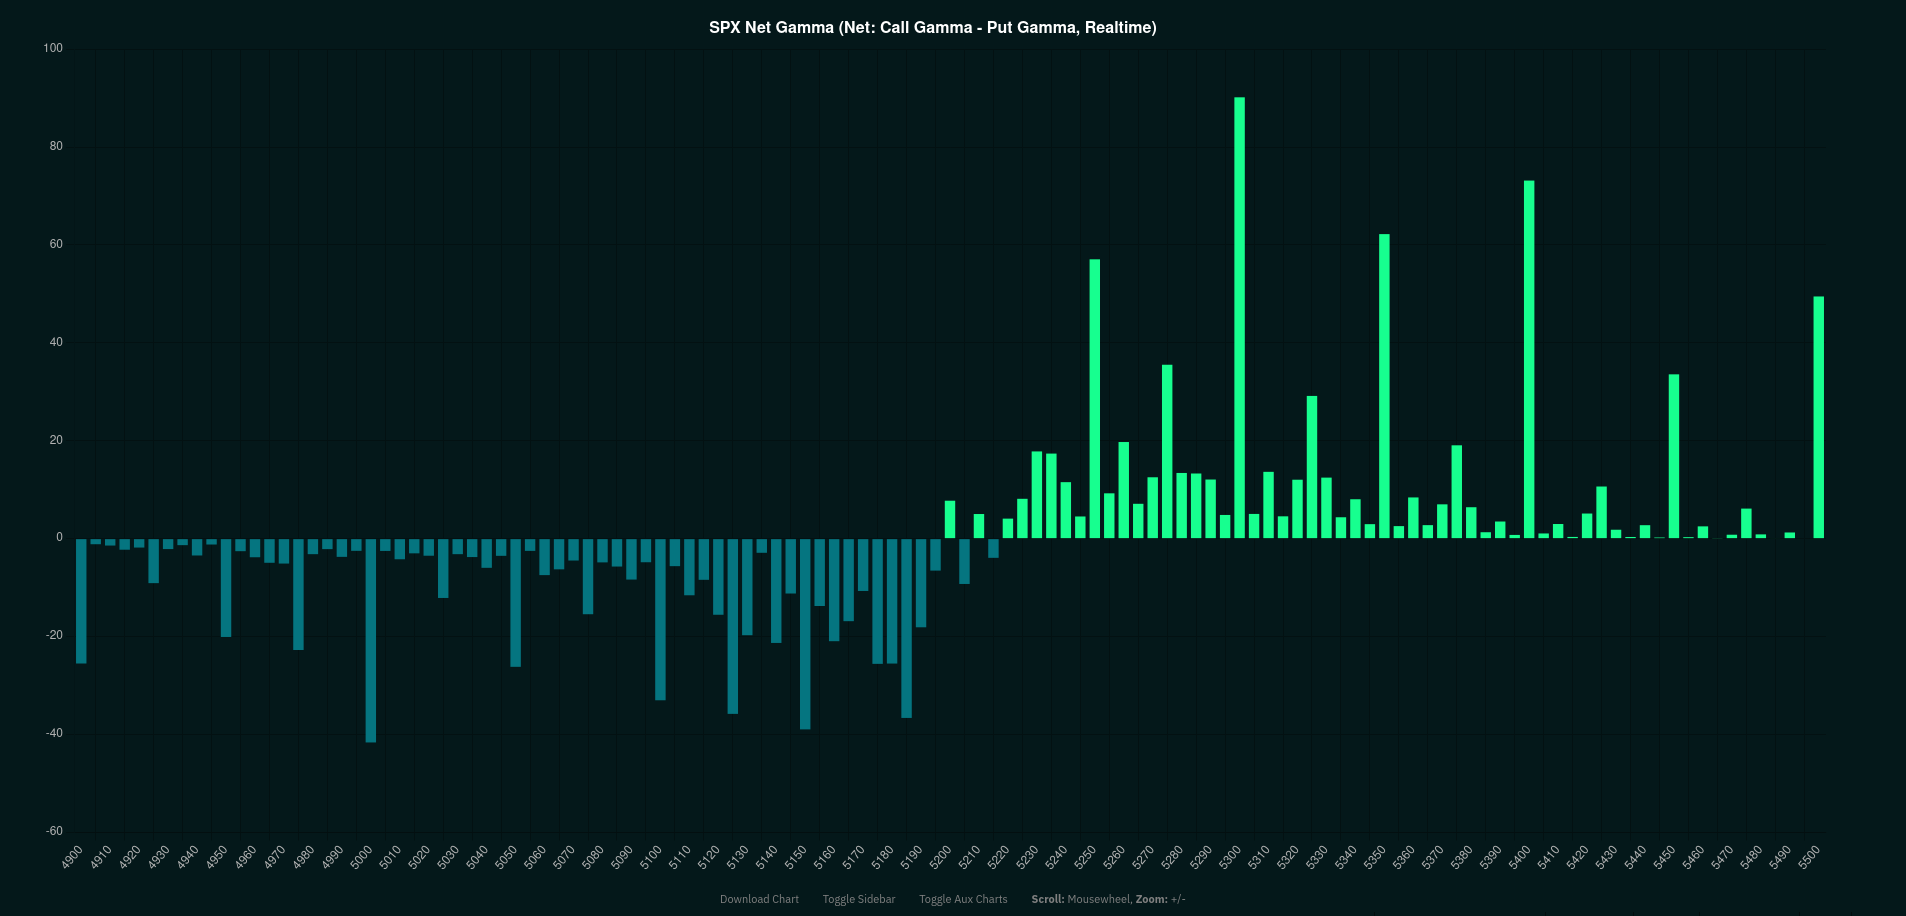
This suggests to me that call buyers are still in their trades, but remember that people buy calls for lots of different reasons. They might be part of a multi-leg options trade or they might be shorting SPX and using calls as a hedge in case we get a rally. It's better to examine these charts on an aggregate view.
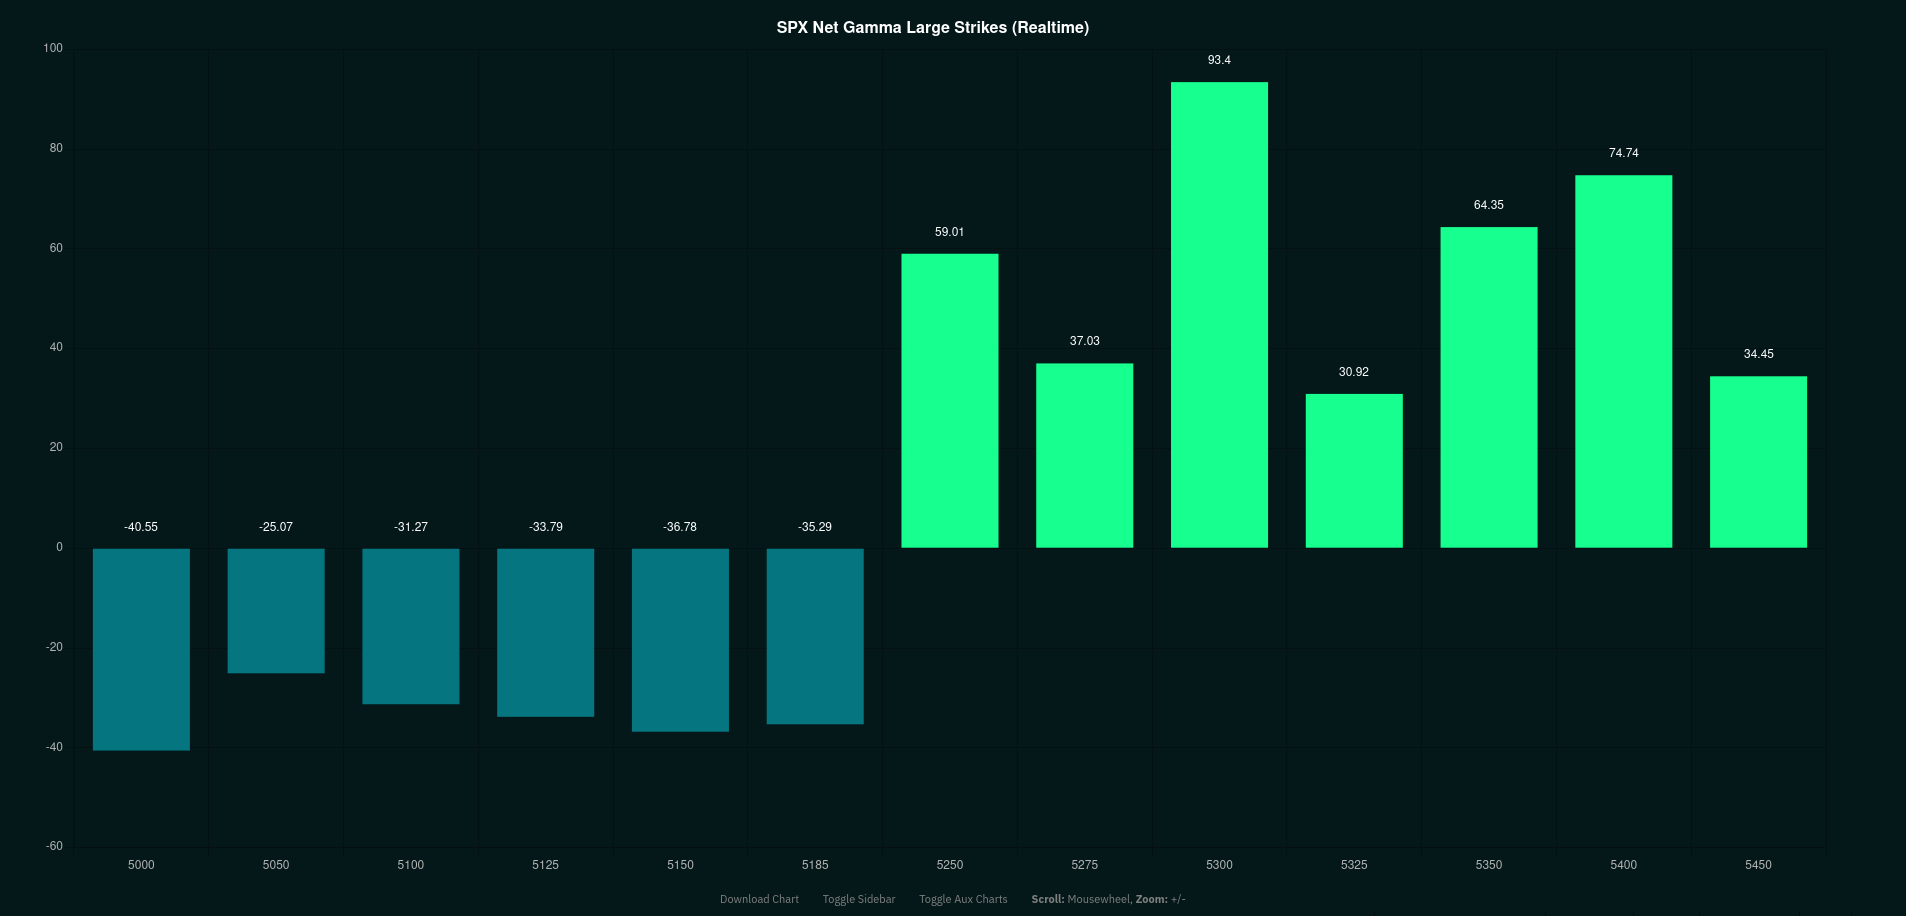
If we analyze only the largest strikes shown above, 5300 still stands out. However, the bars below the current price have grown downwards a bit and that suggests market participants are hedging their bets. Hedging is a healthy market function.
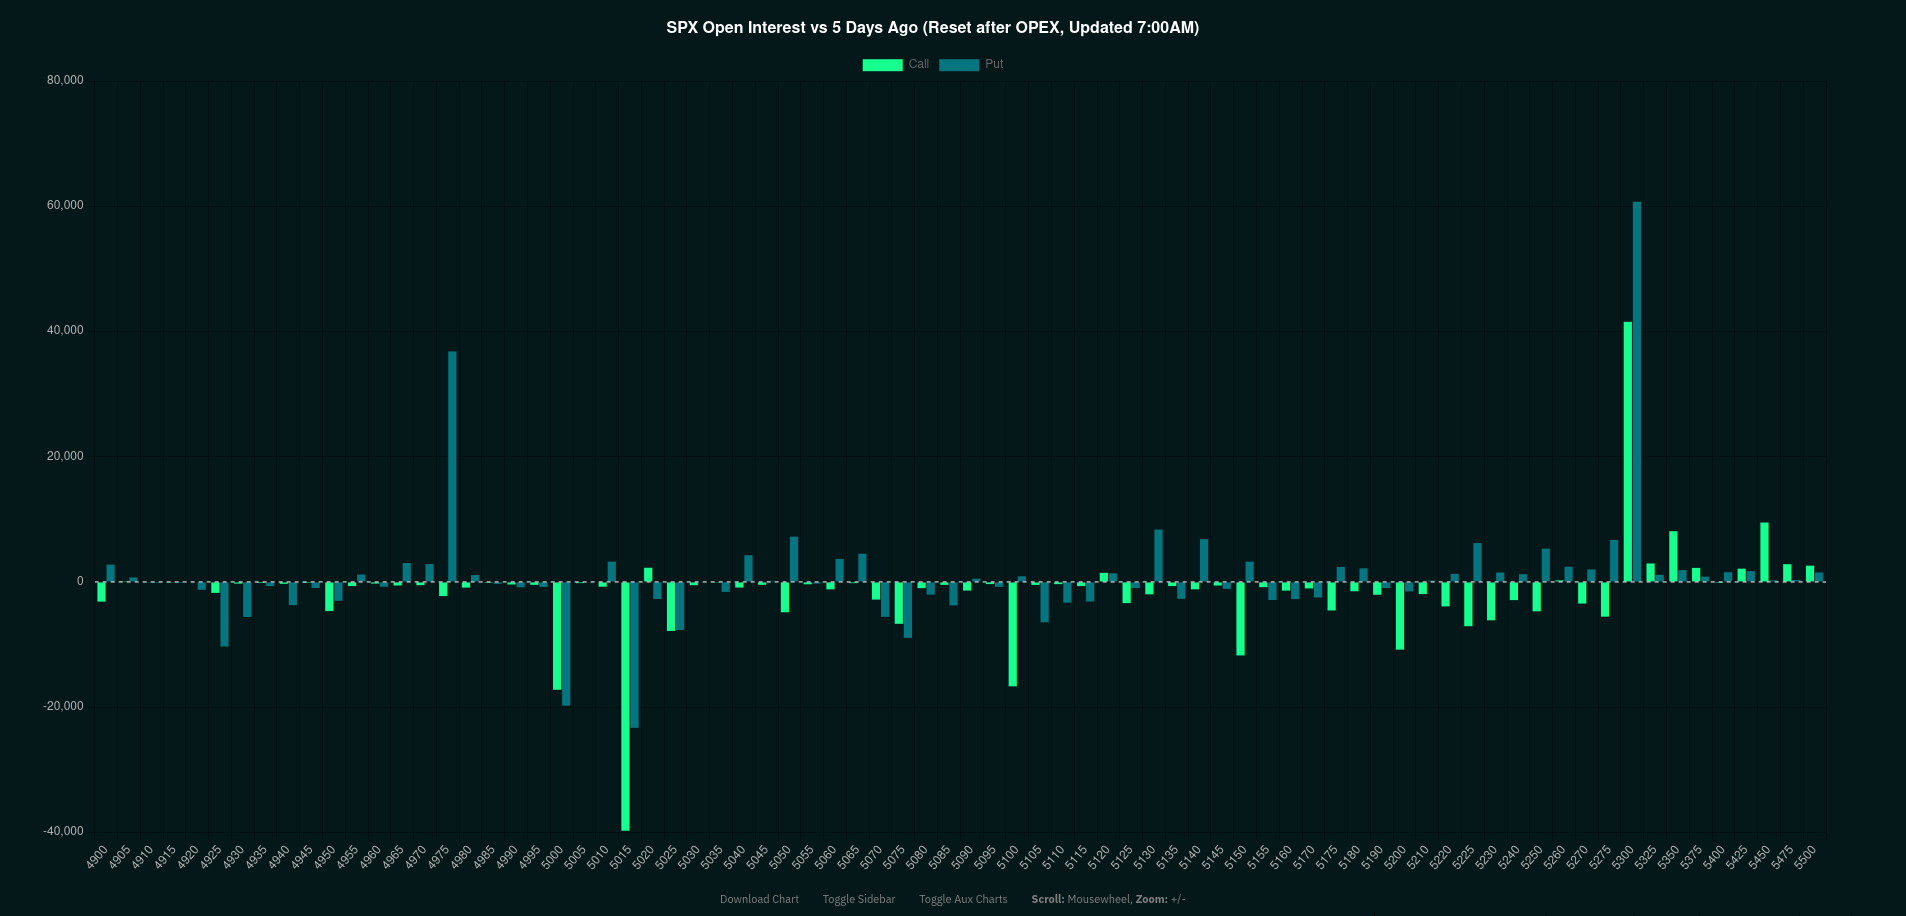
We can also look at how open interest has shifted over the past five days. As a reminder, there are two measurements for options contracts: volume and open interest. Volume tells you how many contracts have moved today. Open interest tells you how many contracts are open at a particular time (based on yesterday's data).
Call and put open interest has spiked at 5300, but it also spiked at 5015 (in the opposite direction. 4975 has seen a burst in put open interest, too.
Institutions
I'll use Volume Leaders for the next few charts as it provides a helpful visualization for seeing large trades made at certain times. Many of these trades, but not all, can be attributed to large institutional investors.
If you see a number inside a circle, it means that the trade is in the top 100 trades ever made on a particular symbol. Orange circles are dark pool trades and blue circles are trades made on an exchange.
First up is SPY. There has been an incredible amount of trading happening from $520-$525. That's about 11M shares traded at the highs, or about $5.8B worth of trades.
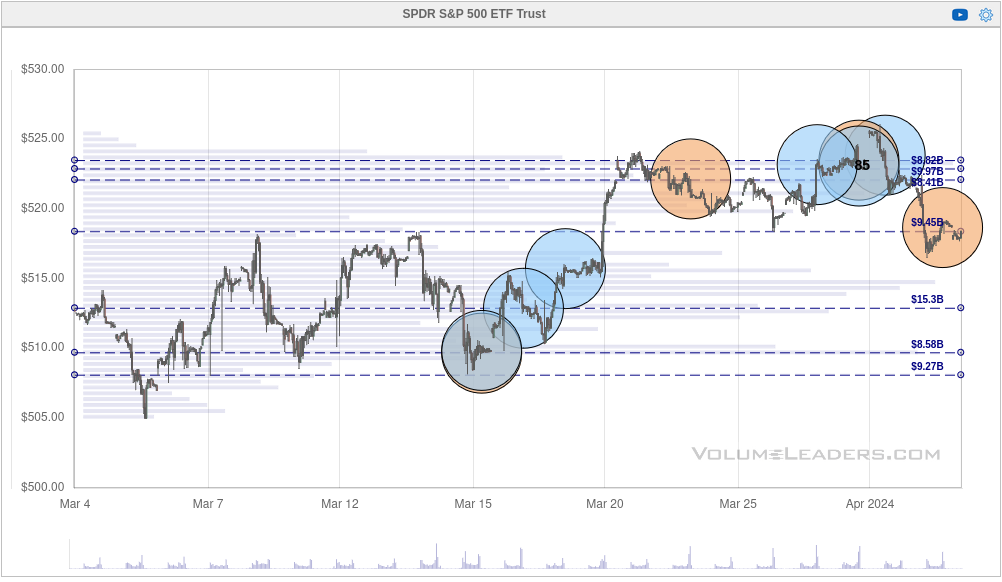
One interpretation here is that institutions took profits or decided to go short. Another interpretation is that they are picking up shares during the consolidation and chop to prepare for another leg higher. SPY's price fell below $520 yesterday and then a dark pool trade of 1.8M shares came in after the market closed.
This is another one of those examples where price consolidates for a while and institutions try to move lots of shares as quietly as possible. It's difficult to tell where SPY might go after the consolidation, but we know it's getting plenty of attention here.
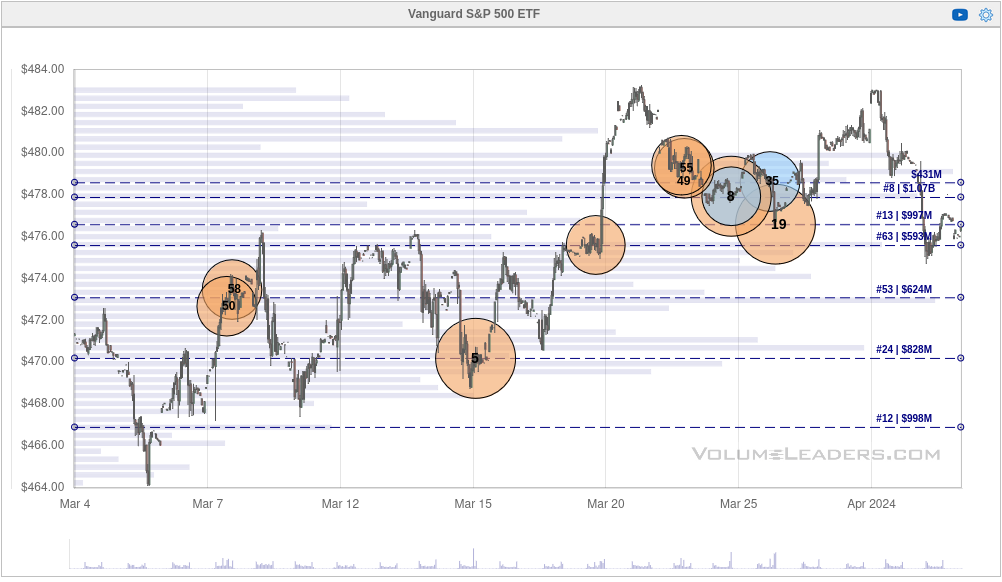
Sometimes institutions like to avoid SPY and use other ETFs, so let's take a look at VOO, the Vanguard S&P 500 ETF. There's plenty of trading happening at the highs here, including a #8 trade with about 1.6M shares traded.
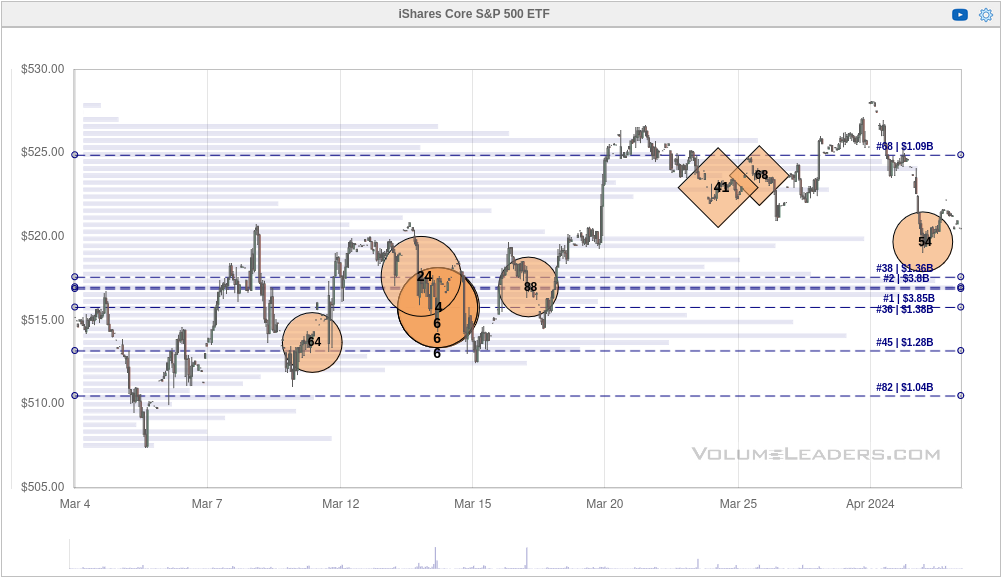
Another ETF is IVV, the iShares Core S&P 500 ETF. We see some similarities here, but the trades at the highs are smaller. One correlation with VOO is that March 14th saw some massive trades and almost all were on dark pools. IVV had a #4 trade along with three trades tied for #6. 👀
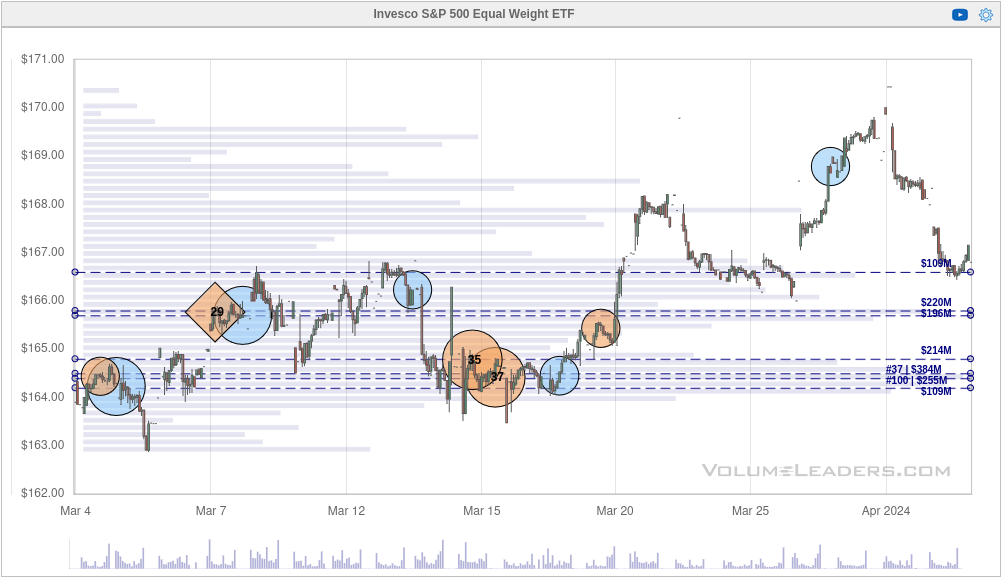
RSP is a bit different since it's a equally weighted ETF where every stock in the S&P 500 gets the same weight. The other ETFs use a market cap weighted structure where larger companies are more heavily weighted. Again, there's plenty of attention around March 15th, but RSP has the least amount happening at the more recent highs.
So let's break this down:
- Institutions were very interested in all of these ETFs, even RSP, around March 14th and 15th with some very large trades.
- SPY, VOO, and IVV had some very large trades at the recent highs since March 20th.
- RSP was relatively quiet at the highs recently.
Could this be a time where the larger stocks in SPY might retreat a little and we see a broader rally among stocks in the S&P 500 that aren't some of the well-known names? It's possible. If we were headed for a serious correction, I'd expect to see RSP getting more attention than it's getting now.
What about volatility?
As a seller of options, I love when volatility goes up because it means I can get more premium in my trades. It's a bit painful when I have trades on already, though. 😉
Let's look at some common volatility ETFs and ETNs:
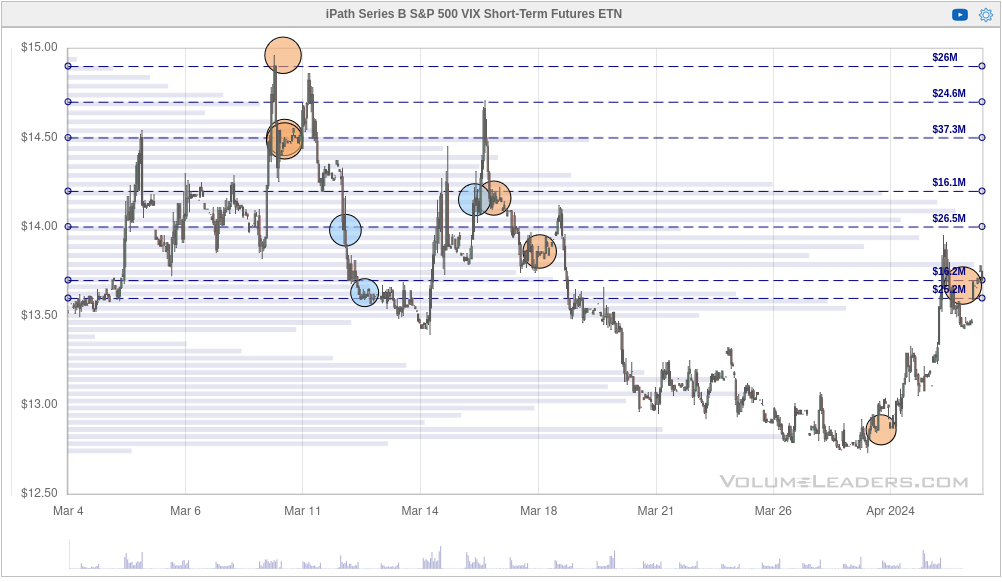
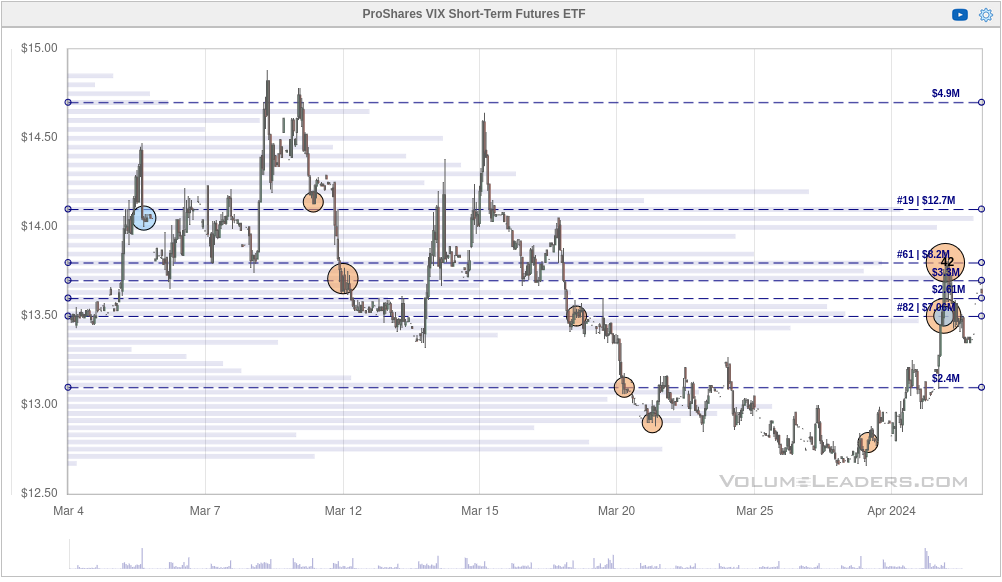

Volatility ETFs and ETNs
All three received some attention yesterday, but VIXY (second chart above) had some large trades. About 325K shares moved as the market opened yesterday, but then a big #42 trade of 555K shares came through at the volatility highs. If you add up the trades made on the move down since March 20th and subtract the big trade at the highs yesterday, it looks like someone has potentially closed their position.
There's one more way to look at it, but it involves looking at a short VIX ETF which might require you to stand on your head. 😉 SVIX is a short volatility ETF, so a rising price means volatility is decreasing and a falling price means volatility is increasing:
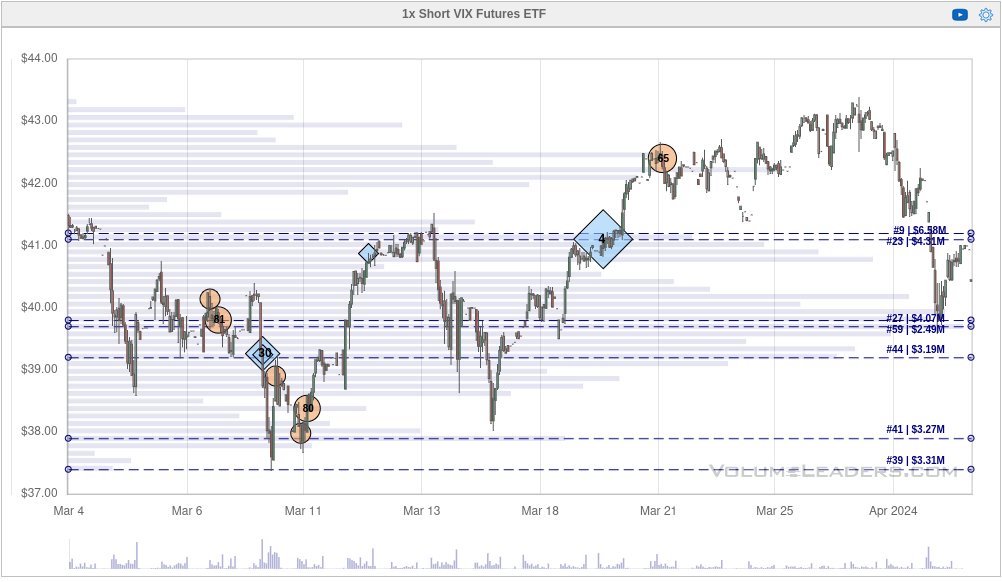
Pretty quiet here. There's a #4 trade made as volatility came down, but it's unclear if that was a closing trade or an opening one.
Thesis
We've had an incredible bull run since last fall and every run has its periods where it takes a breather. Sometimes this turns into a correction where most assets fall, or it turns into a rotation, where money moves from some of the high-flying areas into more of the assets which have lagged for a while. Predicting these can be a real challenge and it's exhausting to attempt to predict it.
Instead, I'm thinking about what I might do if we trade up, down, or sideways.
The gamma flip (where gamma goes from positive to negative, or vice versa) is around SPX 5226. SPX sits at 5201 this morning. When SPX is below the gamma flip level, we often see more volatility and wilder swings like we had yesterday.
My portfolio was full of positive deltas (bullish bias) since January, but I'm gradually moving to more delta-neutral strategies in case we see a sideways move for consolidation. I still have time on my May 17 contracts to ride out some dips in the market but I may convert more of these short puts into short strangles if it looks like we're headed lower for longer.
Good luck to everyone out there this week. 🍀
Discussion