Charts and Coffee for August 6th

It's a great day to dig into some charts and make predictions for the week. ☕

Welcome back to another weekend look at the only two things in the stock market you can depend on: price and volume. They're both found on the stock charts and I like to update my chart analysis each weekend. This sets me up for more efficient trading through the week as I know exactly what levels mean the most.
I'll take a look at AMD and TSLA today. I'll also do a bonus look at SPY!
But first:
All investments come with significant risks, including the loss of all capital. Please do your own research before investing, and never risk more than you are willing to lose. I hold no certifications or registrations with any financial entity.
Let's get to the charts!
AMD
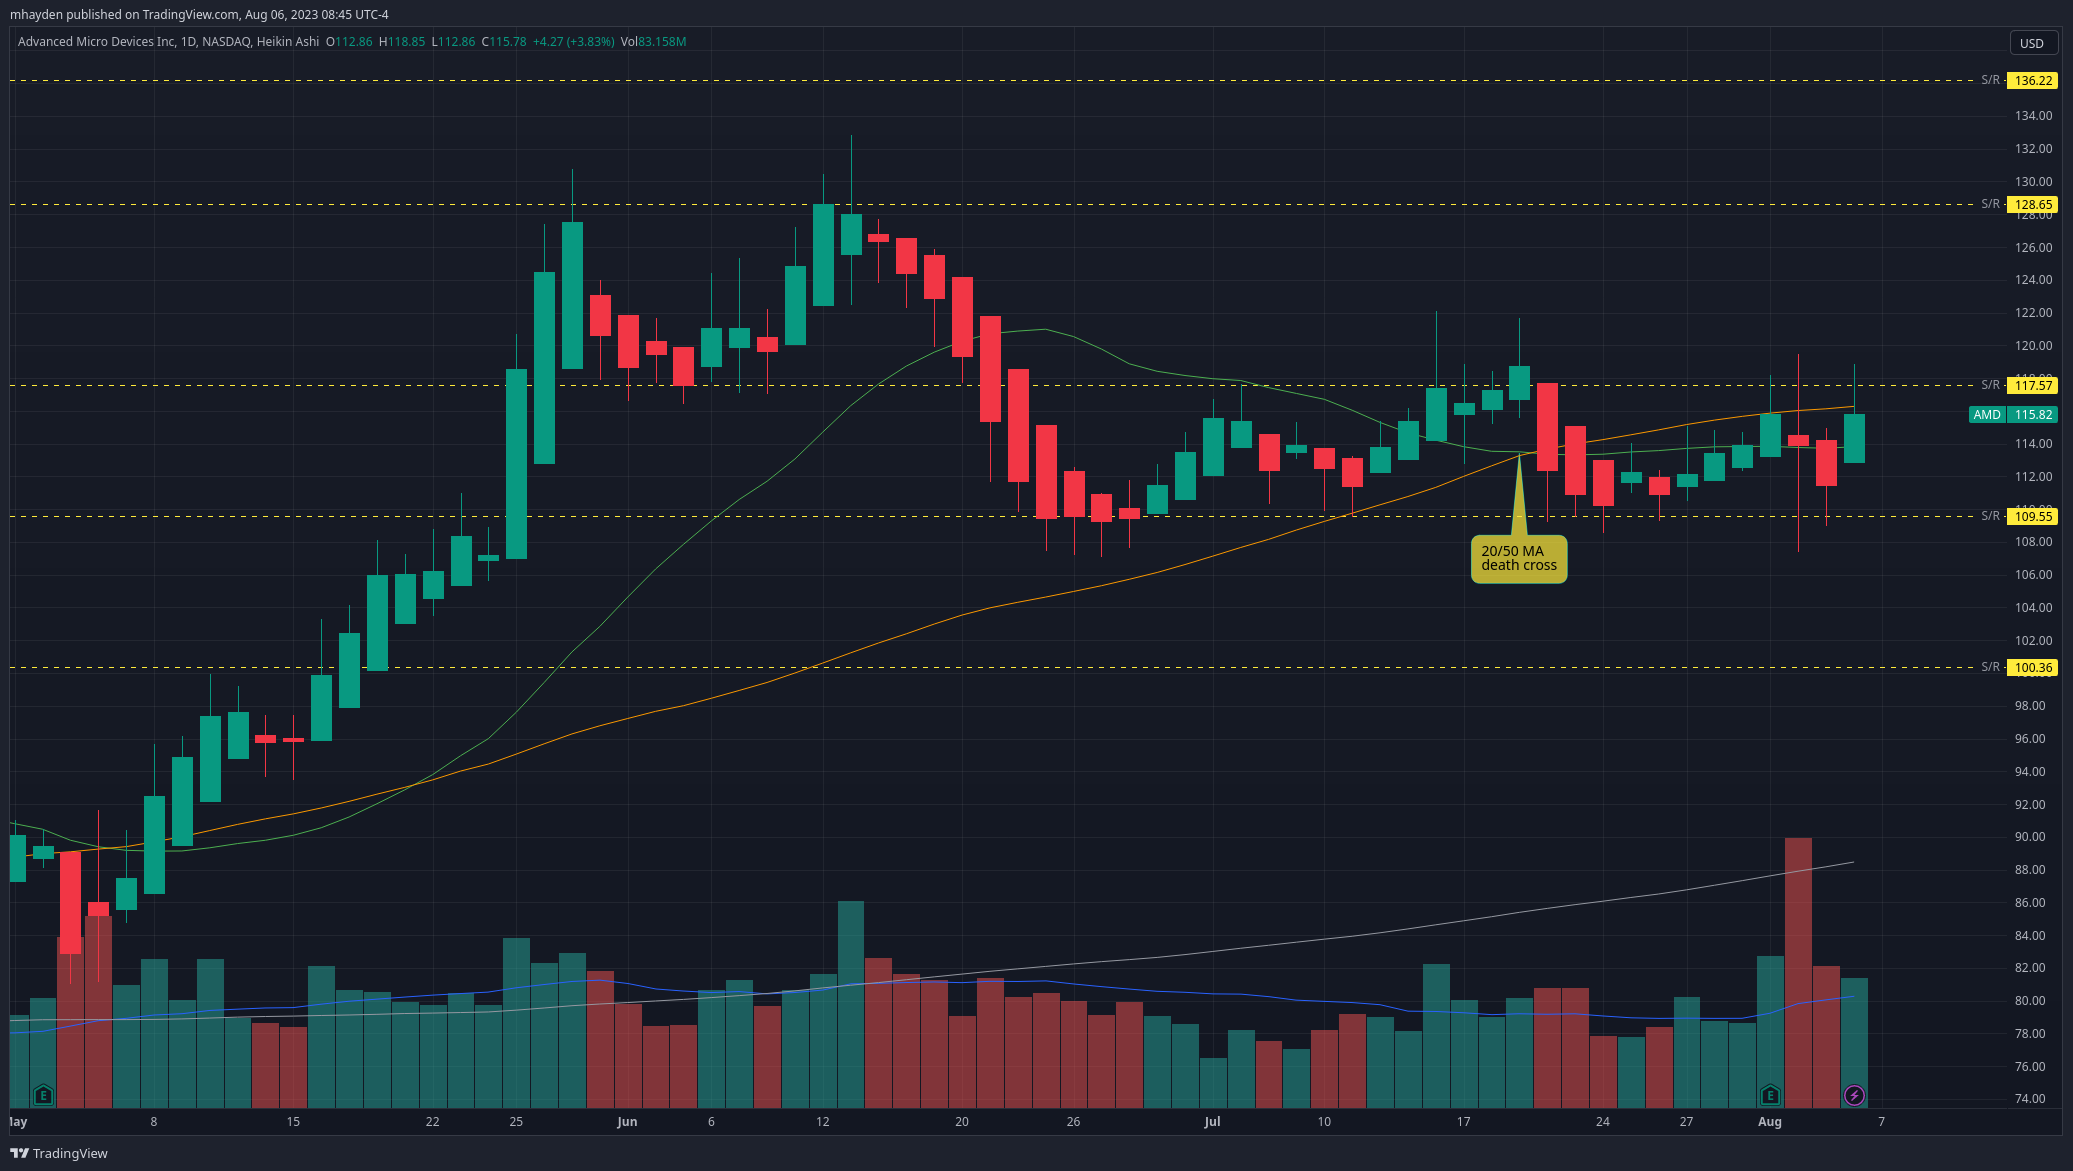
AMD had some volatility this week with earnings and flew through multiple levels within the next 24 hours. However, the big run-up after hours from the earnings quickly turned into a run all the way down to $108 the next day.
This price movement might seem crazy, but AMD has struggled with the zone just above the $117 support/resistance line multiple times. Even earnings news wasn't enough to push it past that level. That drop to $108 seemed way oversold as it sent us through the next resistance level around $109.
What's new from last week?
Both the $117 and $109 support/resistance levels were tested thoroughly last week. Both of them held their ground. AMD continued its consolidation between these levels even with the earnings volatility added in.
Last week's volume from Tuesday-Friday exceeded the 20 day moving average for volume. This leads me to think that there's some genuine interest from traders in moving AMD shares up or down.
How do you think through this chart?
The May 5 rally sent us up into a new channel, but we broke down just below that and we've been consolidating between two levels. The 20MA crossed under the 50MA line and this isn't a good sign for short term trading. I'd like to see the 20 cross above the 50 again to get some confidence that we're finished consolidating and ready to move up again.
On the medium to long term, our 20/50MA lines are well above the 200MA. The 200MA line is still in the upper $80s and our current price is just above $115. More consolidation would buy some time for the 200MA line to move up and form support for price.
Keep in mind that NVDA has earnings on August 23. Before earnings, some traders may use AMD as a proxy bet for NVDA's results since AMD's IV would be lower and options contracts would be less expensive. After earnings, traders might make moves on AMD based on how they think it competes with NVDA, especially in this new world of AI.
We may be seeing more of this consolidation as we await more semiconductor-related earnings data.
TSLA
What's new from last week?
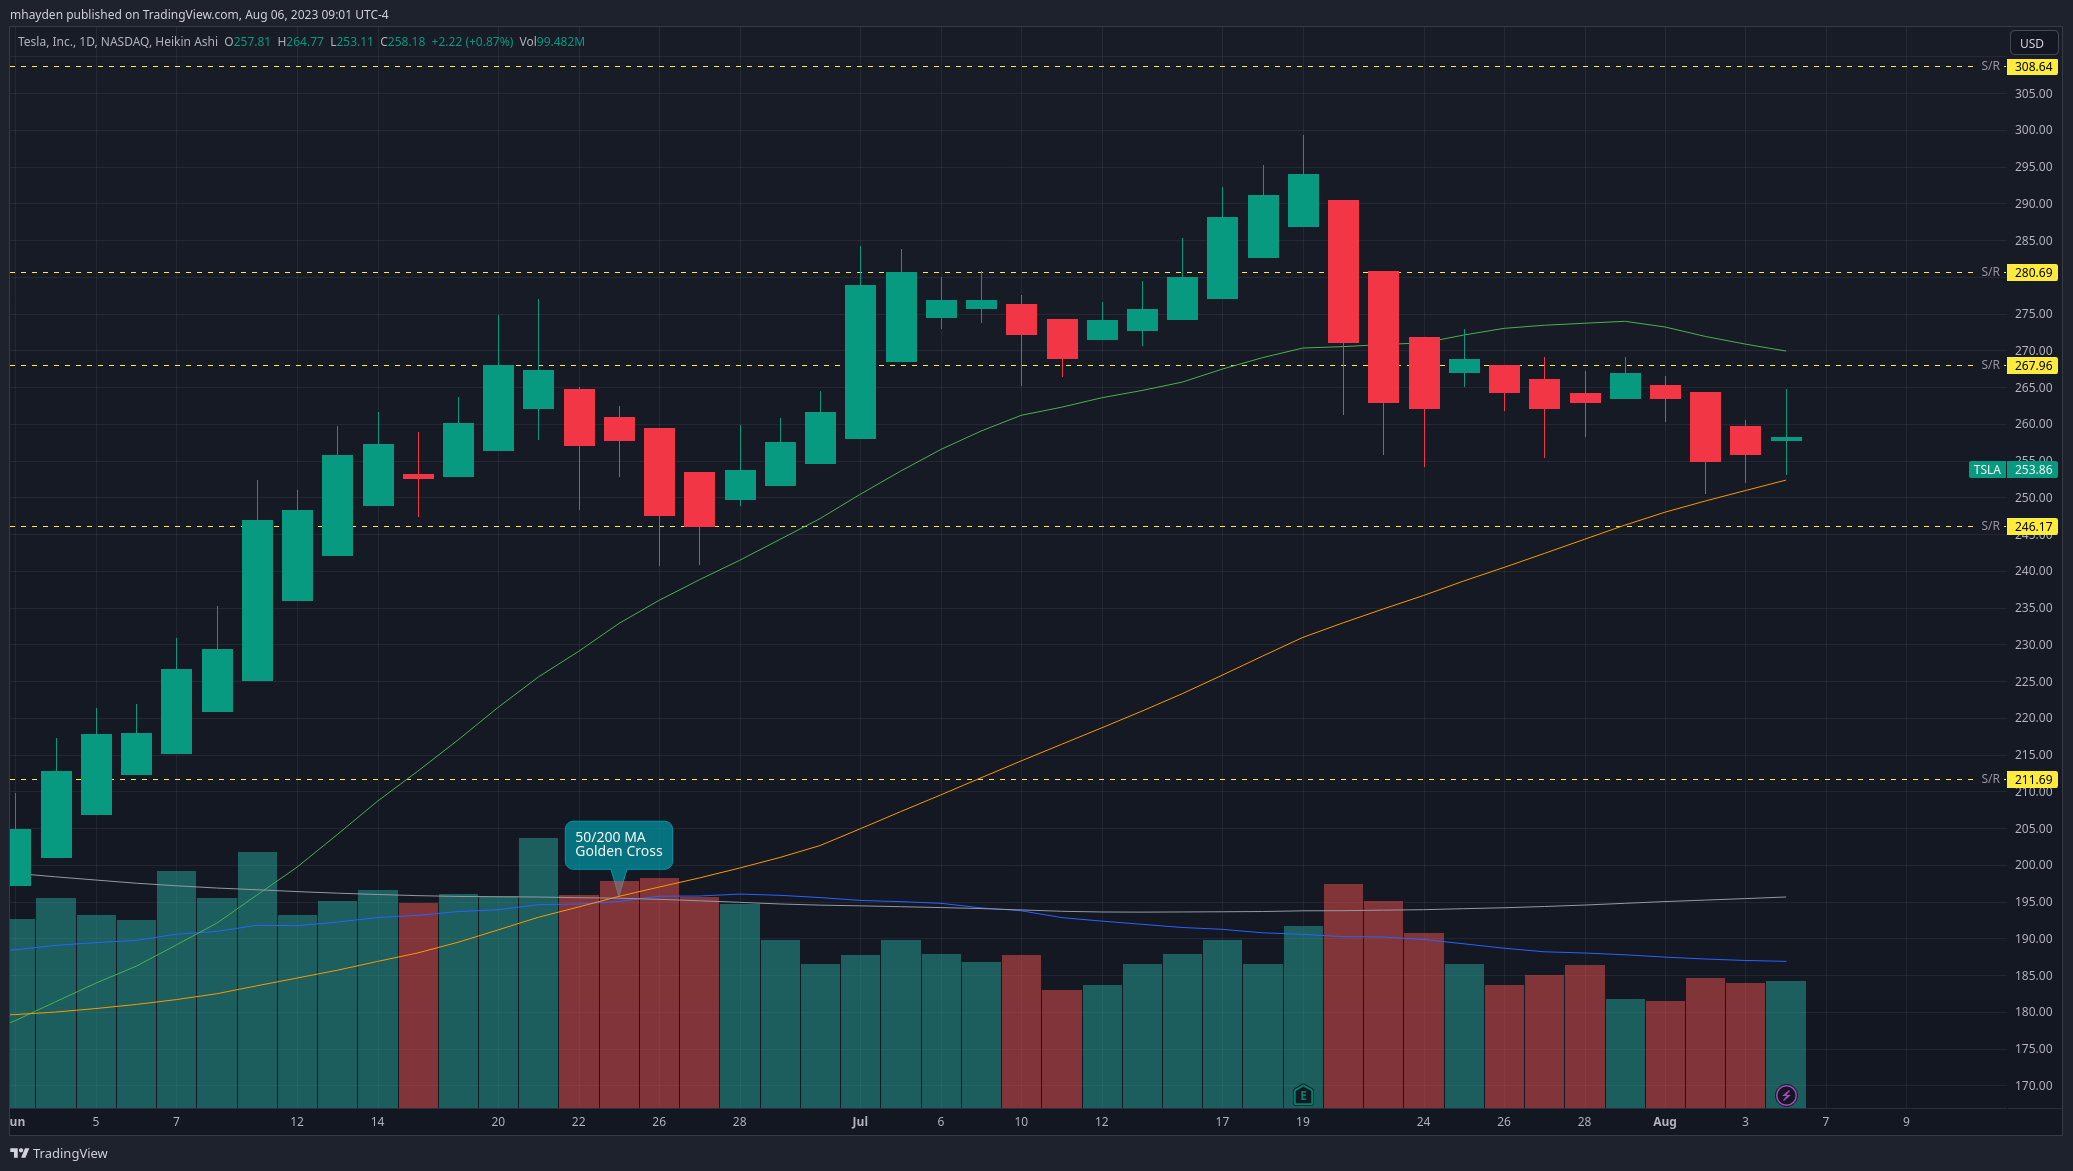
TSLA landed in a new channel that runs from $246-$268 and tested the top of the channel this week. That test failed and now TSLA is nearly resting on its 50 day moving average. It didn't make any sustained strong moves this week, but rather just drifted down like a falling feather.
Volume didn't really confirm the movement in either direction and volume is well below the 20MA. It seems like traders have been much less interested in TSLA since the earnings call. In fact, if you examine volume since the 50/200MA golden cross on June 23, volume has been below average except for right around earnings.
How do you think through this chart?
I like to see volume confirm a trend:
- When volume increases as price makes a strong move, I trust that price movement more. 💪
- When volume is very low as price makes a strong move, I trust that price movement less. 🤔
TSLA's volume simply isn't good. On a highly volatile stock like TSLA where it's difficult to come up with a decent valuation, reduced volume gets me a bit more worried. Price can move in unusual ways with reduced volume, often in ways that are difficult to predict.
This week is a good one to watch the 20 and 50MA lines. It's entirely possible that we see them make a "death cross" this week and that would be a signal of short term weakness in TSLA. Don't count on help from the 200MA line as it's lingering just over $195.
I've taken a bearish tilt with TSLA in my trades lately because I'm seeing too many things that give me a weird feeling:
- Reduced volume
- Price drifting aimlessly at times
- Potential 20/50MA death cross
SPY
Getting a look at SPY is critical before making trades each week because it's a fairly decent representation of the broad market and the most heavily traded ETF. A wise trader once taught me that even the most bullish price moves on an individual stock will take a hit if SPY starts moving down.
What do you notice from the chart?
I'm a "bad news first" type of person, so let's get that out of the way first:
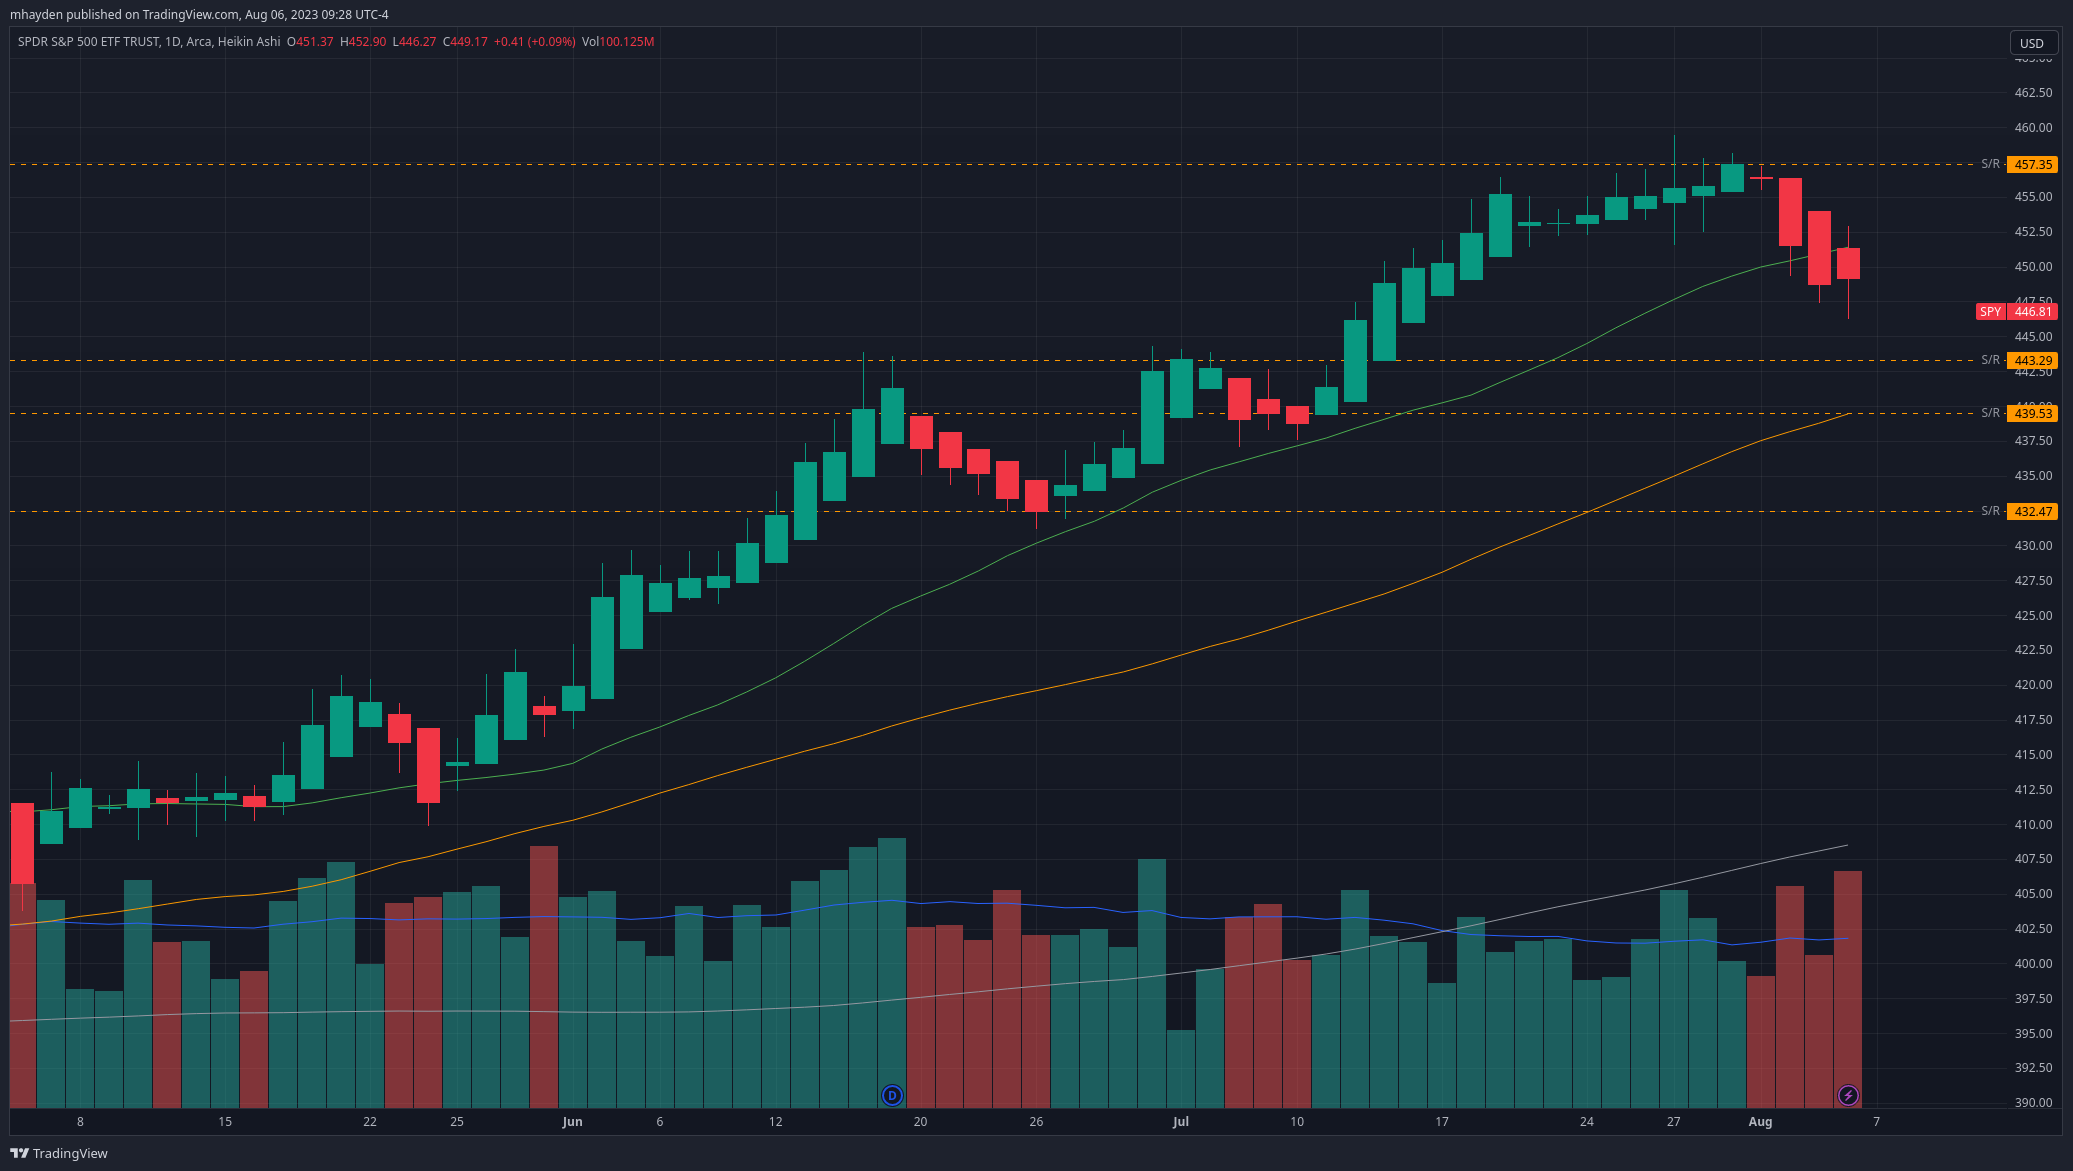
- SPY's price fell through the 20MA last week fairly aggressively and then that line became a point of resistance Friday.
- SPY ran into a resistance level around $457 that it also ran into in early 2022 when it tried to rally during the bearish downturn.
- Two of the bearish days last week were on above average volume.
- The pattern has that "roller coaster rolling over" type of look to me. I get that feeling when I ride a roller coaster and you reach the top just before you fall downhill in a hurry.
There are some good things, too:
- The 20/50/200 MA lines are all stacked well for bullish price movement.
- The recent downturn was blunted Friday. For Heikin Ashi candles, I consider a move down to be a strong one when I see at least three red candles with no wicks on top.
- A correction down to about $443 would likely be close to the 50MA line and we might get support there.
How about other trends?
The thing that worries me most here is that this most recent correction was more abrupt and on higher volume than the last two. June 20th was the start of a fairly gentle five day bearish move which I'd call a "breather." That's healthy in any stock chart. July 8th kicked off a brief three day correction down before the rally began again.
Also, there was a strong rally from July 11th to the 19th where we had non-stop green candles with no wicks on the bottom. However, indecision candles run from July 20th through the 28th. That's a good sign that something is about to change in the overall trend.
Prediction going forward
The short term future of SPY hinges on what happens around the $440-$445 areas. That could potentially bring price down to the 50MA and could bring the 20MA down to cross the 50MA.
Much of SPY's chart right now reminds me of September 2021 when all of the moving averages looked great, but then we started breaking down:

Thesis
I'm leaning bearish on TSLA in the short term and I'm eager to see if AMD can keep consolidating. I have a better short to medium term outlook on AMD than TSLA.
Playing AMD's $109-$115 range has been a blast lately and we finished above the range last week. I'm curious to see if we move into a wider $109-$117 range or if we somehow break through that $118-$120 liquidity zone.
SPY definitely has my attention as we approach the 8/18 OPEX. If it rolls over and breaks the $440-$445 zone, we could be in for some trouble.
Good luck to everyone this week. ☘️
Discussion