Charts and Coffee for July 30 ☕

It's time for charts and coffee! Let's have a look at the only two truth-tellers in the market: price and volume. 📈

Weekends are a great time to focus on the only thing that always tells the truth in the stock market: the charts. Price and volume don't lie. 😉
AMD is up first since it has earnings this week and I'll take a look at TSLA afterwards. There might even be a bonus look at SPY.
But first:
All investments come with significant risks, including the loss of all capital. Please do your own research before investing, and never risk more than you are willing to lose. I hold no certifications or registrations with any financial entity.
It's time for charts and coffee. ☕
AMD
Here's a look at AMD's daily chart for 2023 so far. (As a reminder, I use Heikin Ashi candles because they smooth out variance in the charts and they give me a better idea of trends in price. You won't find any gaps in these charts.)
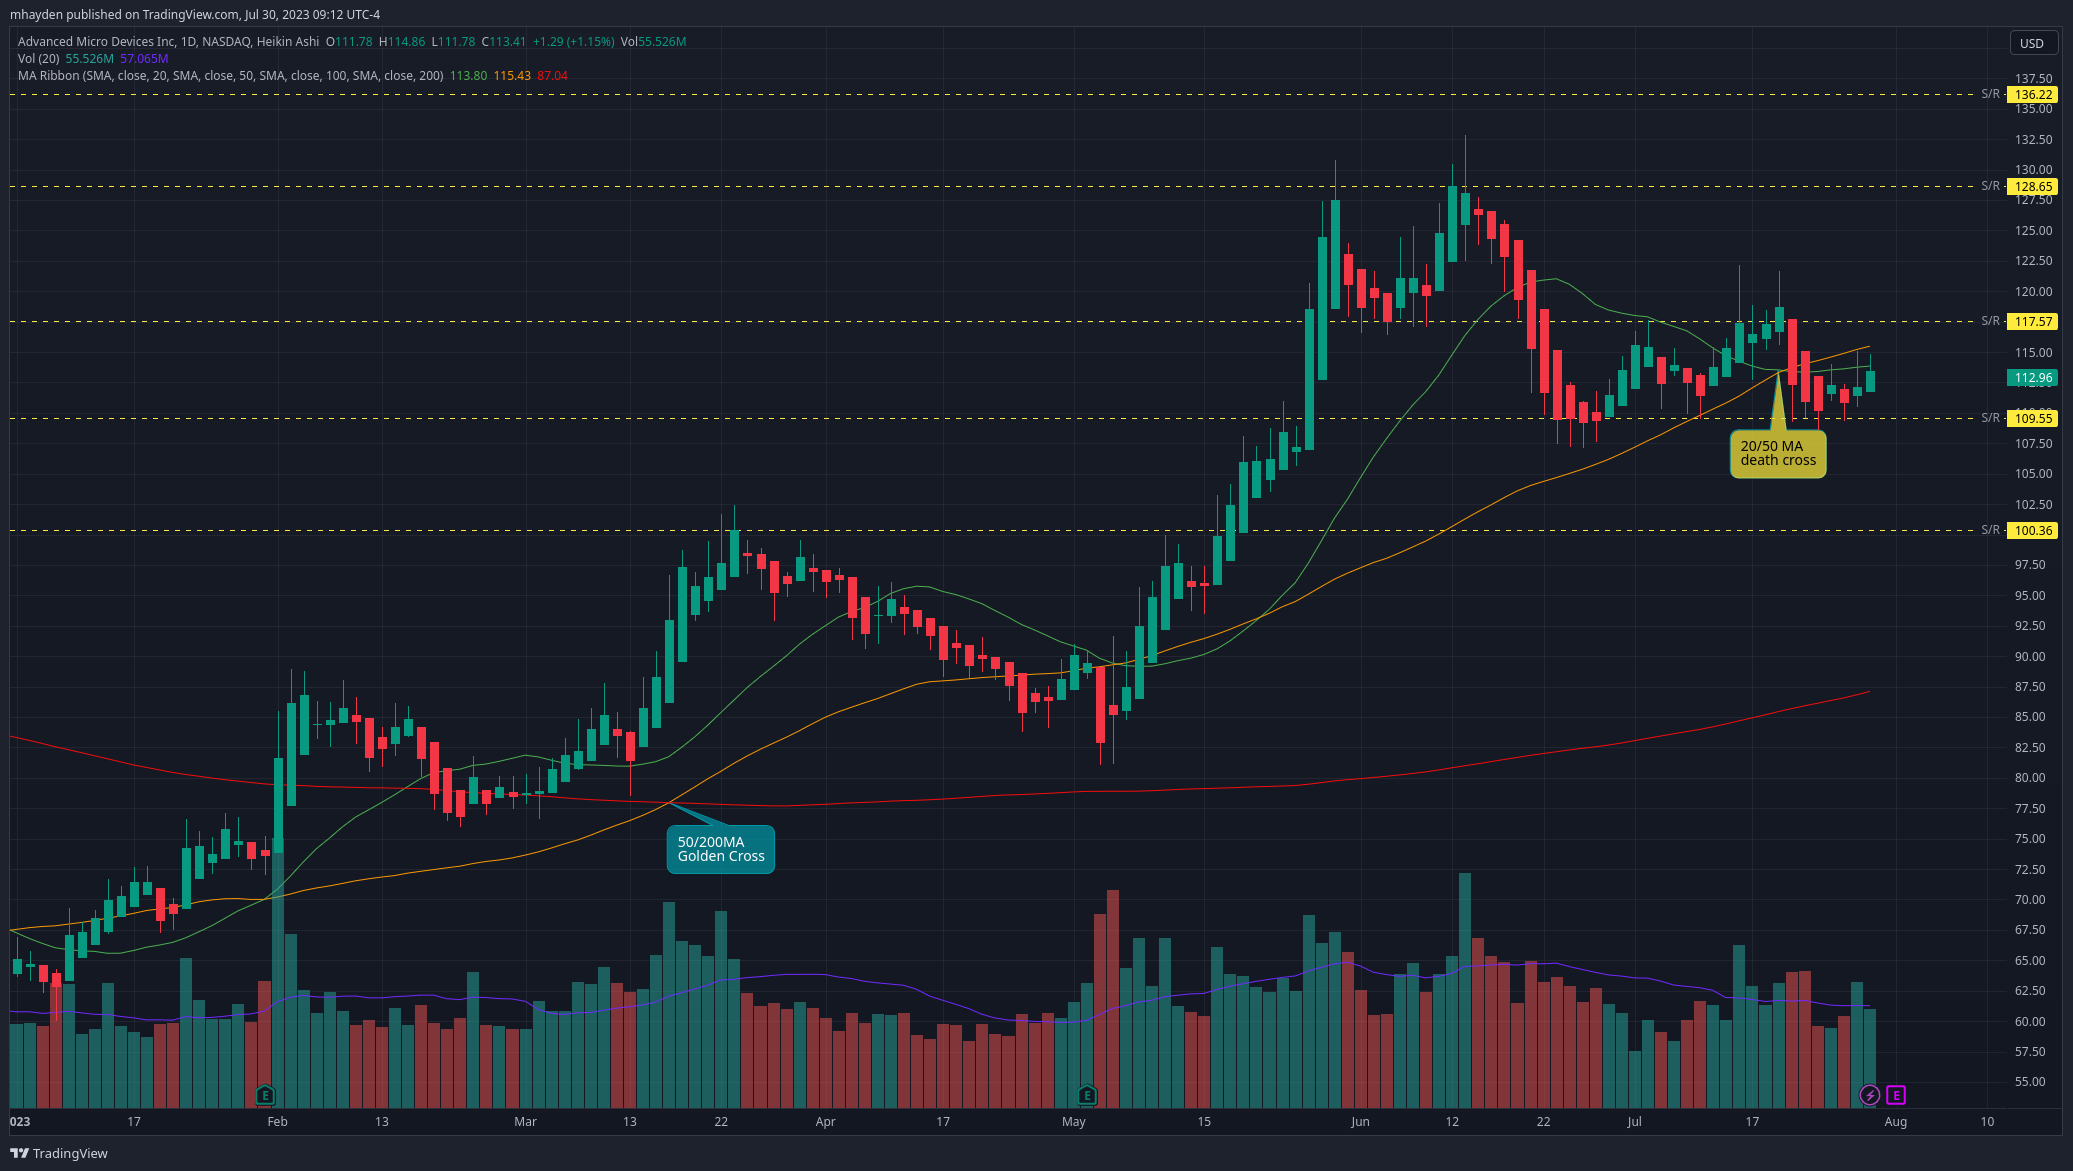
Trends I'm watching
My charts are fairly simple and I usually plot the 20, 50, and 200 day moving averages. We had a golden cross on the 50/200 back in March but we had a death cross on the 20/50 on July 19th. Death crosses are usually a sign of weakness because a short-term moving average crosses underneath a longer term one. 💀
After the 20 crossed under the 50, we began consolidating in a tight range last week from about $110 to $115. Tuesday and Thursday had some indecision from traders but volume was below average last week.
With HA candles, I start to believe in an uptrend when I see at least three green candles that don't have any wick underneath. We had an indecision candle Thursday but Friday's candle is the first of three that I want to see continue into next week.
What did AMD do after earnings recently?
The May earnings call had an abrupt drop the next day that kicked off a massive rally. February's earnings call caused a sharp rise in the stock, followed by some indecision, and eventually a run to $100.
What I'm bullish about
Consolidation is a great sign that price is building out a firm base for a move up. The support at $109 was tested multiple times and we've had good bounces from it lately. We recently fell from about $128 down to $109 and that's close to a 15% retracement.
What I'm worried about
AMD has run into liquidity challenges around $118-$120 and needs some kind of push above that line. That's going to take some volume and earnings news could be a driver for that. Also, the 50 day moving average is well above the 200 day moving average (by $28!) and that feels like quite a stretch.
The last time we had a 50MA extended this far over the 200 was back in late 2021. AMD reached the $160s and the began a rough slide all the way down to the $50s. This was not fun.
More trends
Barchart has a handy page with lots of technical indicators all in one place. Sometimes I use it to check my chart work and see if I'm too biased in one direction or the other. As you might expect, the indicators show short term worries with the medium and long term time frames still looking very good:

TSLA
Here's a daily chart for TSLA for 2023:

Trends I'm watching
TSLA had a golden cross on the 50/200 moving averages back in late June and then corrected a bit after earnings. It's sitting between support/resistance lines around $268 and $246. Last week showed plenty of indecision from traders and volume was below average.
I wouldn't call this price consolidation quite yet, but it seems like we're in a range where traders might have some indecision for a while. We just finished a run from $160 up to $300 but volume reduced just as TSLA touched the $280 level the first time. Outside of earnings, we haven't seen strong volume since June 21.
What I'm bullish about
TSLA's 200 day moving average is just now tilting positive and price is above the 50 and 200 day moving average lines. TSLA could find support in the 50MA around $250 but we will definitely need more volume for that.
What I'm worried about
This chart just screams overextended to me when I look at it. The 50MA is almost $50 above the 200MA and the 50MA is tilted up at a 45° angle. Yes, one might argue that this shows incredible strength, but I see it as a stock that is running too hot. We had indecision candles all week long on relatively low volume.
More trends
If we go back to Barchart for TSLA, we see a fairly bright outlook. Although there's weakening in short term indicators, the long term indicators are still strengthening in places:

SPY
The chart for SPY is absolutely wild:

One thing comes to mind here: wow. We had golden crosses from the 20/50 and 50/200 back in February and we've had a great run since then.
July 11-19 was the last strong run and we've had indecision candles since then. Some of the larger SPY holdings, such as TSLA, have stumbled recently, and that's reflected in the indecision at this level.
All of our moving averages are tilted upwards, which is good, but the 50MA has really extended from the 200. Combined with the indecision candles lately, I get the feeling a correction could be coming. SPY's all time high is just under $480 and that's going to be a big resistance level once we get there. The big question is: will we get a correction before then?
As you might expect, Barchart's indicators are all looking very bullish:

My approach to this week
As always, I'll be looking through options data and dealer positioning tomorrow to see what moves I'll make on AMD and TSLA. I'm going into this week with long shares of both stocks.
AMD's recent consolidation, TSLA's stumbles, and SPY's flurry of indecision candles have me taking a "wait and see" approach to the week. I was left holding the bag last year with some buys at the top in late 2021 and I certainly won't forget that.
Good luck to everyone this week. ☘️
Discussion