Charts and Coffee for September 4 ☕

Let's dig into the SPY chart for this week's charts and coffee. ☕

Welcome to another edition of charts and coffee where I sit down to examine the two things in the stock market that always tell the truth: price and volume. Both of these are found on any stock chart. 😉
All investments come with significant risks, including the loss of all capital. Please do your own research before investing, and never risk more than you are willing to lose. I hold no certifications or registrations with any financial entity.
Let's get rolling!
SPY
First off, let's pull back for a weekly look with Heikin Ashi bars and some basic moving averages (20/50/200):
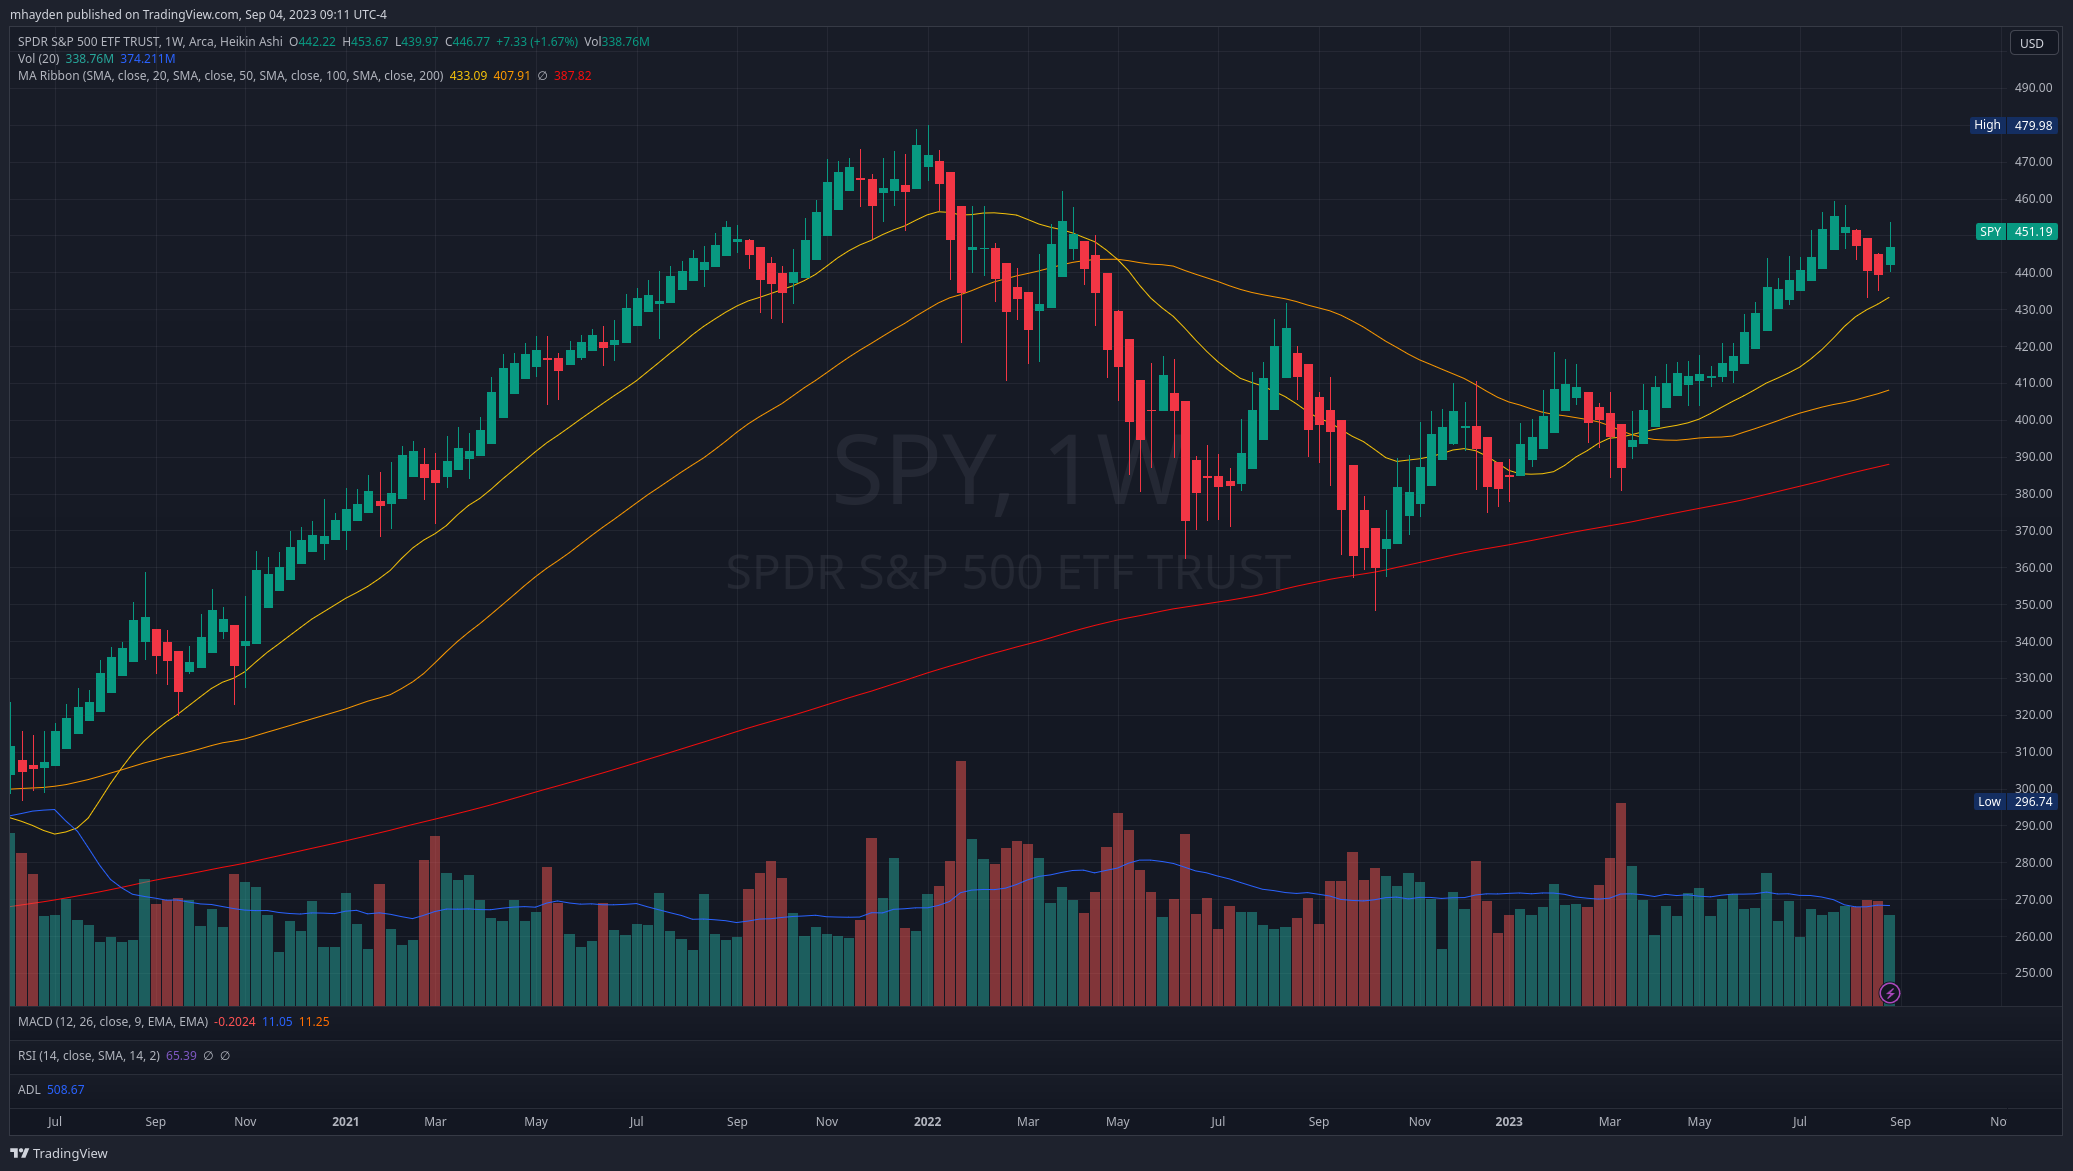
At a high level, I notice that we bounced off the 200MA back in the fall and the 20/50 lines formed a golden cross (bullish) back in March. Volume held relatively steady over since the cross, but it has drooped a bit in the last few weeks.
That could be a bit of seasonality kicking in as school starts again and people finish up summer vacations. Or, it could be a sign that this price level might be reaching a critical spot. $457 was our most recent high and we finished the week just over $451. That level could be resistance for us now and some traders might be pulling back some trades.
The recent drop looks like it ran down to the 20MA and bounced right off of it. This is yet another good reason to check the weekly charts every so often just to see things on a broader basis. Daily drops sometimes look awfully scary but then they barely appear on a weekly chart.
Let's examine the daily chart:

SPY broke the 200MA back in March and has hugged the 20MA line fairly well until August. We had a death cross (bearish) with the 20/50 MA lines in August, but the latest price action has crossed both lines again. $457 should be an interesting spot since this is our most recent high.
We have five HA candles in a row with no wicks on the bottom and that signifies a strong rally. However, volume has trailed off towards the end of the week and the bars are shrinking.
Let's take a deeper look at the recent price action:
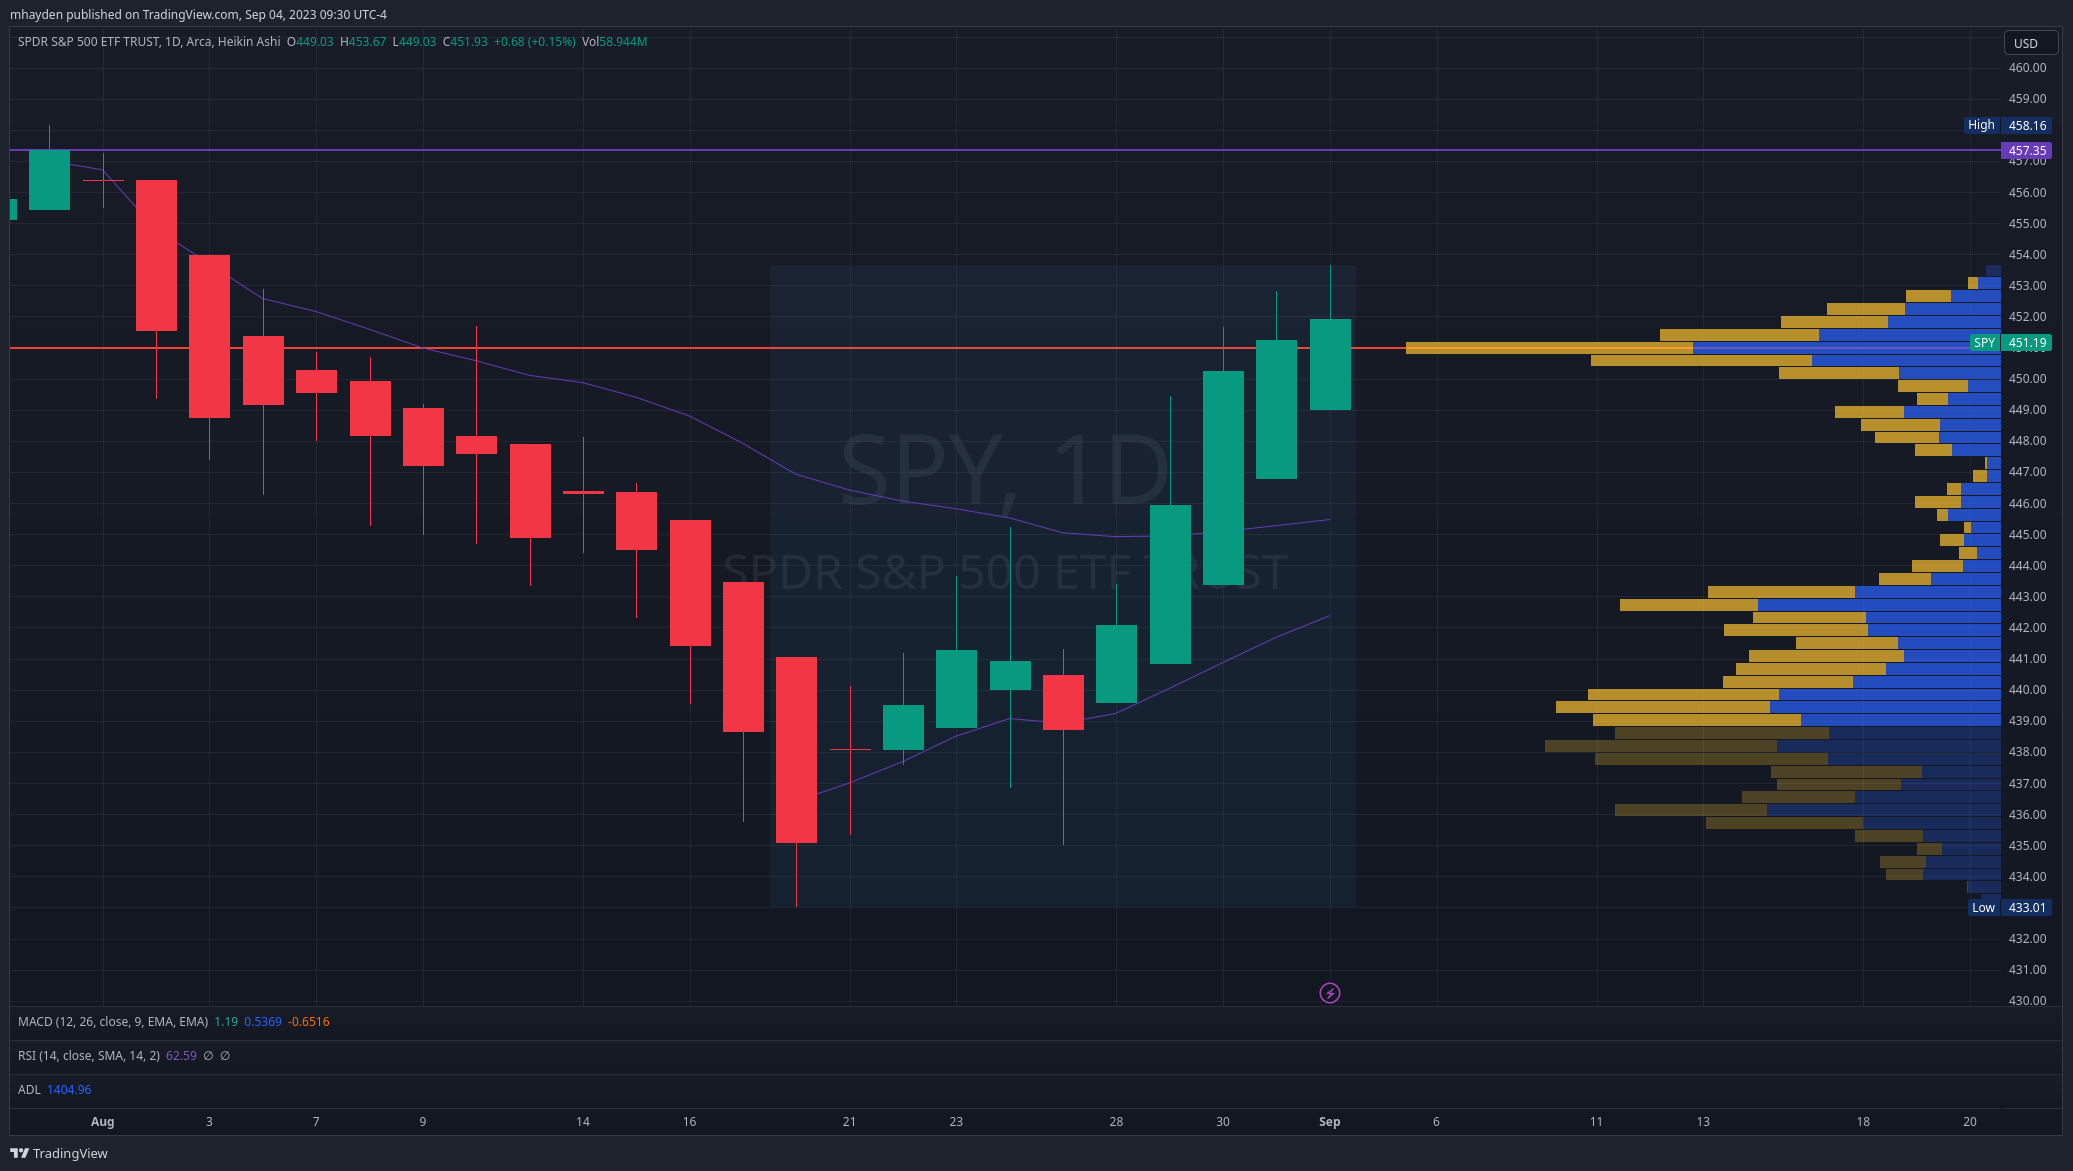
I removed the moving averages and added two VWAP lines along with a volume by price (VbP) indicator.
Looking at the VWAP lines first, we bounce off the lower VWAP line really well and broke through the VWAP line that came down off the recent high. these are both really good signs because they show us that we're moving up in price with decent volume to confirm it.
The VbP prices on the right side show where the largest areas of volumes occurred at various price levels. The longer the bar, the higher the volume at that price level. Areas with long bars are called "volume shelves" and they can act like resistance or support.
The biggest level is $451 by far and that level is quite sharp relative to the ones around it. This leads me to think that $451 is our launching point for a decent move. It's difficult to tell whether that move is up or down.
Look lower from $437 to $440. That's a high volume area but it is much more evenly distributed across multiple price levels. My takeaway here is that we have some decent support down here in case of a correction.
You might be wondering about $444-$450 where there's barely any volume. In these areas, you can see price move quickly because there isn't a lot of trading volume in these areas.
Finally, let's check a few other indicators:
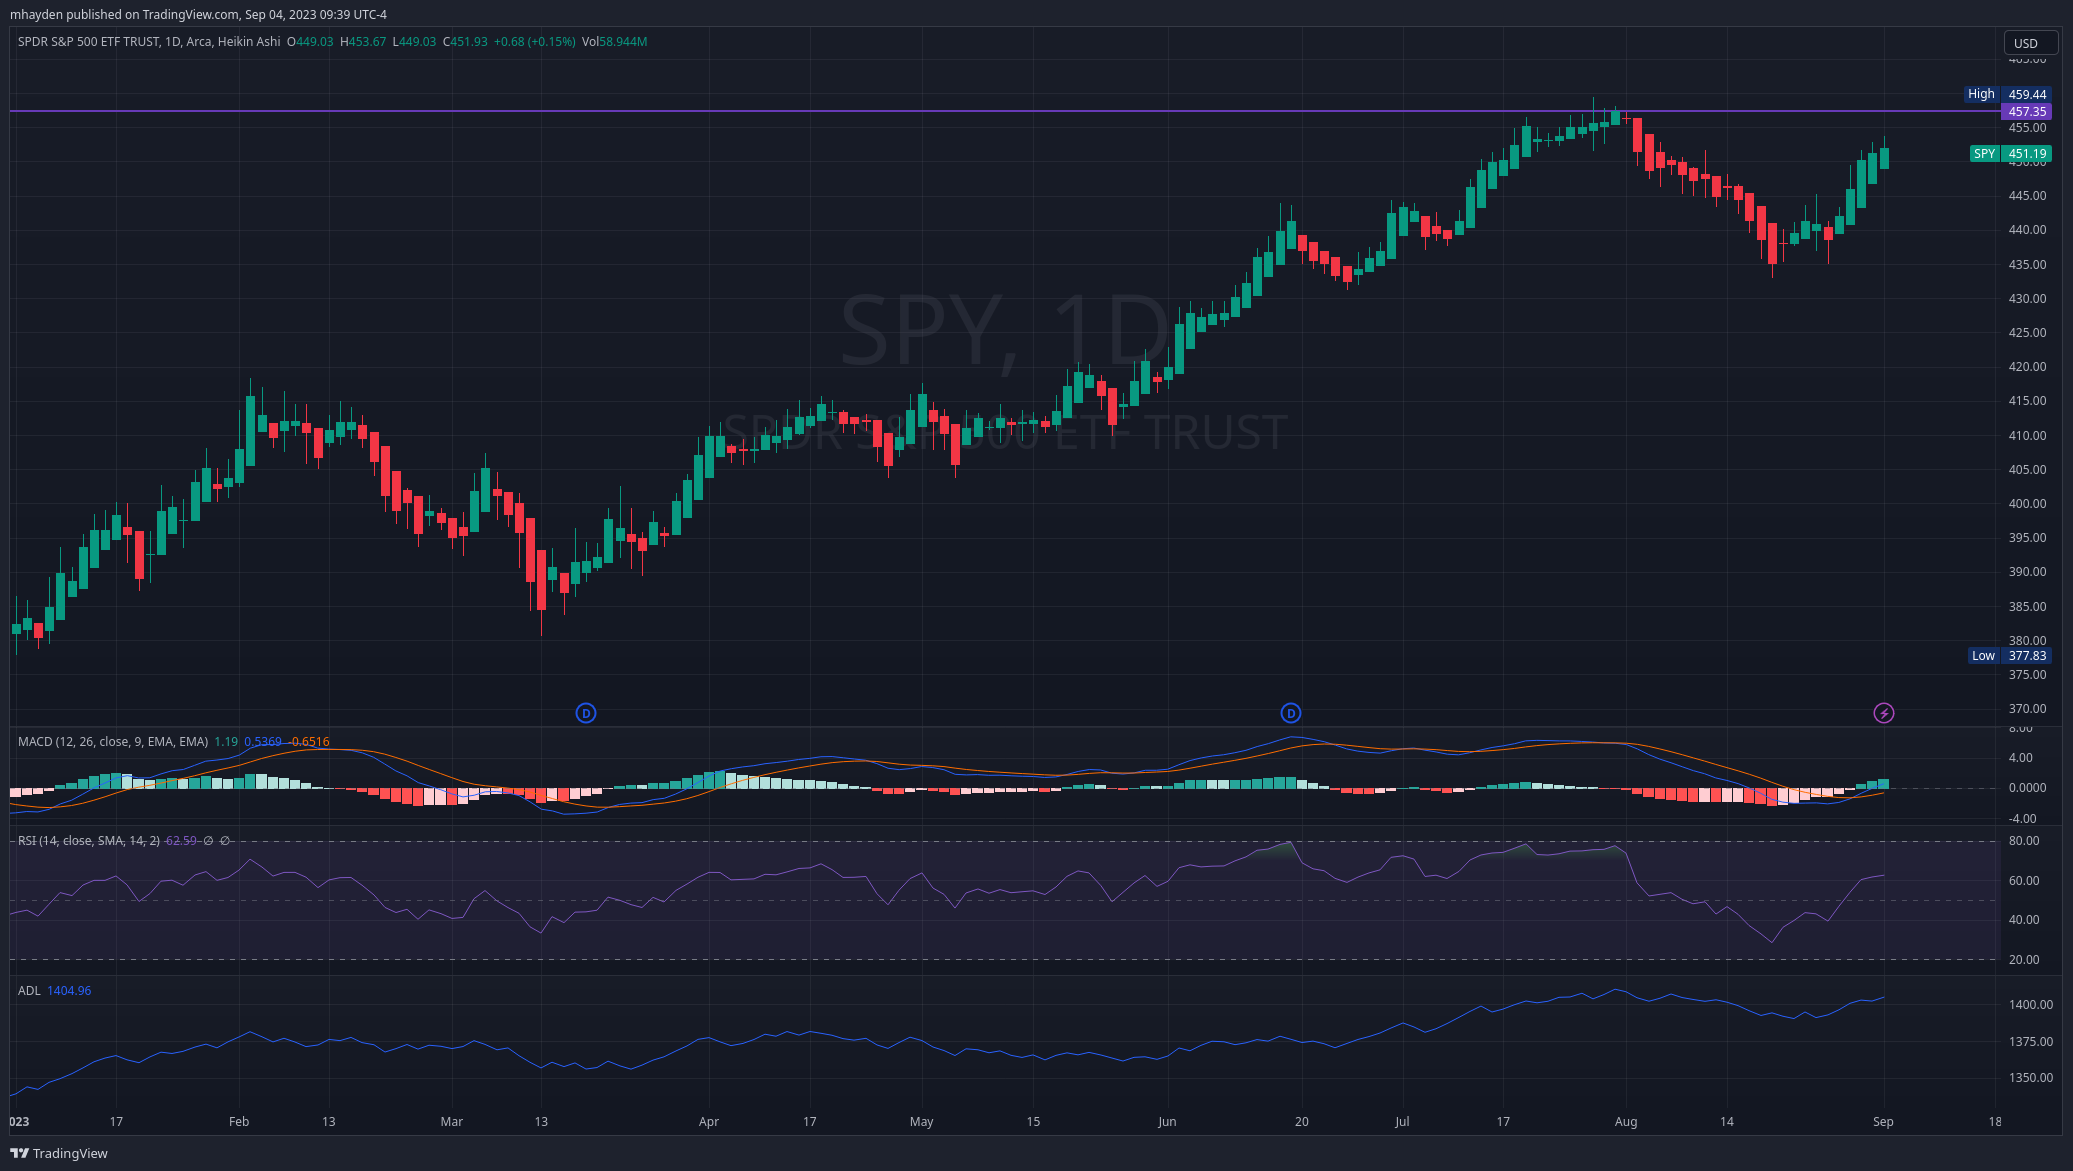
I have enabled the MACD, RSI, and ADL indicators here to see if there's something I missed.
- The MACD fast line crossed above the slow line and the histogram showed a few green bars last week. This is a bullish sign.
- RSI sits just over 62%. This suggests to me that SPY is running slightly hot (overbought) but that it has some strength. SPY typically does not like exceeding 70% for extended periods. As an example we went above 77% just before turning downwards in August.
- Finally, ADL showed a turn upwards around August 24, which shows that more stocks in the market were advancing (price moving up) than declining. That turned bullish a day before SPY began its most recent rally.
Conclusions
Making a bullish argument is fairly easy here. Indicators are all leaning bullish, volume is keeping up with the price movement, and we've broken the VWAP since the most recent high. The weekly chart shows all moving averages headed up with the price still above those lines. The weekly 20/50 golden cross remains in play since March.
We could make bearish arguments as well.
We had a 20/50 MA death cross on the daily recently and although volume supports the price movement on a longer timeframe, the daily chart shows volume decreasing last week. Volume around $451 is strong, but it's very sharp and there's not much support around that level. This could lead to a situation where SPY is teetering on a fence and is able to fall on either side of $451.
Let's play both sides to be prepared:
- If price comes down, it's likely going to run into support from $436-$443. The 20MA daily is down there as well.
- If we lose $436, our next stop could be in the $410's from the moving averages, but that would be a surprise.
- If the price rallies further, $457 is our next area of resistance from our recent high. I'd like to see more volume in the upport $440's and lower $450's to confirm this.
Good luck to everyone this week. I'll check in on options data tomorrow morning. ☘️
Discussion