Charts and Coffee for September 24

Let's dig into SPY, AMD, and TSLA charts to get a deeper look at price and volume. 📈

Welcome to another edition of Charts and Coffee! 👋 This one is coming in a bit late in the day, but I can easily drink a cup of coffee at any time of day.
In this post, we round up all the data we can find in the charts to see where our favorite tickers might be headed. I'm gradually adjusting my trades to expiration dates a little further out to give myself more time to be right amid all of this chop in the market.
But first:
All investments come with significant risks, including the loss of all capital. Please do your own research before investing, and never risk more than you are willing to lose. I hold no certifications or registrations with any financial entity.
Let's get started!
SPY/SPX
I normally do a lot of this myself, but one of my trading friends shared a link to a weekly series from Ciovacco Capital Management and he does a superb job of looking at where SPY (and the market in general) is right now versus downturns of the past:
My takeaway from the video is that the current downturn doesn't seem out of step with previous patterns and there doesn't seem to be a reason to panic right now. I like how the video steps through plenty of comparisons of today's charts to some challenging events in the past.
AMD
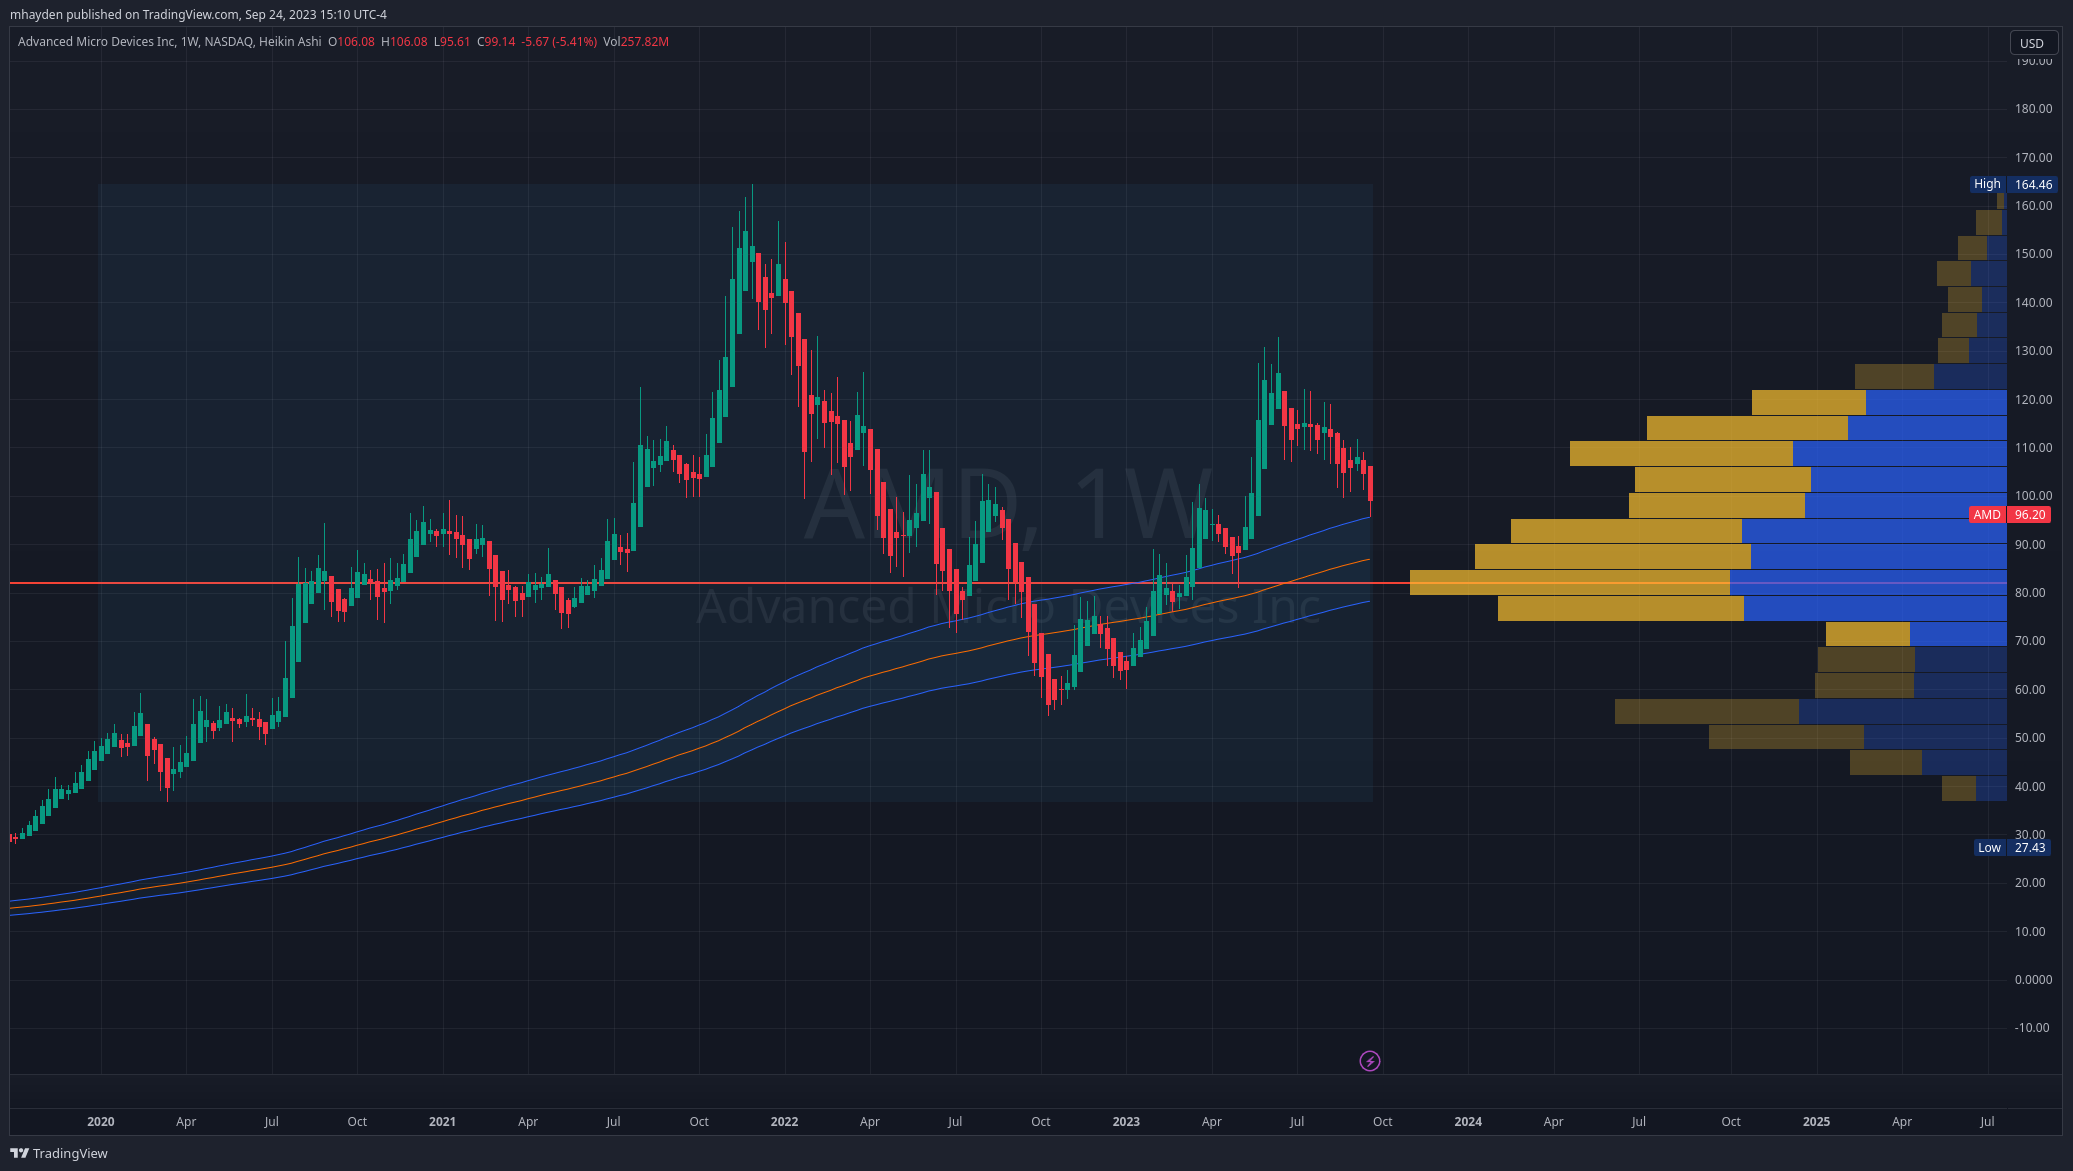
In the weekly chart below, a few things stick out to me:
- AMD's highest volume since 2020 is around $82.
- The 200MA (weekly) envelope is tilted upward and expanding. Price action this week brought AMD down to the 200MA envelope just barely and then it closed above that level.
- The 200MA sits at $86.78 this weekend and AMD closed Friday around $96. The top of the 200MA envelope is $95.46.
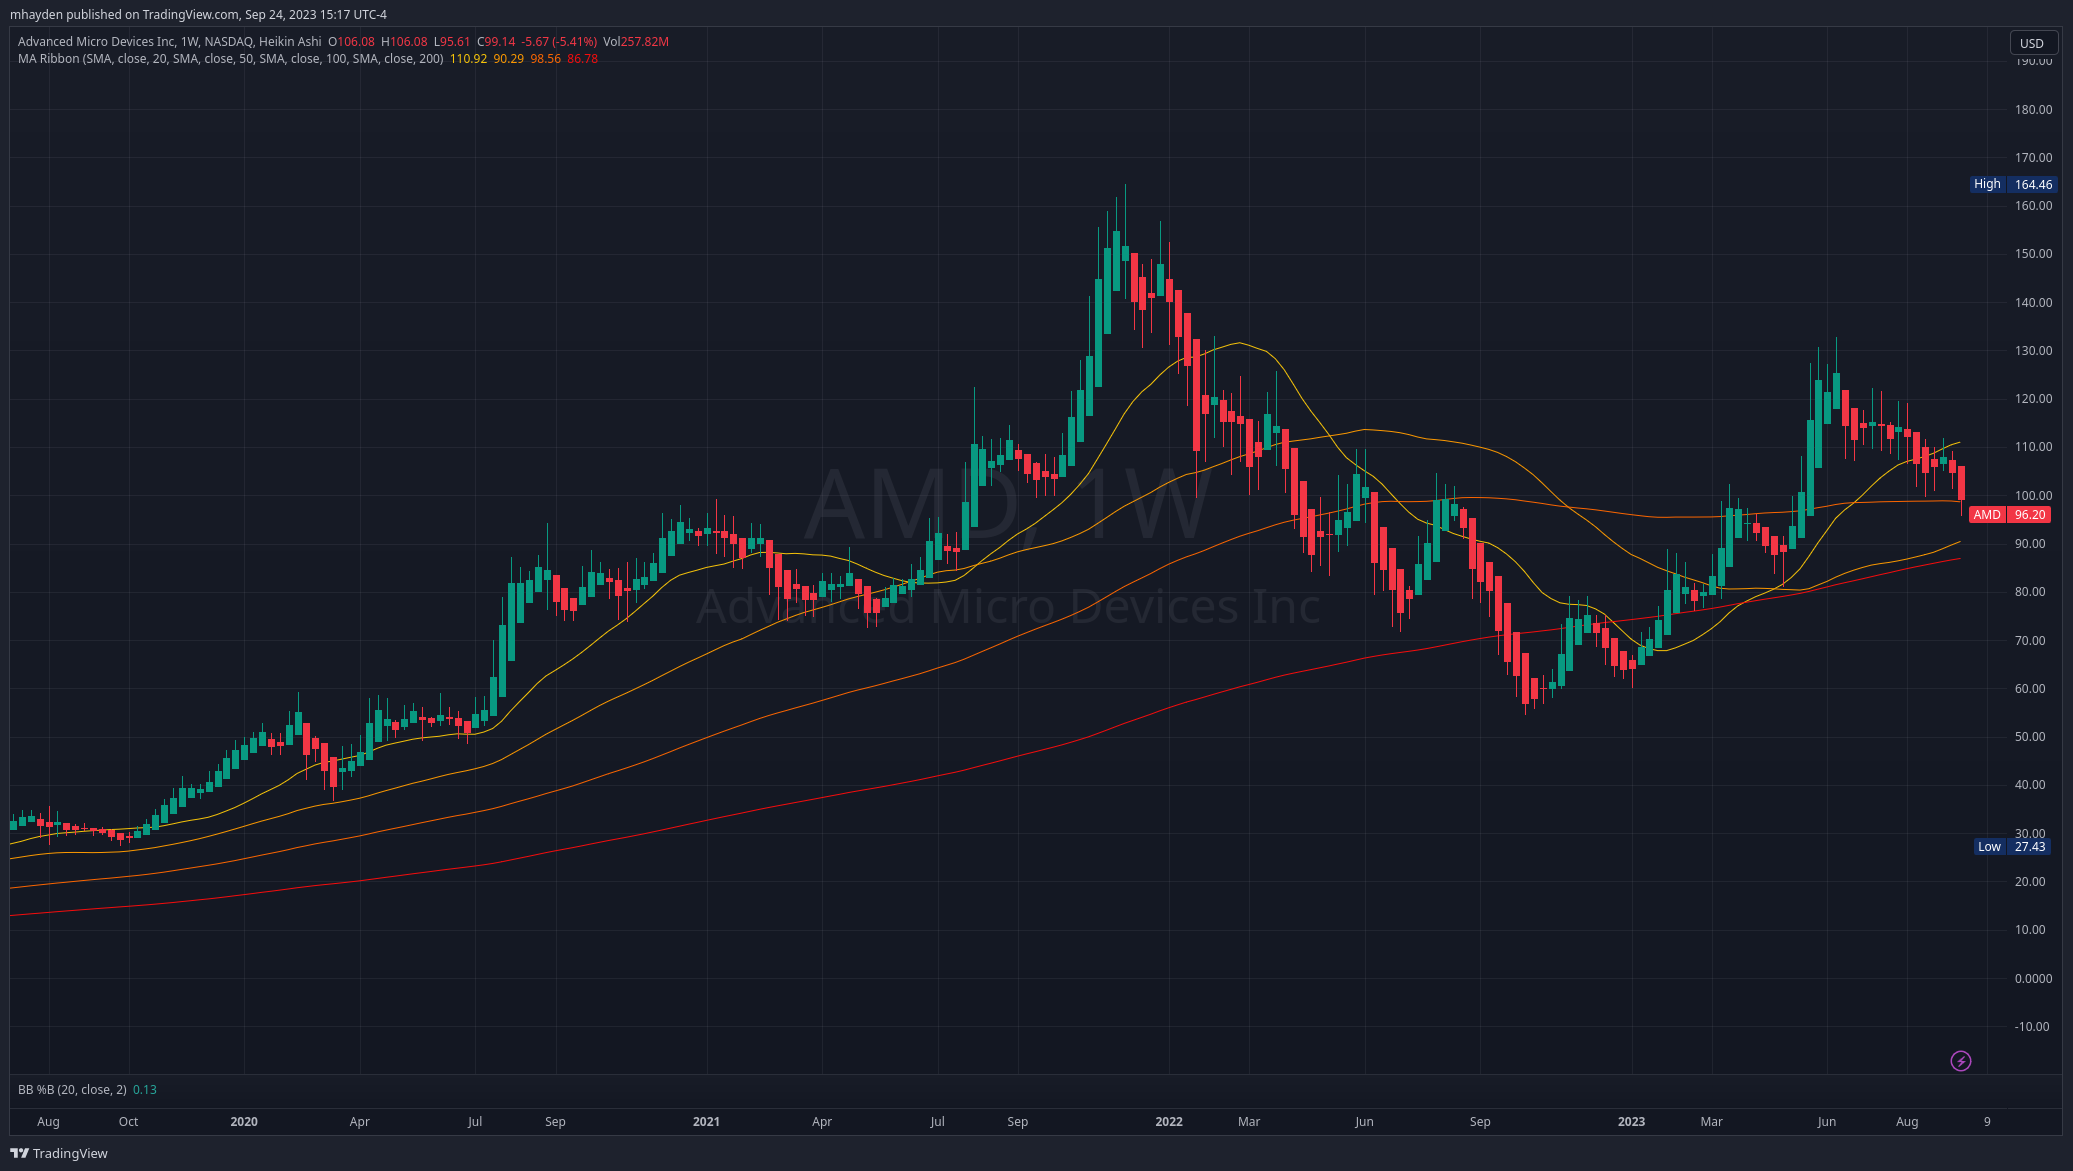
Moving average ribbons also tell an interesting story on the weekly chart. I'd normally like to see these stacked top to bottom as they were in late 2021, but we're in a situation now where the 50MA is below the 100MA. All moving averages still point upwards except the 50MA, which is good. This points to some medium-term weakness potentially for AMD.
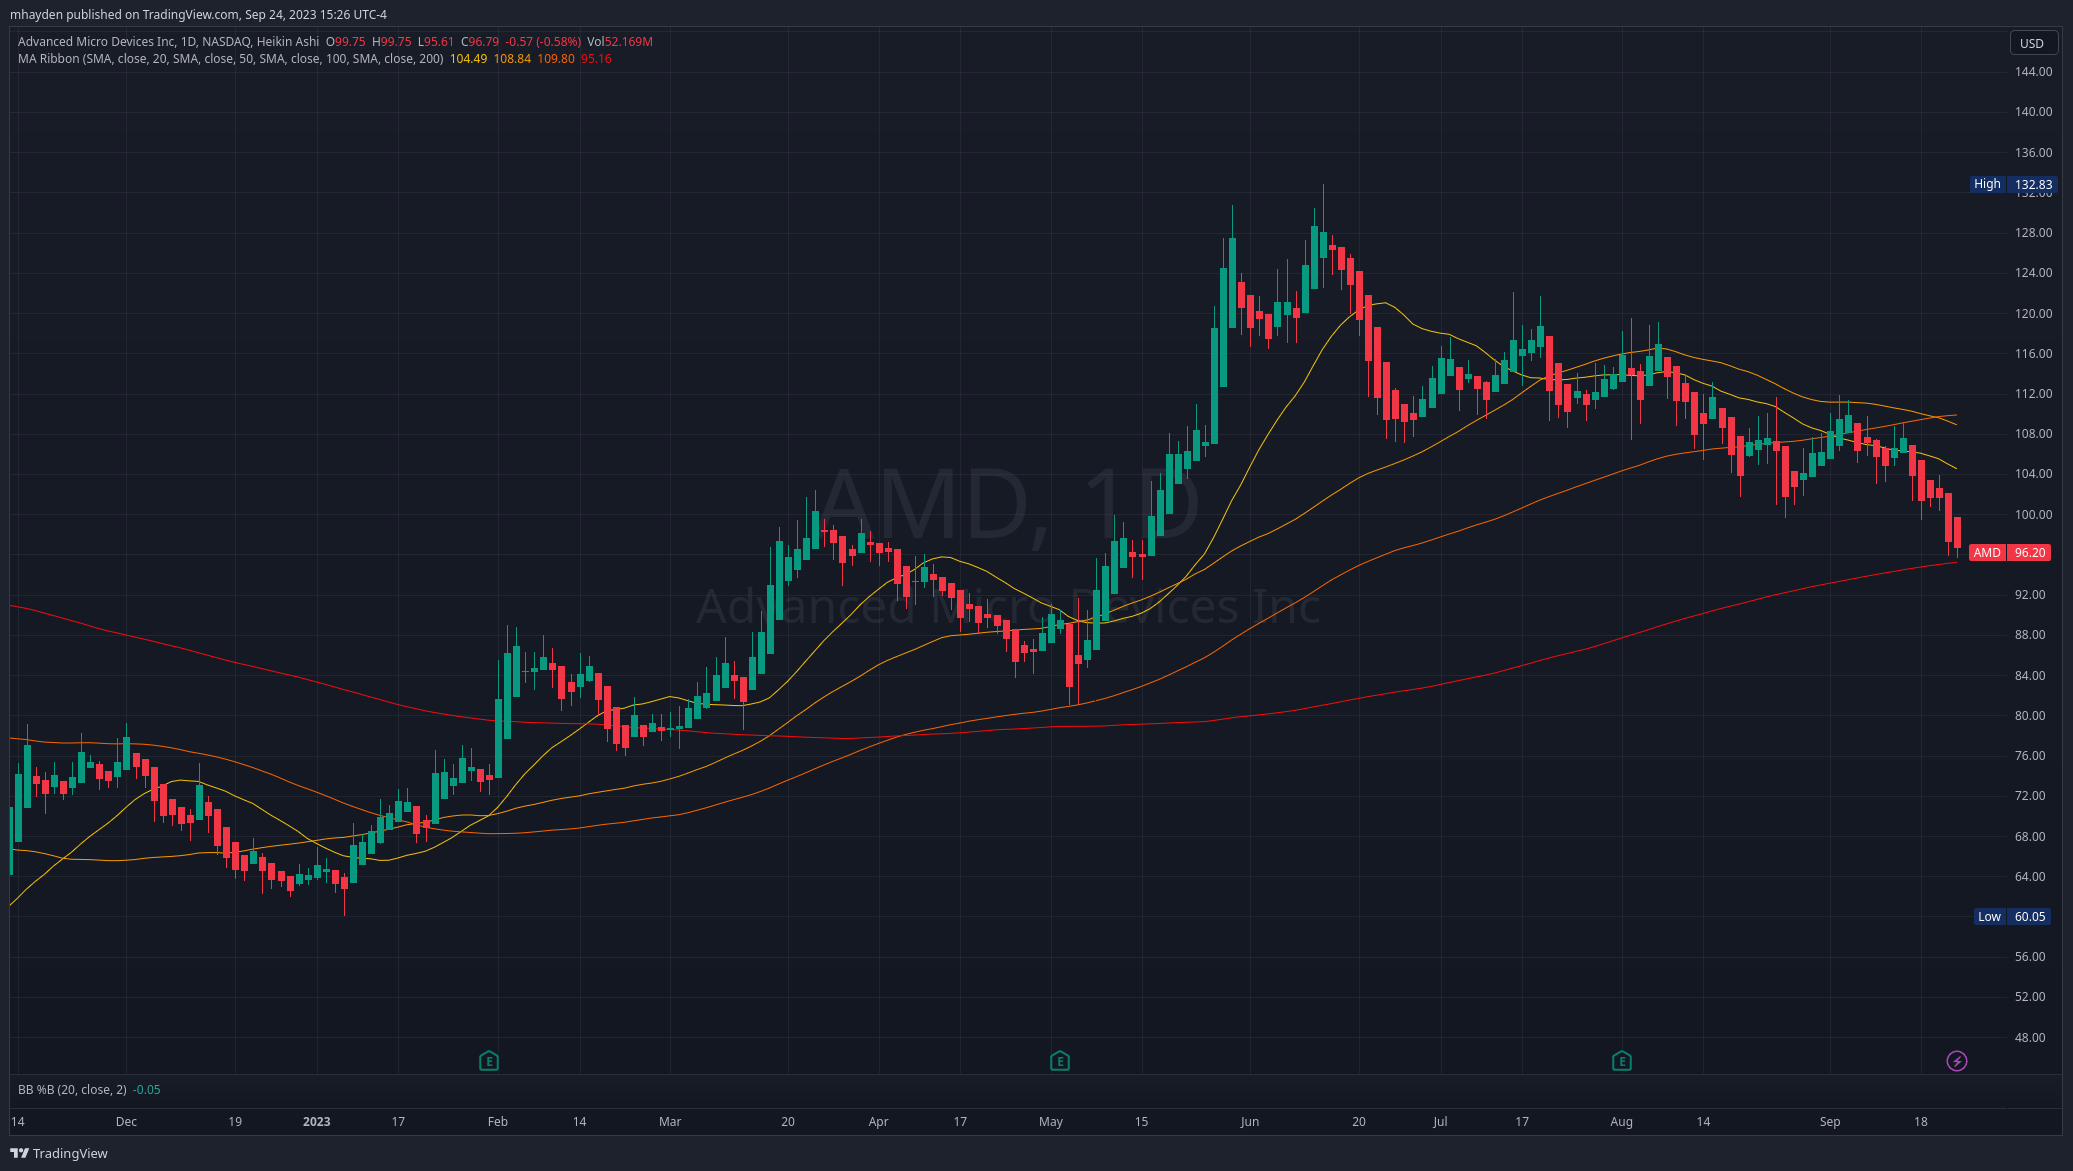
A quick check of gaps on the daily chart shows one from last week around $100 with a few older ones around $76, $72, and $65.

If we add the moving average ribbon to the daily chart, we notice that it's poorly stacked right now. The 20 and 50 are both below the 100 and price has run right back to the 200.
The Heikin Ashi candles show a very choppy and indecisive move down without any clear strong trends. As a reminder, lots of green HA candles with no wicks on the bottom signify a strong rally. Lots of red HA candles with no wicks on top signify a strong downward trend. Generally, I look for three of these types of bars in a row before I consider the trend to be a strong one.
Where might we stop on the downside?
- Daily 200MA: $95.16
- VWAP from COVID low: $91
- VWAP from 2022 low: $90
- Weekly 200MA: $86.87
- Next gap: ~ $76 😬
Upside could be limited around $99-$100 where we had the gap from last week. Also, $110 is a big volume shelf since the recent high in June.
TSLA
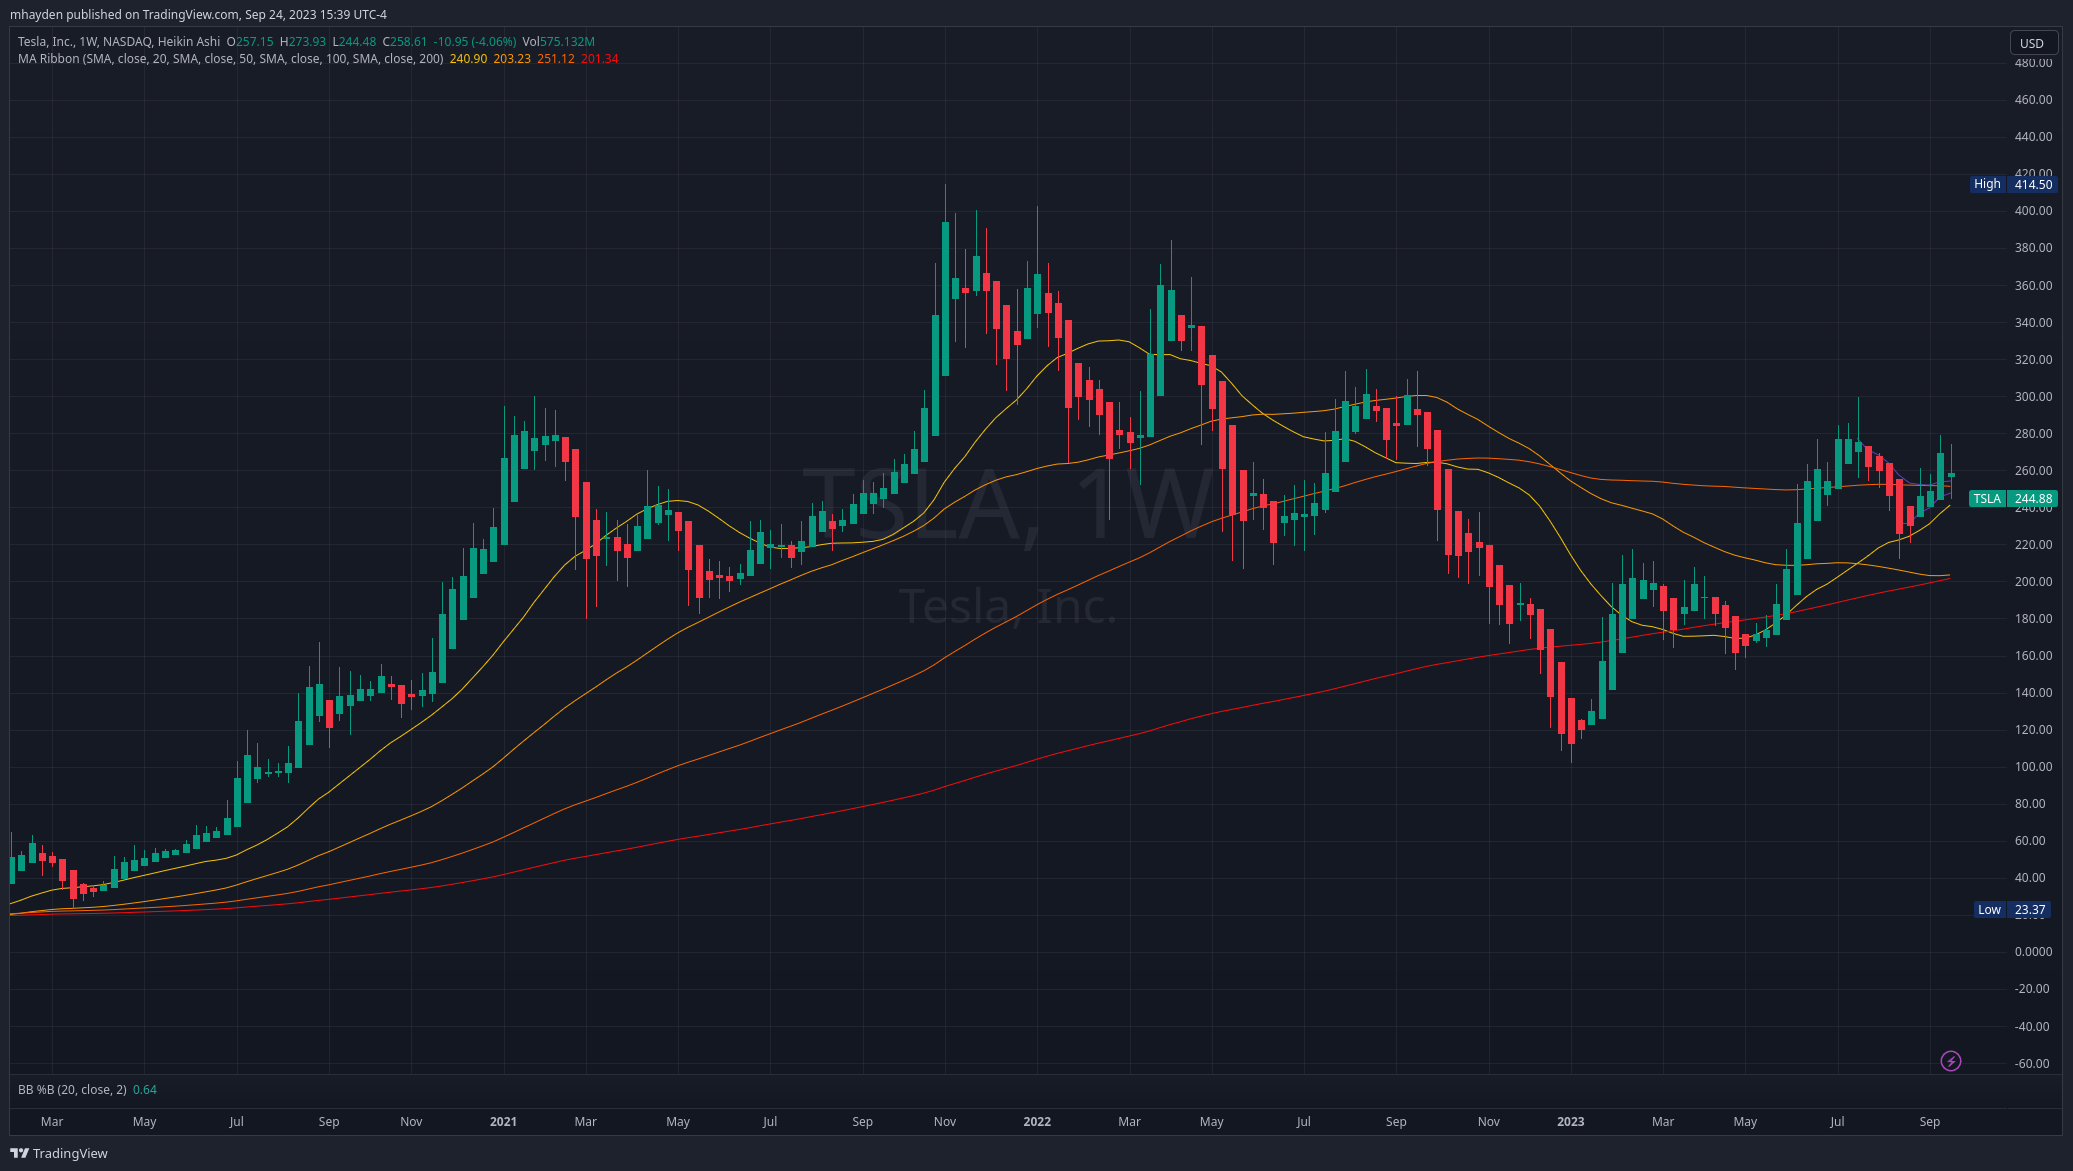
TSLA's weekly chart shows an unusual stack of moving averages. First up, the 200MA is still tilted upwards and well below the current price. However, the 20MA crossed over the 50MA, but both of them are still under the 100MA.
This is not the best setup, but it has signs of improvements.
If we drop down to the daily chart and hunt for gaps, we have plenty.
There's a $280-$290 gap sitting above the current price and a gap below price around $220. This is a range I've been trading recently with some short strangles.
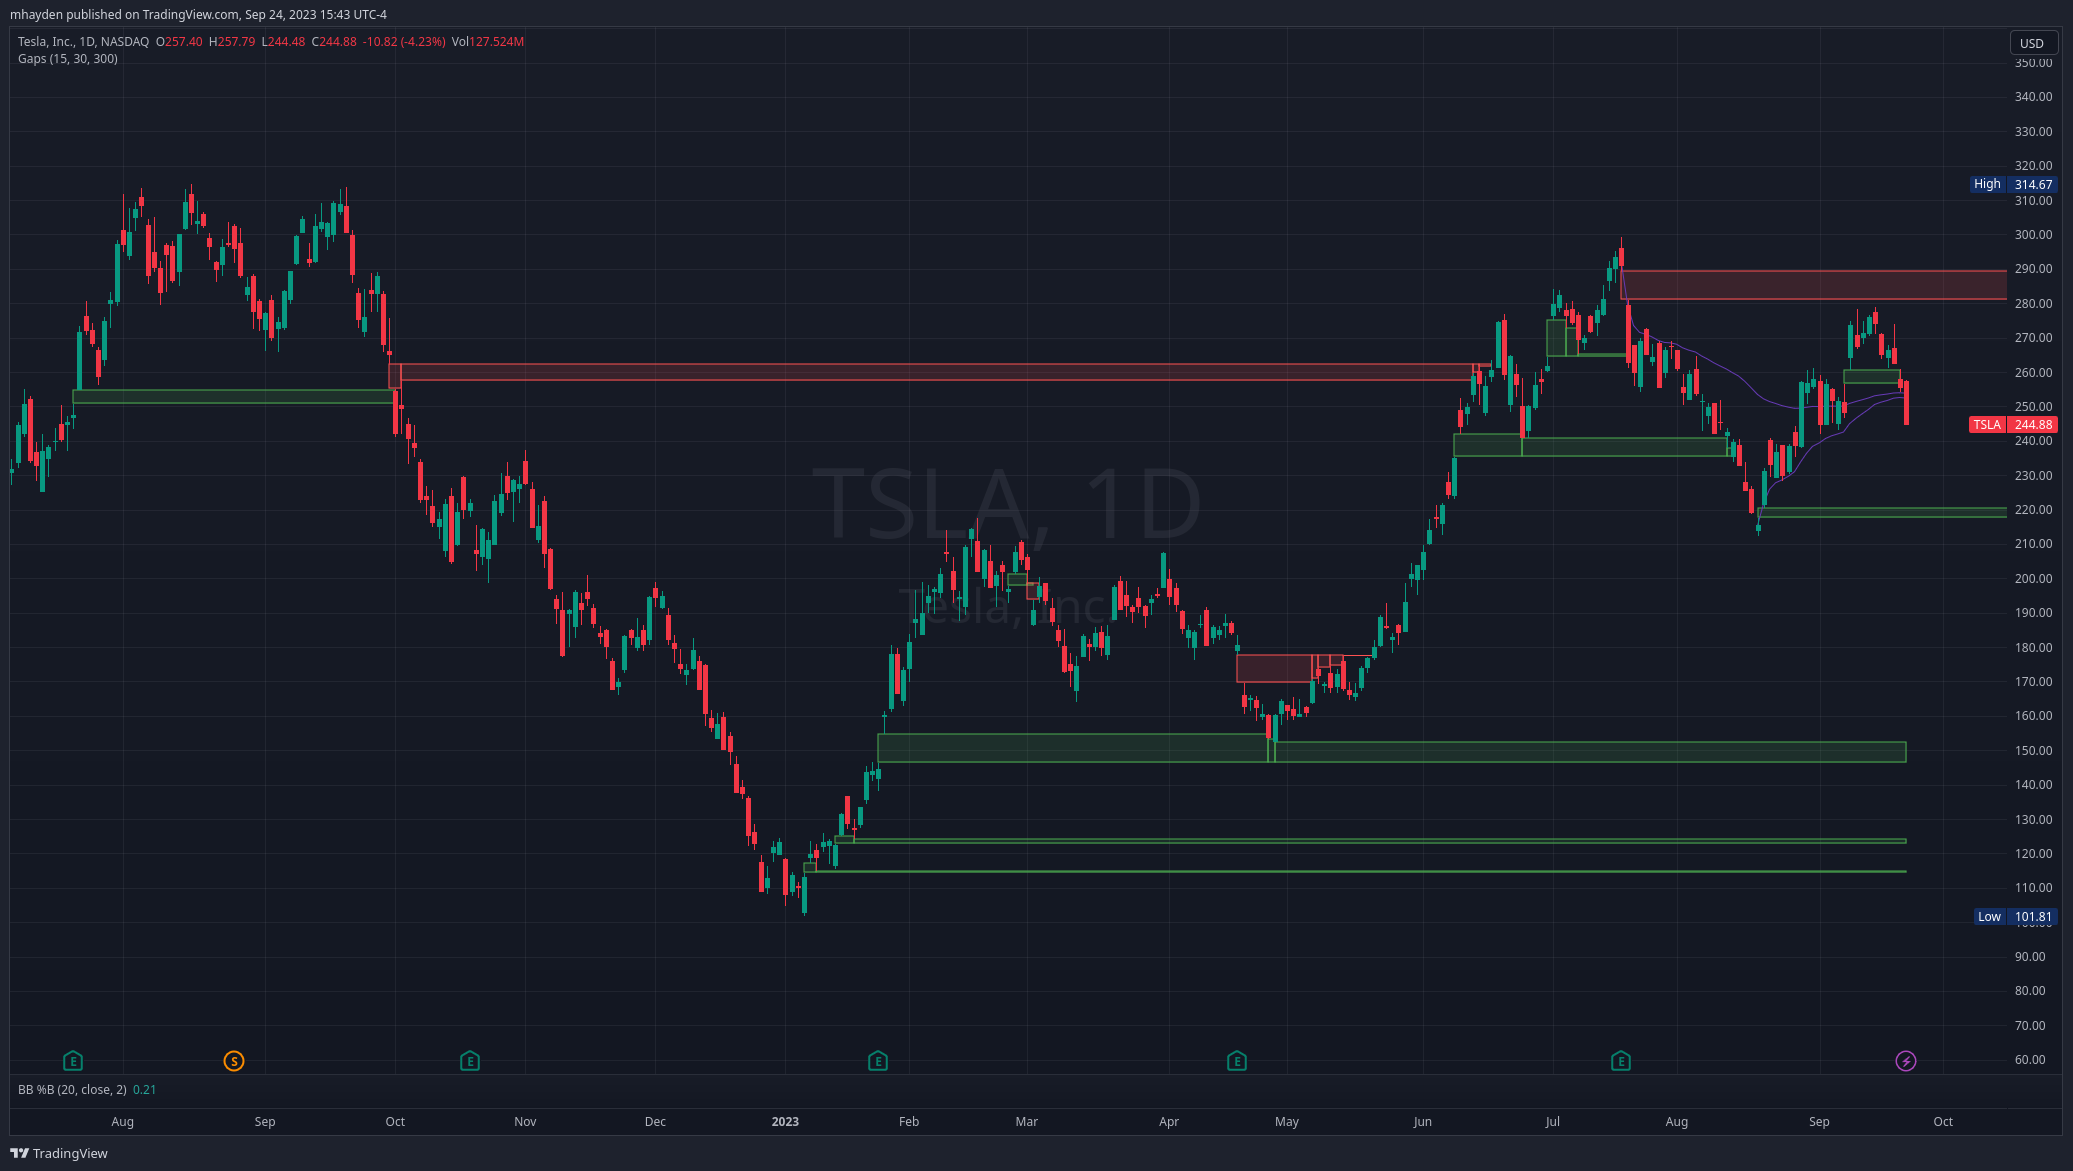
VWAP lines from the recent high and low were both broken last week. That's a bit concerning for now.
TSLA looks to have some short to medium term difficulties, but the longer term still looks quite bullish. $220-$290 feels like a wide range to trade, but TSLA does move a lot and I'm looking to make some trades that are a bit further out.
Thesis
Both AMD and TSLA are forming a decent correction right now, but I'm not panicking about my trades on either one.
AMD is approaching multiple support levels this week in the $90-$100 range and I'm very eager to see what it does there. AMD's highest volume levels remain around $110 and they haven't budged from there in weeks. That's a good sign for sure, but I'm worried about those levels shifting if AMD breaks through any more VWAP lines.
TSLA sits right in the middle of a range that is well defined from $220-$290. Price action is pretty difficult to pin down, but that's how TSLA trades. I'd be looking to make bullish trades in the $220-$230 range but I'm not sure where I'd cap my top-end right now. I'd like to see TSLA revisit $270 once more before I consider selling a covered call.
Good luck to everyone this week. ☘️
Discussion