Charts & Coffee for 10/15

It's time for a weekly chart roundup! Today's update includes SPY, TSLA, AMD, and OXY. 📈

Welcome back to another Charts & Coffee. I hope your weekend is going well. 🌴
These are the posts where I focus on the two things that always tell the truth in the market: price and volume. Both of them are found on any stock chart for free!
All investments come with significant risks, including the loss of all capital. Please do your own research before investing, and never risk more than you are willing to lose. I hold no certifications or registrations with any financial entity.
Let's get into it!
Long term market view
Once again, Ciovacco Capital's videos on YouTube are a great reminder of long term market mechanics, especially for traders like me who get a bit caught up in short term price movements. If you find yourself getting caught up the news cycle of fear and euphoria, these videos might help you as well:
Here are the key bits that I took away from this week's video:
- VIX has found a support/resistance level at 20. Exceeding 20 would be a bit concerning but exceeding 25 would bring us to a recent high and that would be more concerning.
- SPX danger levels show up at 4201, 4147, and 4135. Dropping below those would require defensive measures if the price lingers there for longer than a day or two. A drop down to the COVID VWAP lines around 3936/3891 would signal a potential change in the long term market structure provided that price stays there for more than a few days.
- Housing CPI usually lags more than anything else and it's finally turning the corner down.
- Weekly charts for all of these are still ticking all the bullish boxes: SPY, QQQ, SMH, XLK, and VUG. Semiconductors are actually doing better than technology lately.
- Risky loans are still bullish even though JNK is lagging a bit.
- Foreign stocks (total market ex-US, such as VEU) is finally turning bullish after a 15 year consolidation.
- Multiple sectors of the S&P 500 are showing bullish trends.
- Upcoming earnings are key. If they come in looking good, it could squash some of the interest rate fears in the market. Some of the markets biggest bulls are calling for gains as high as 13% for the remainder of 2023.
We have some turbulence and volatility right now but the overall market structure still looks bullish. The recommendations from this video are to give the long term trend the benefit of the doubt but find a way to keep maximum flexibility in your portfolio. 🧘♂️
SPY
Let's kick things off with a weekly chart for SPY. I've added LuxAlgo's Price Action Concepts indicator here as it does a lot of the ICT concepts work for me.
SPY's current price sits just above the equilibrium zone where it managed to break out in April/May 2023. We've retraced a little down from a big volumetric order block from about $452-$462. Our abrupt move down on the week of 9/18 created a bearish fair value gap that we tested last week and failed to break out.

If SPY tries to make a move higher this week, it needs to break that fair value gap just under $440 and wander into the order block above $450. That's a tall order as we've been making lower lows and lower highs lately.
If SPY moves down, we might see some help again around $420. There's an equilibrium zone between the discount/premium zones that could be a zone of support. If that fails, then look out below.
We don't get much help until the order block from $380-$390 and then we're in some dangerous territory where we might break the VWAP lines coming up from the COVID highs and lows. See the Ciovacco Capital video for full detail on that (in the first section of this post).
TSLA
This is a stock where you really need to zoom out since it has some wild intraday and intra-week moves. If we take a broad look, our equilibrium zone is around $200-$220 and we tested that zone in August. We came out of it with really good volume and price action has been volatile since then. Earnings are coming up on 10/18!
TSLA made a a couple of key fair value gaps recently. We have a bullish one first just over $240 and bearish one right around $260. That's a decent trading range for TSLA going into earnings. LuxAlgo's oscillator indicator suggests that TSLA is leaning slightly bullish and the price movement on the week of 9/11 might have been a bit too hasty.
TSLA has really liked making bullish fair value gaps this year. These are signs of strong bullish price movement with a decent amount of volume behind it.
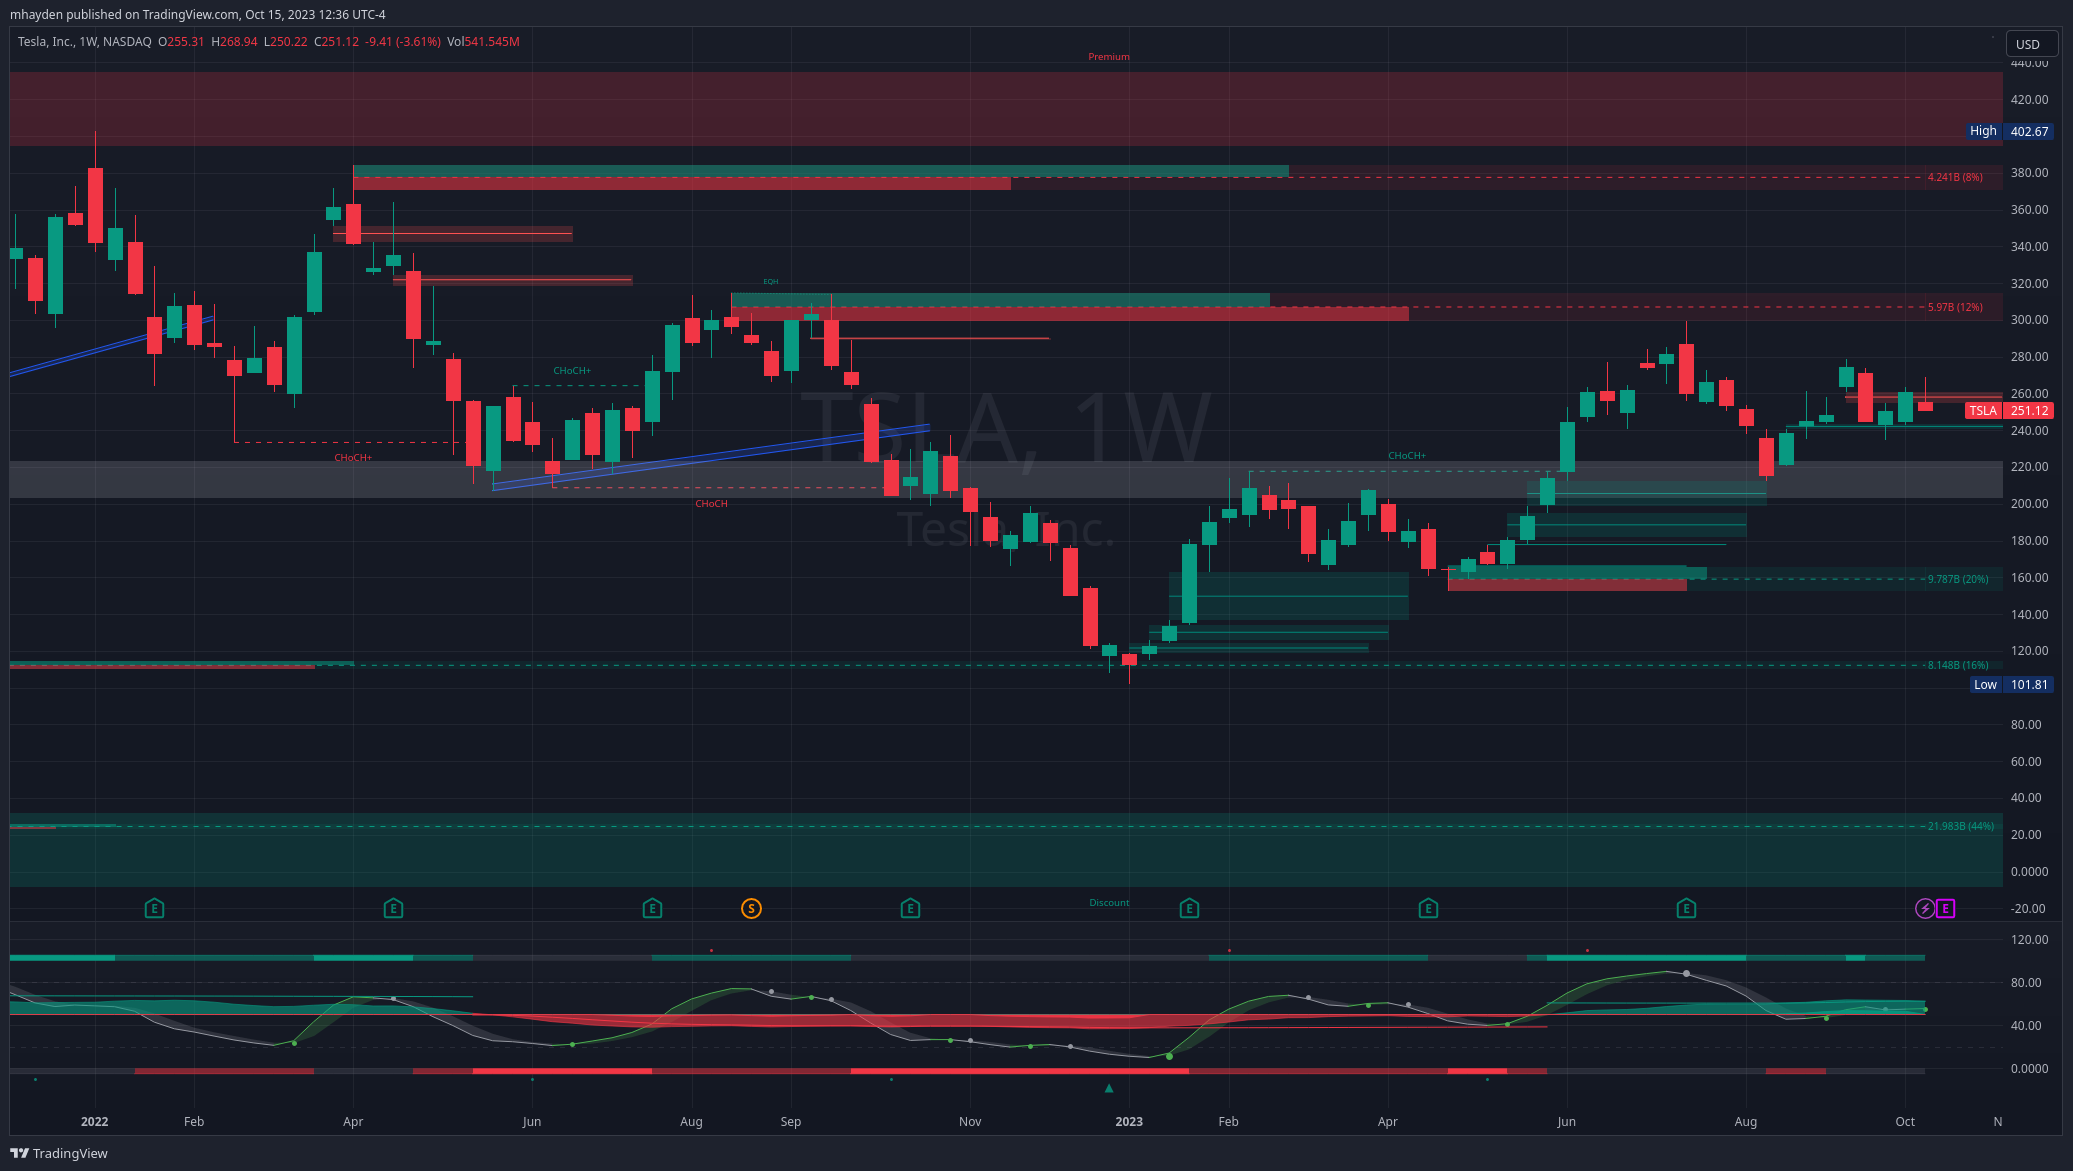
If TSLA is ready to move higher, it needs to break that $260 fair value gap. There's a relatively small order block around $300 that it tested in July and failed to break through. More bearish volume is in that order block and that will make it more challenging to break through. Ideally, I'd like to see price move through the block, retest the block, and keep moving higher.
If TSLA is headed down, we get some help around $240 from a fair value gap and around $220 from the equilibrium zone. A drop under equilibrium would definitely be more concerning. Two more order blocks sit underneath that zone around $160 and $115, but a trip to $115 would be a over a 50% loss from where we sit right now.
AMD
AMD spent most of 2022 in a downward slide and then started stair-stepping back up in 2023. It recently broke a downward trend that started in June and it failed to get through the equilibrium zone this week. AMD's equilibrium zone runs from about $106-$112 and it finished Friday around $105.
Most of AMD's volumetric order blocks sit above the current price (58%) and only about 32% sit below the current price. My big question for AMD here is whether we break through the equilibrium level or not. We have almost two weeks worth of price action showing that the trend line is broken. AMD's earnings are coming up on 10/31! 🎃
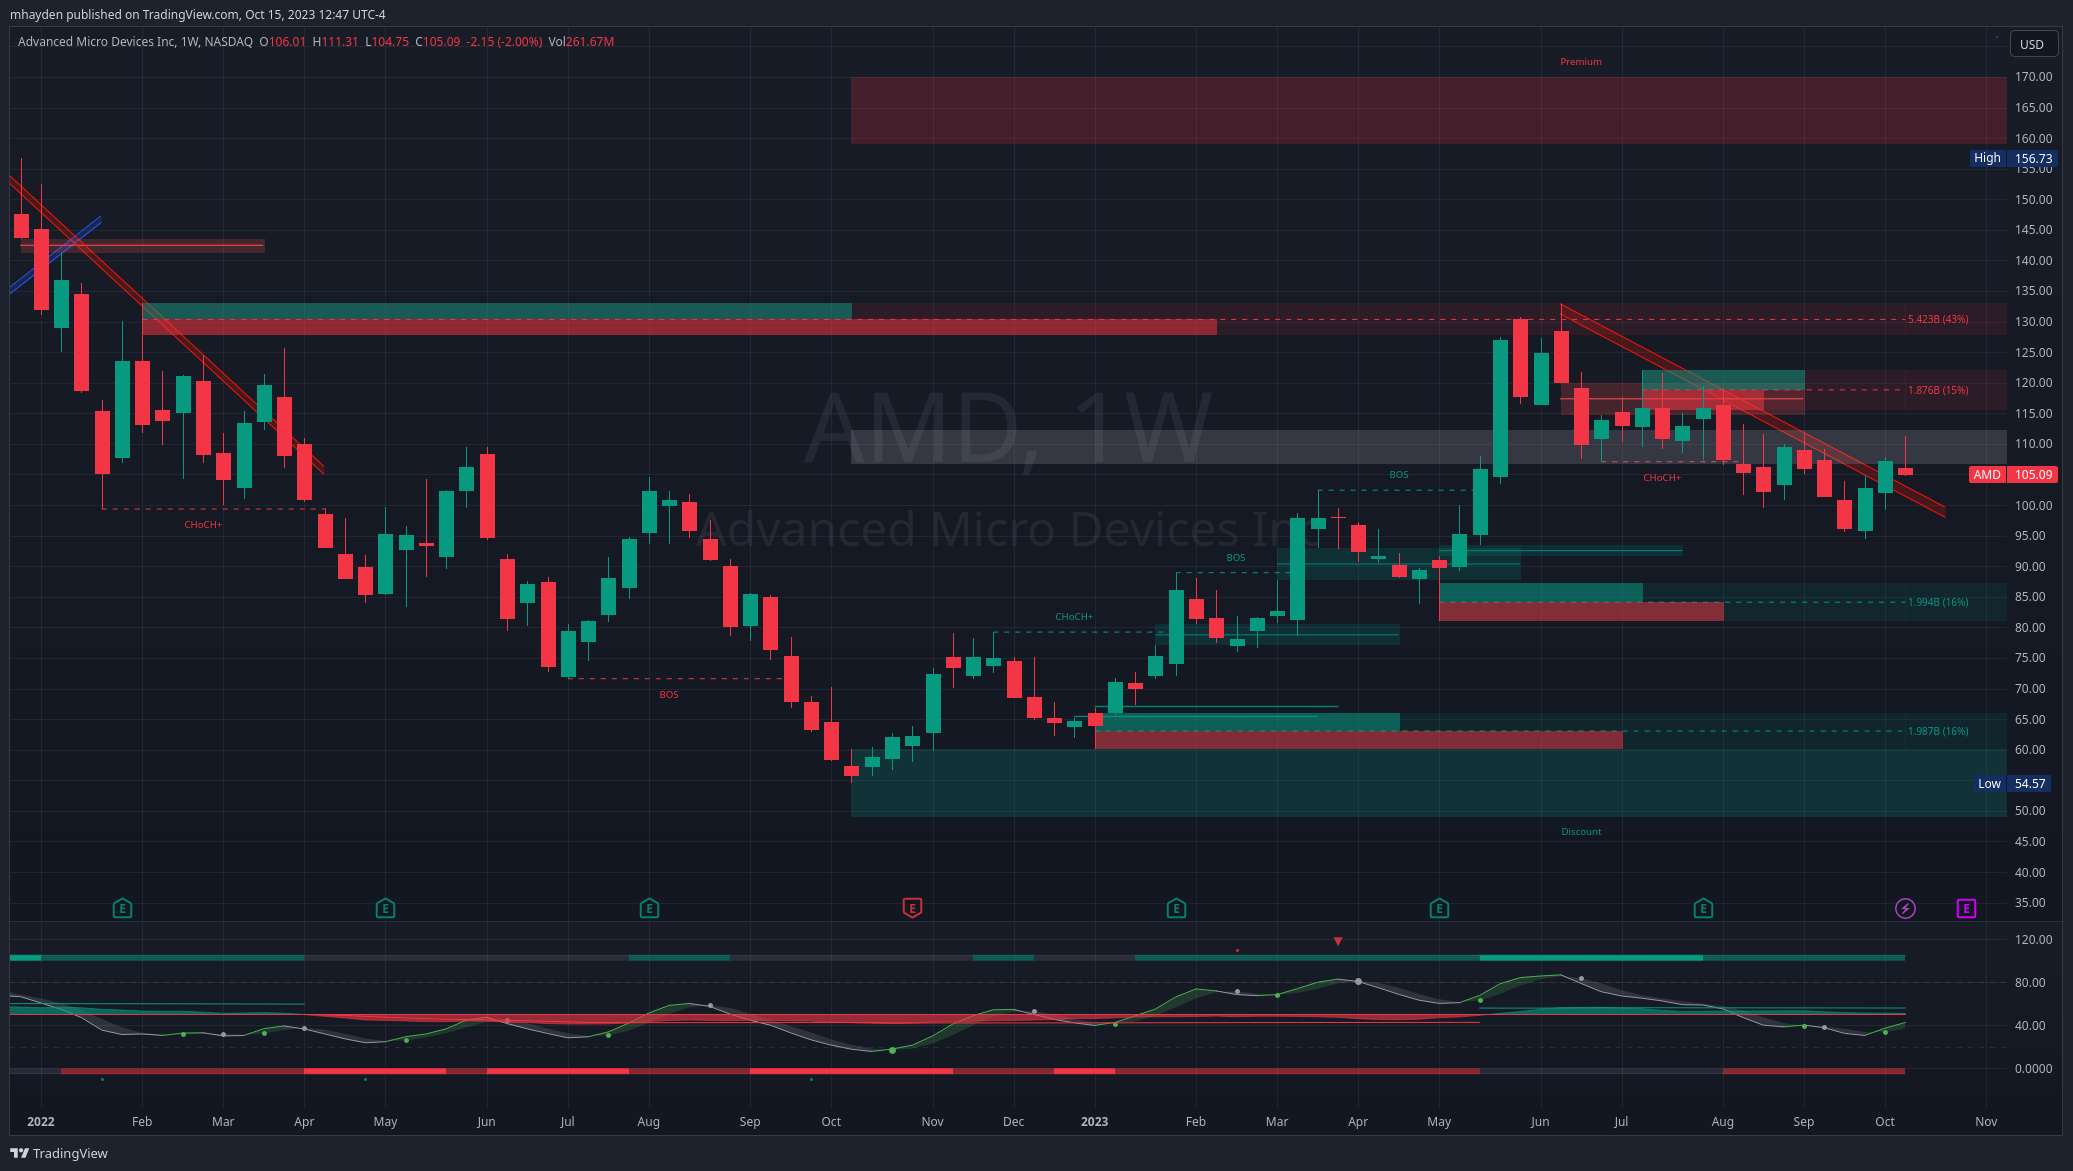
If AMD heads higher, we need good volume to get us through the equilibrium zone to $112. From there, there's a small order block at $115-$120. AMD has tested this level for many weeks and failed to break above it. If earnings give us a bullish shift in investor sentiment, we could be headed back to retest highs around $130.
If AMD heads lower, we might get some help from the trend line we just broke through. $82-$87 offers another support level. $60-$65 seems unthinkable now but that's where we start to bottom out in 2022 lows.
As mentioned earlier, semiconductors have shown broad strength, even relative to tech stocks, and AMD is a growing player in this market.
OXY
There's one theme I can see here for OXY over the last 18 months: consolidation. Price has been jammed into a $55-$75 range for a very long time and it just broke below a long running trend line. Energy stocks have been rattled in 2023 after having a great 2022.
OXY is still riding fairly high between the equilibrium and premium levels.
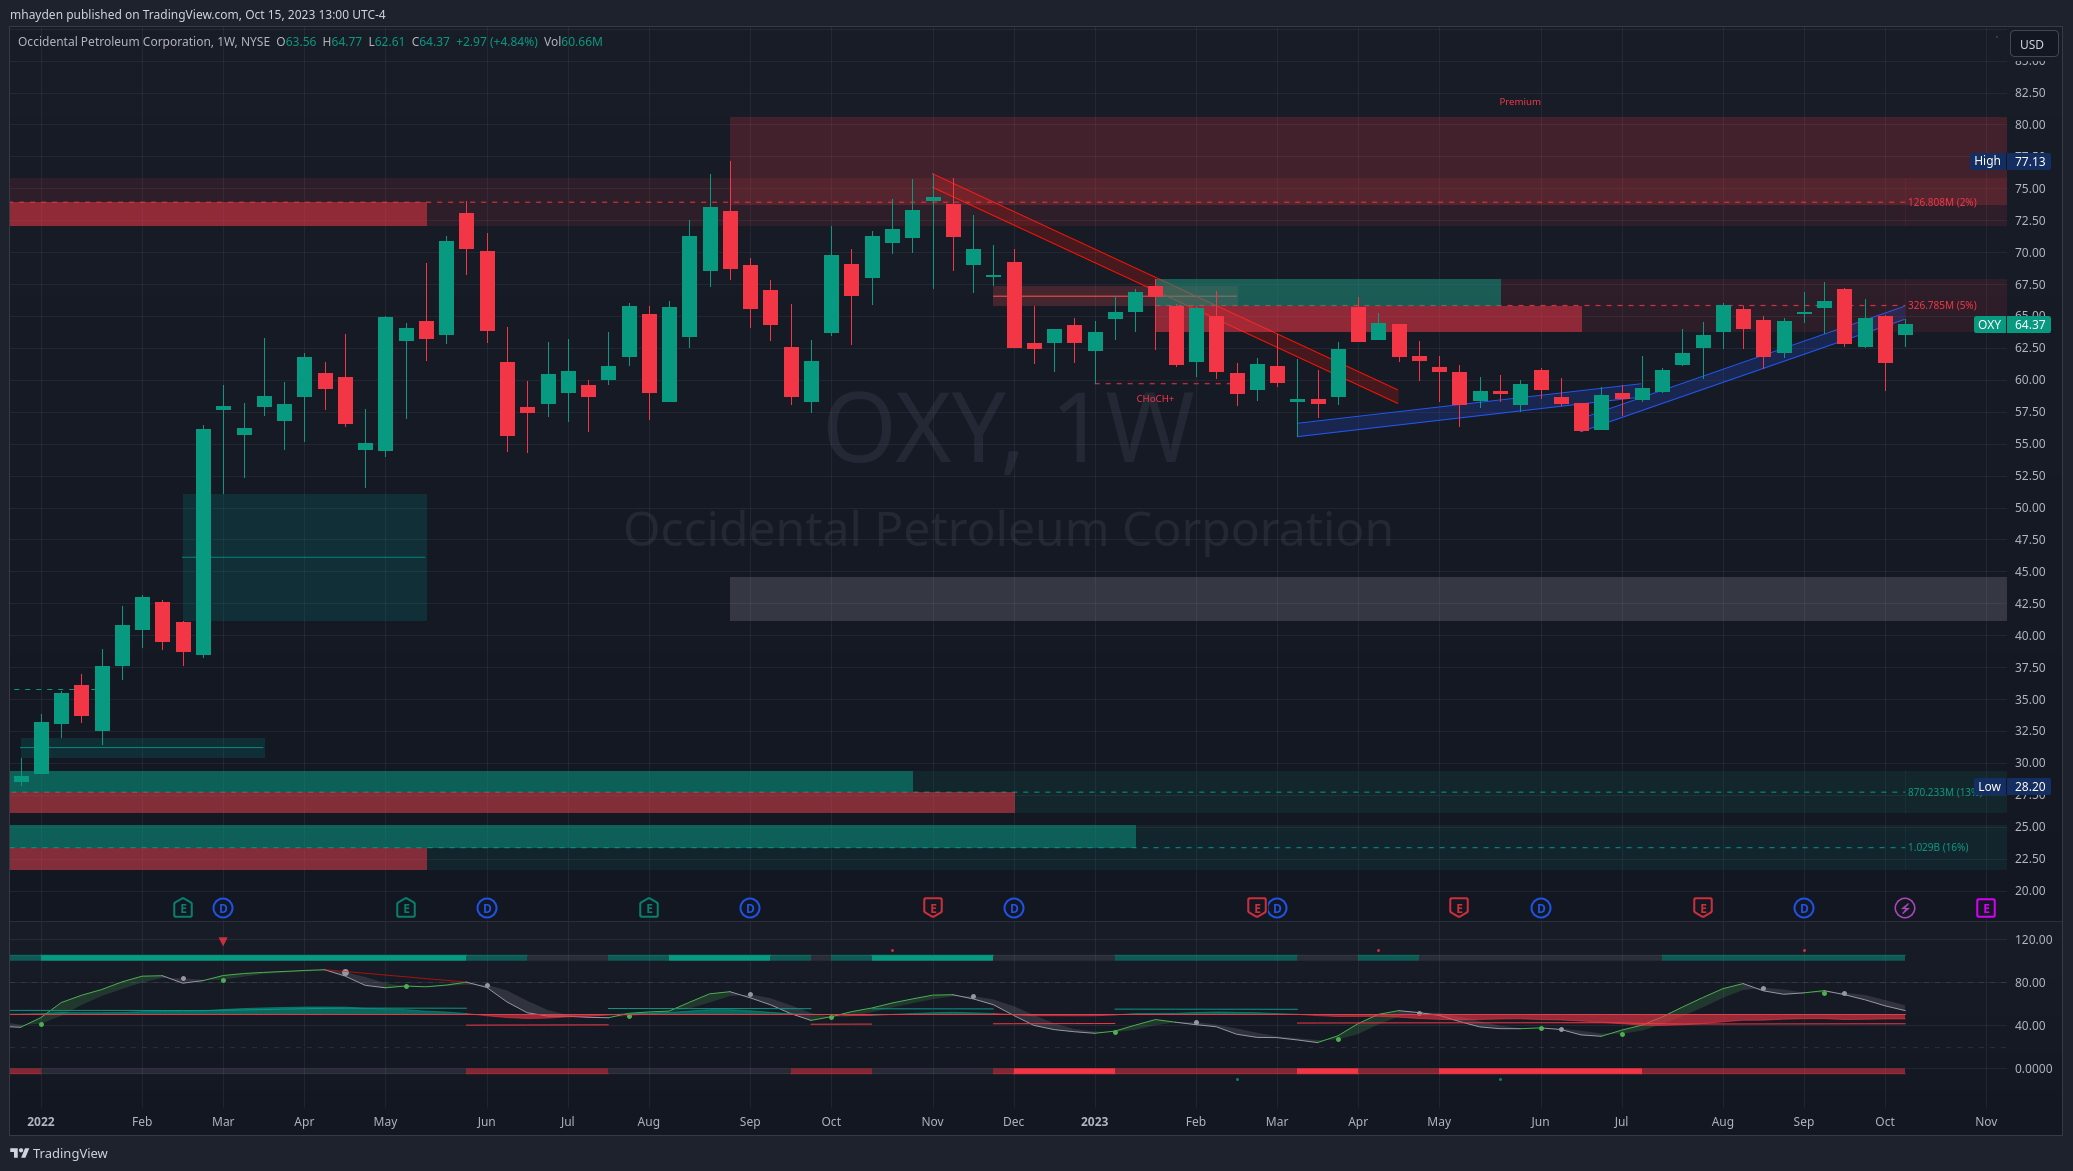
If OXY moves higher, it needs to find a way trough the $63-$67.50 order block. This level has stymied OXY since December 2022. It's a relatively small order block. If we pass through that level we might retest the highs in the lower $70's.
If OXY moves lower, the mid-$50's support level might be the next one in play. Below that, equilibrium shows up at $45.
Thesis
As noted in the video from the first section, the long term market mechanics are all still ticking the bullish boxes. There hasn't been a big shift into defensive stocks as we've seen before other downturns. There are some signs that liquidity is down a bit and that can create some extra volatility.
I'm making some adjustments in my trades to give myself a little more time to be right. Instead of selling shorter DTE puts/calls in the 7-14 day range, I'm scooting out to 30-60 days and looking for more conservative deltas around 0.30-0.20. That allows me some extra flexibility and smooths out some of the volatility we've seen lately.
I still think there's more upside here than downside, so I'm selling covered calls on shorter time frames and handling them a bit more like scalps. Luckily, all of my holdings right now are well above their cost basis and getting assigned on a covered call would be a good time to secure profits.
Good luck to everyone this week! ☘️
Discussion