Charts & Coffee for 10/9

Taking another look at the only two things in the stock market that won't lie to you: price and volume. 📈

Welcome back for a look at the only two things in the stock market that won't lie to you: price and volume. I spent yesterday doing some off-road rock crawling and that's why your charts and coffee update is a day late. 😉
All investments come with significant risks, including the loss of all capital. Please do your own research before investing, and never risk more than you are willing to lose. I hold no certifications or registrations with any financial entity.
Let's go!
Broad market look
As usual, Ciovacco Capital has a great video summarizing where we are on a macro level:
Here's my summary:
- Look more at long term trends and less at news headlines.
- Current SPX trends are still holding well above long term trend lines.
- Gap filling and givebacks are healthy market functions. We might fill some and that might require price to drop in a pretty scary way.
- Bears still control the short term trend and breadth does need to improve.
- SPX has lots of support from 3800-4000.
- Total recent drawdown is around 7.83% and the VIX is much lower than expected. VIX would need to cross 26 to break the trend line down from highs.
- Trade the data in front of you! Head into the week with a flexible and unbiased mind. 😉
SPY
On the four hour time frame, SPY seems to be turning a corner and it broke a down sloping trend line last week. LuxAlgo's oscillator suggests that we're in the very early stages of a bullish shift, but we need to see more volume to confirm it.
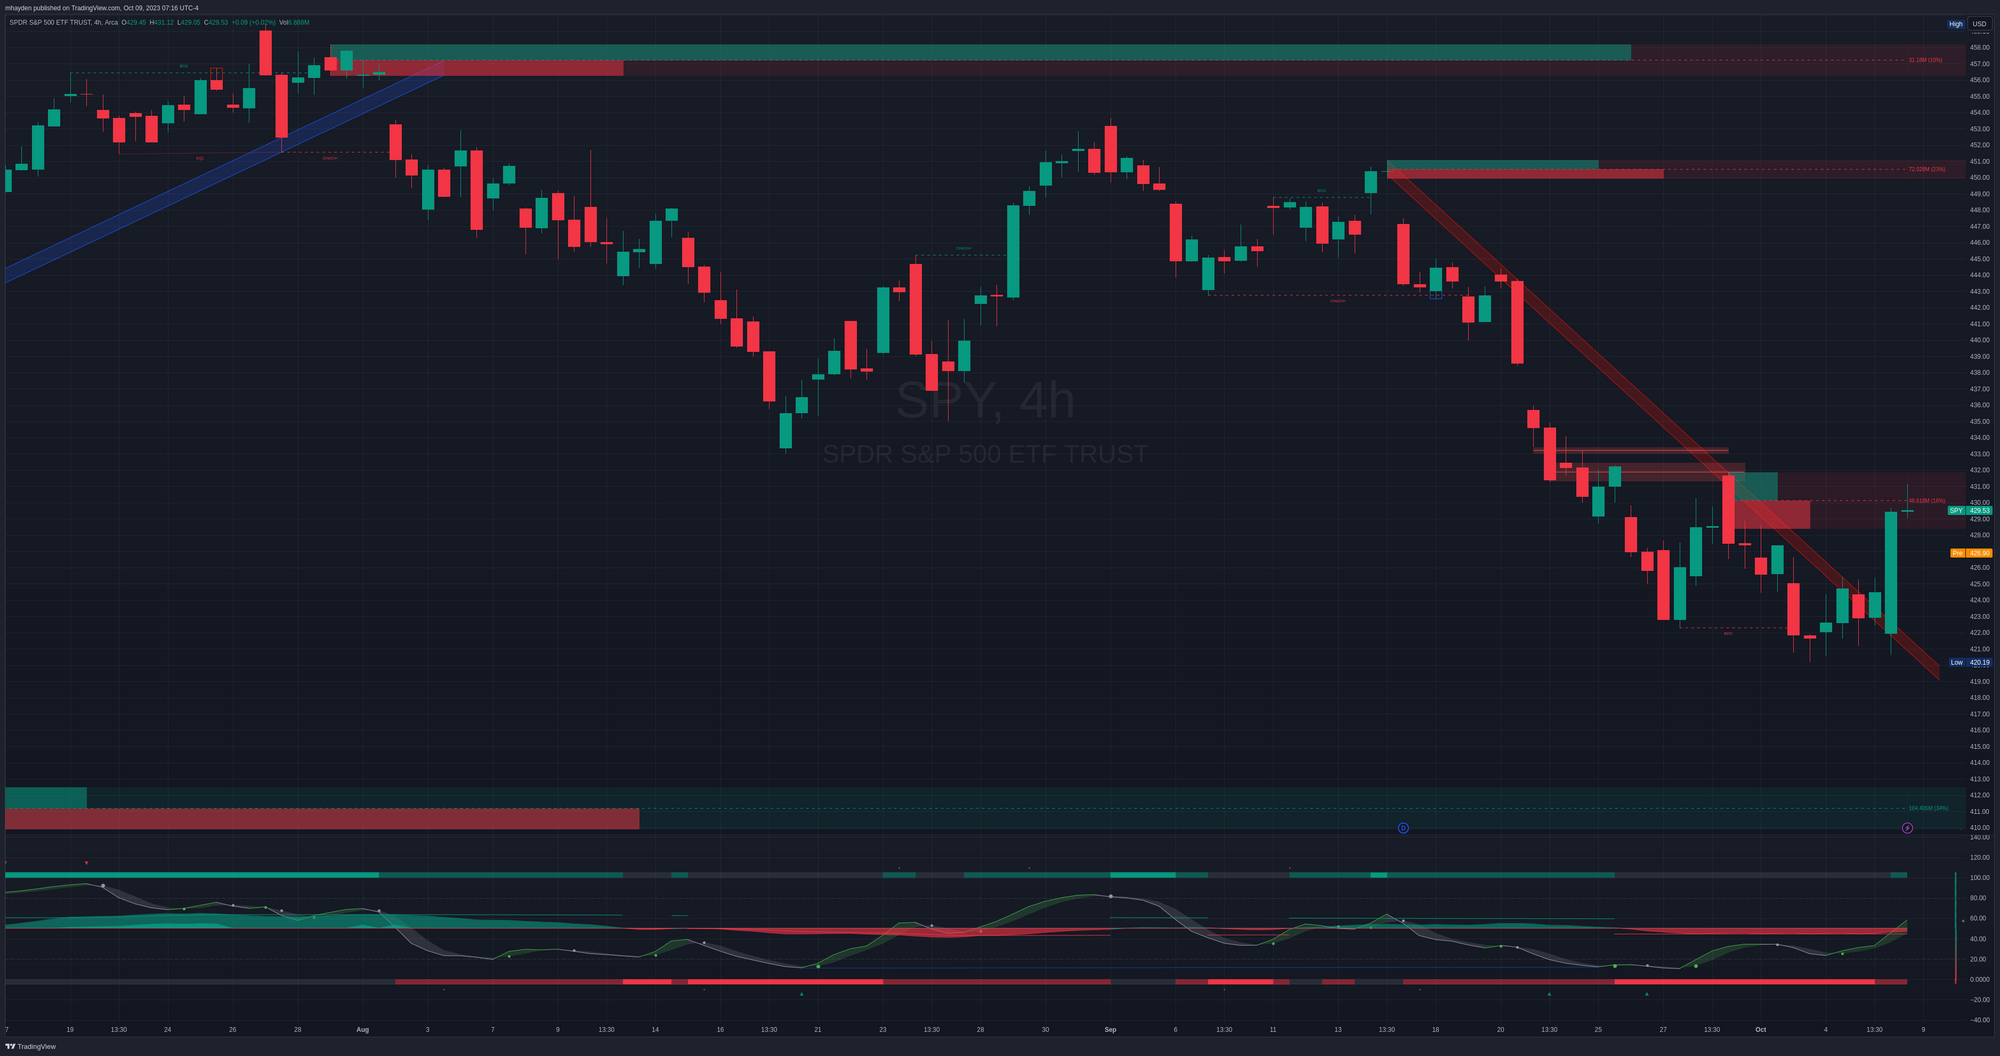
Be careful going into this trend early, though. We have a bearish order block from $429-$432 and some fair value gaps just above that level. If we crush those levels, our next challenge shows up at the gap left behind at $436. Beyond that, we have a small gap at $447 and another order block at $450.
If we end up heading down a bit, there's another order block around $410-$412 that could have an impact on price. Losing that level would throw us into a zone from $380-$400 with tons of support levels from VWAP lines and gaps.
AMD
AMD has traded in little up and down channels for quite a while now. It's riding an upward sloping trend line again as it did in late August and early September. Oscillators point to a very early bullish move occurring, much like SPY, but we need more volume to confirm that.

If we're headed higher, AMD has nearly all of its unmitigated order blocks starting at $106 and running up to $119. Two of these are fairly balanced between bulls and bears, but the middle one from $111-$113 shows an incredible amount of bearish activity. I have two theories here:
- Bears could be exhausted from this move down back in August and they might not show up if price moves past $111.
- Bears could look at this level to make a send and send price down again similar to what happened in early September.
If we're headed lower, AMD has some help from an order block from $99-$100 and $100 is a psychological support level. We have strong support at $95 as we saw bears try to push price below that level but the buying pressure was far too strong.
TSLA
TSLA is riding a trend line upwards from a bullish order block at $228-$236 and it had another burst of bullish volume in the $240's. The oscillator shows TSLA as having the strongest bullish trend of any of the stocks I follow. However, we seemed to get stuck around $260 last week. TSLA filled the gap from 9/21, so a move higher is definitely possible.
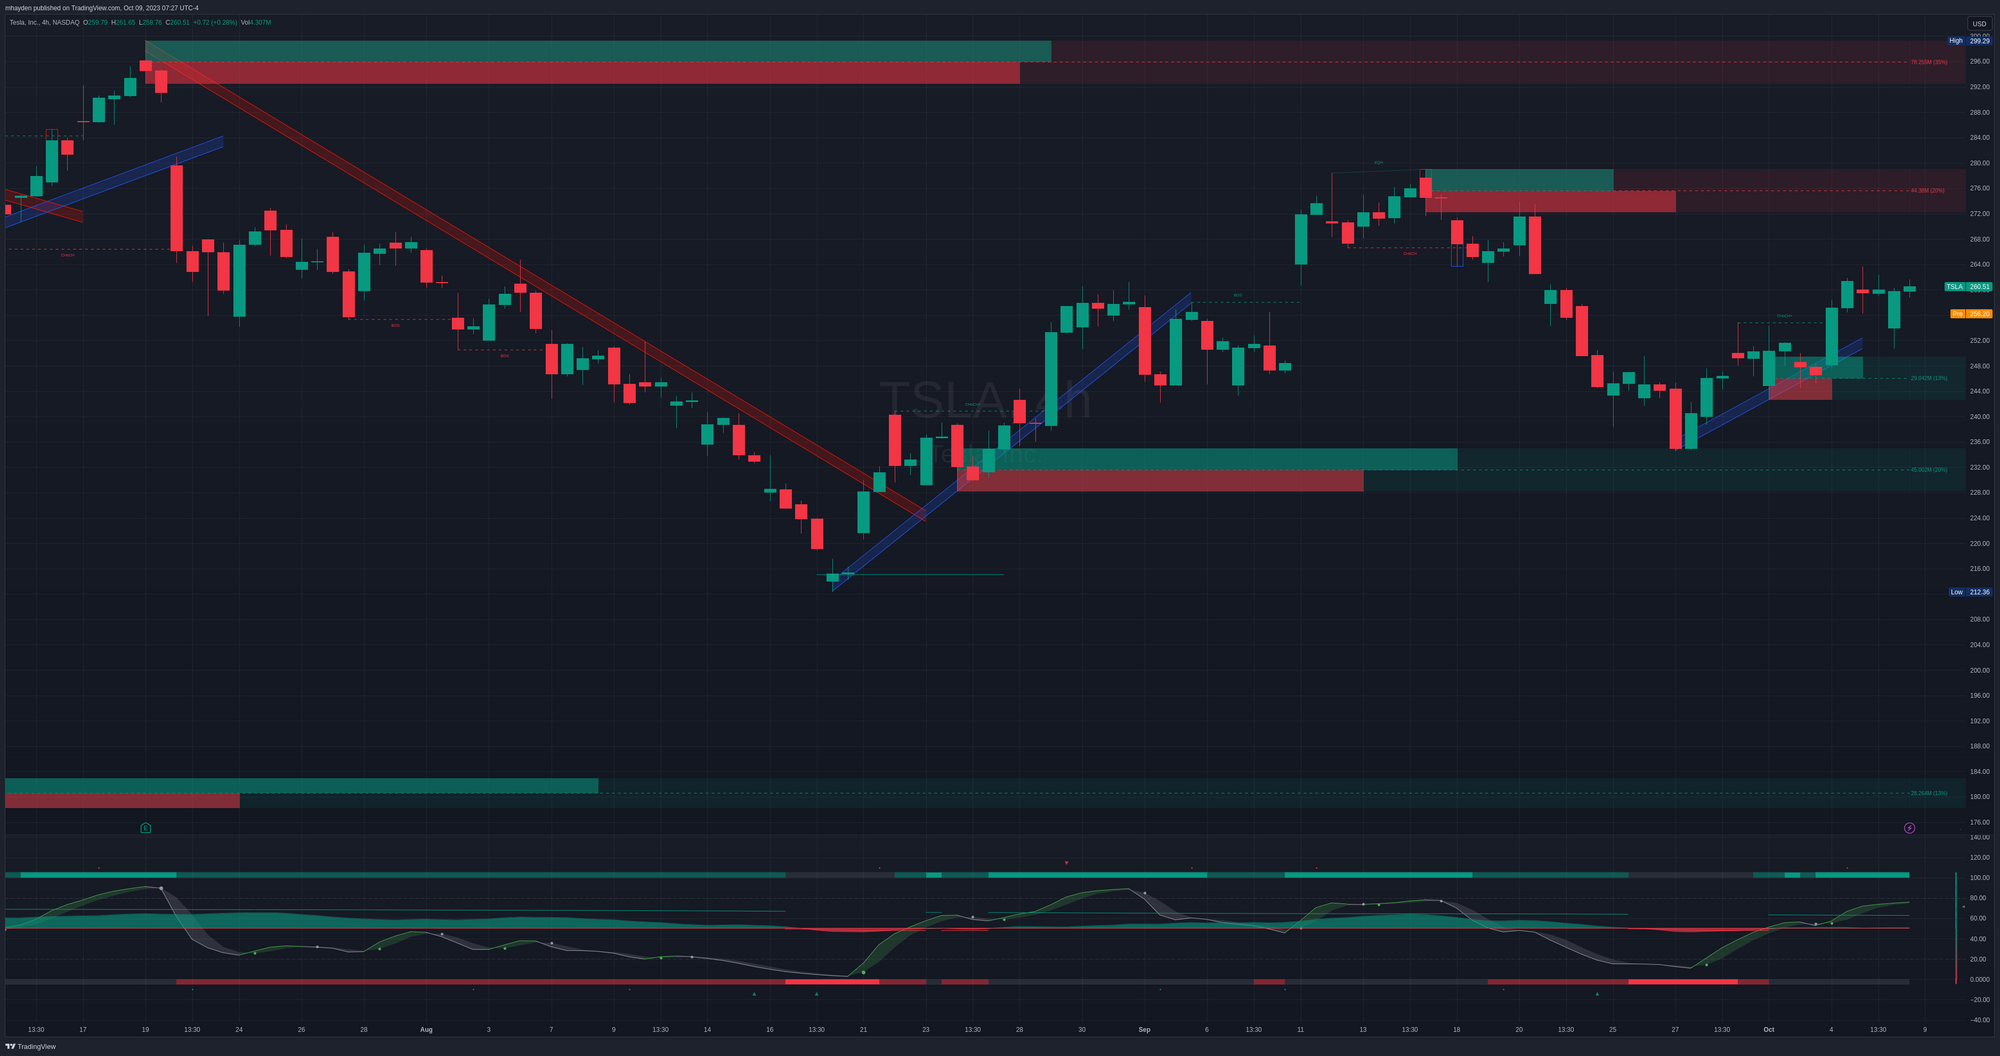
A move to the upside could run to $272 before running into an order block. I'd love to see it get int that level, retest a bit and move higher. Lots of people are focused on $300 again and there's a big order block up around that level.
A move down could test that $234-$235 level again. I wouldn't mind seeing TSLA roll down to that level, retest a bit, and move higher. It would confirm that support level once more and set up a base for end of year moves.
OXY
I'm still learning OXY's patterns, but energy stocks recently took a beating in the market and OXY broke a long-running trendline. It ran all the way to a support level and started mounting a comeback. It also filled the $61-$62 gap on Friday. Its current price is sitting just below the equilibrium zone based on the premium/discount ICT concept.
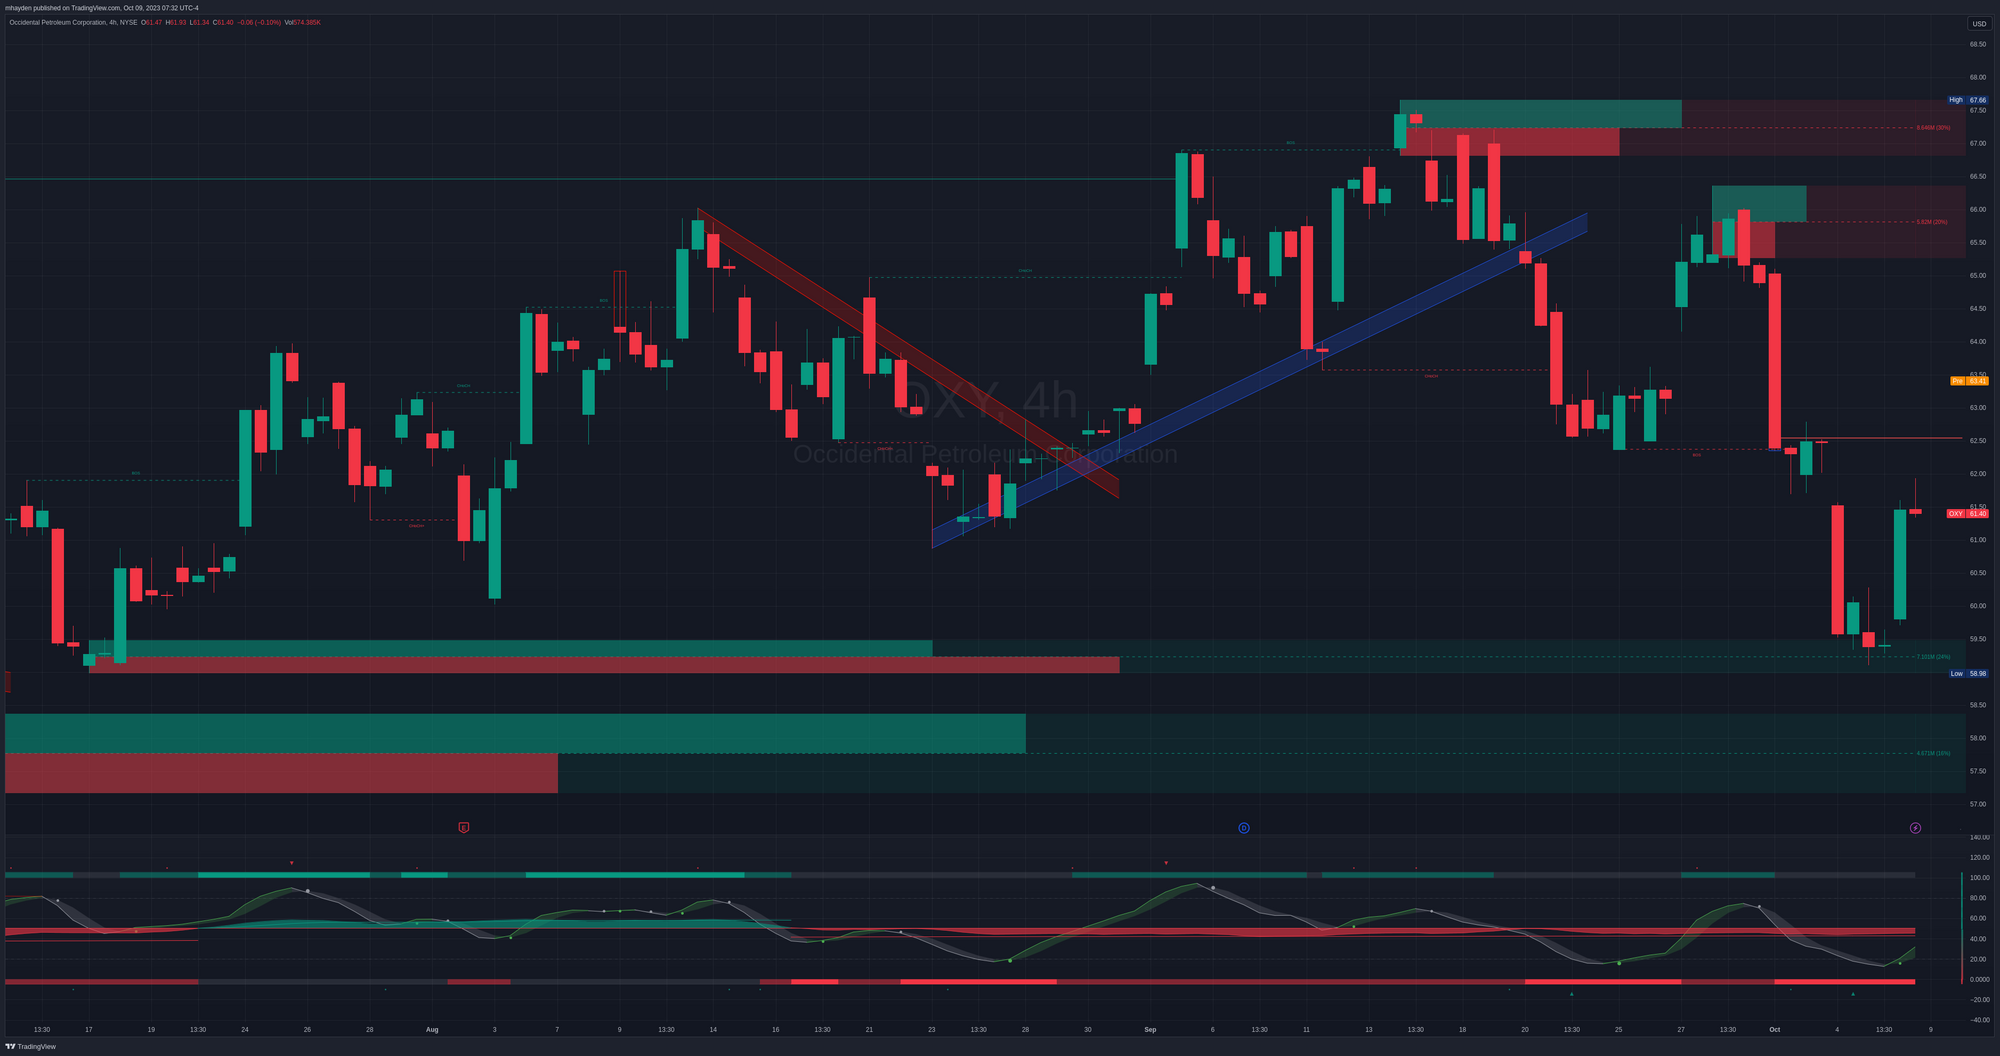
If it moves higher, there are order blocks from $65-$68 with a decent amount of bullish volume. This could get OXY back into its original trend where it was grinding higher with lots of pullbacks.
If it moves lower, we have a bullish order block from $57-$58.50 that could form the base for a higher move. OXY's lowest low in 2023 is $55.51.
Thesis
As mentioned in the video at the top of this post, we're in a secular bull market where the bears have control over much of the short term moves. Some of these moves might look scary and abrupt for bullish traders, but many stocks do have gaps to fill or corrections to make without breaking the overall trend.
My current sentiment is bullish, but cautious. Short term trades are fairly dicey right now but long term trades still look good. If I see more spikes in the VIX and weakening of economic indicators, I'll adjust my thesis.
Good luck this week! 🍀
Discussion