Charts & Coffee for 10/1

Let's break out the charts with some nifty indicators and see where SPY, AMD, and TSLA might be going this week. 📈

Good morning! Grab your coffee and let's get started with a look at the only two things in the stock market that won't lie to you: price and volume. Both are on stock charts for free! 📈
All investments come with significant risks, including the loss of all capital. Please do your own research before investing, and never risk more than you are willing to lose. I hold no certifications or registrations with any financial entity.
Let's go!
Trading with logic, not emotion
I really enjoy the weekly videos from Ciovacco Capital because they take a data-driven, logical approach to examine where we are now and compare it to similar events of the past:
Here are the details I took away from this video after watching:
- Chances of interest rates remaining steady (no hikes or cuts) through January are going up
- We're looking at a 8% draw down on SPX so far
- This pattern doesn't match up well to previous crisis moments where the market fell drastically
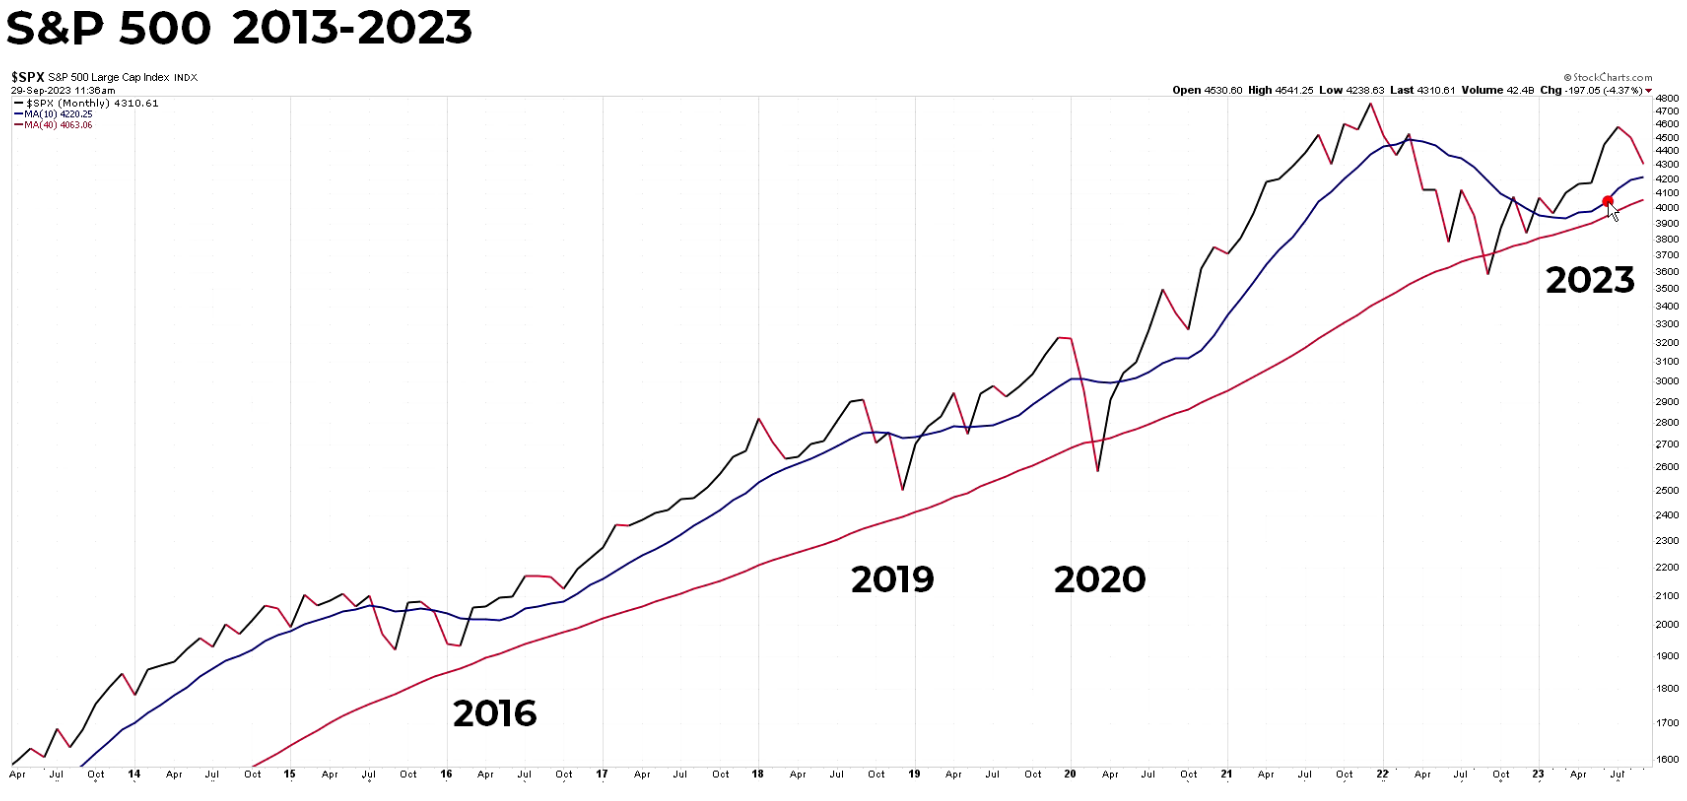
- Crisis moments usually see the 10 month moving average cut through the 40 month moving average with a sharp angle
- Corrections in a bull market usually see the 10 month moving average roll down to the 40 gradually and then start coming back up
Here are those moving averages from the video:
Changes to my charting
I've looked at ICT concepts several times over the years but I haven't done much with them because they're so cumbersome to track on charts. I found LuxAlgo (support this blog by using my affiliate link) and their Price Action Concepts indicator saves a lot of time. It's deeply configurable for your particular type of trading, too.
You'll see some LuxAlgo indicators on my charts here from time to time.
SPY
Let's start with a SPY daily chart since July. We bounced off a positive gamma zone (I got this from Tradytics earlier in the week) but then we made a fair value gap (FVG) on the 15 minute timeframe. That's where price action stopped on Friday.
There's a handy dashboard at the bottom right of the chart from LuxAlgo's indicator that shows SPY as bearish on all time frames. The oscillator at the bottom shows a potential for a bullish move, but there has not been much to confirm it so far.
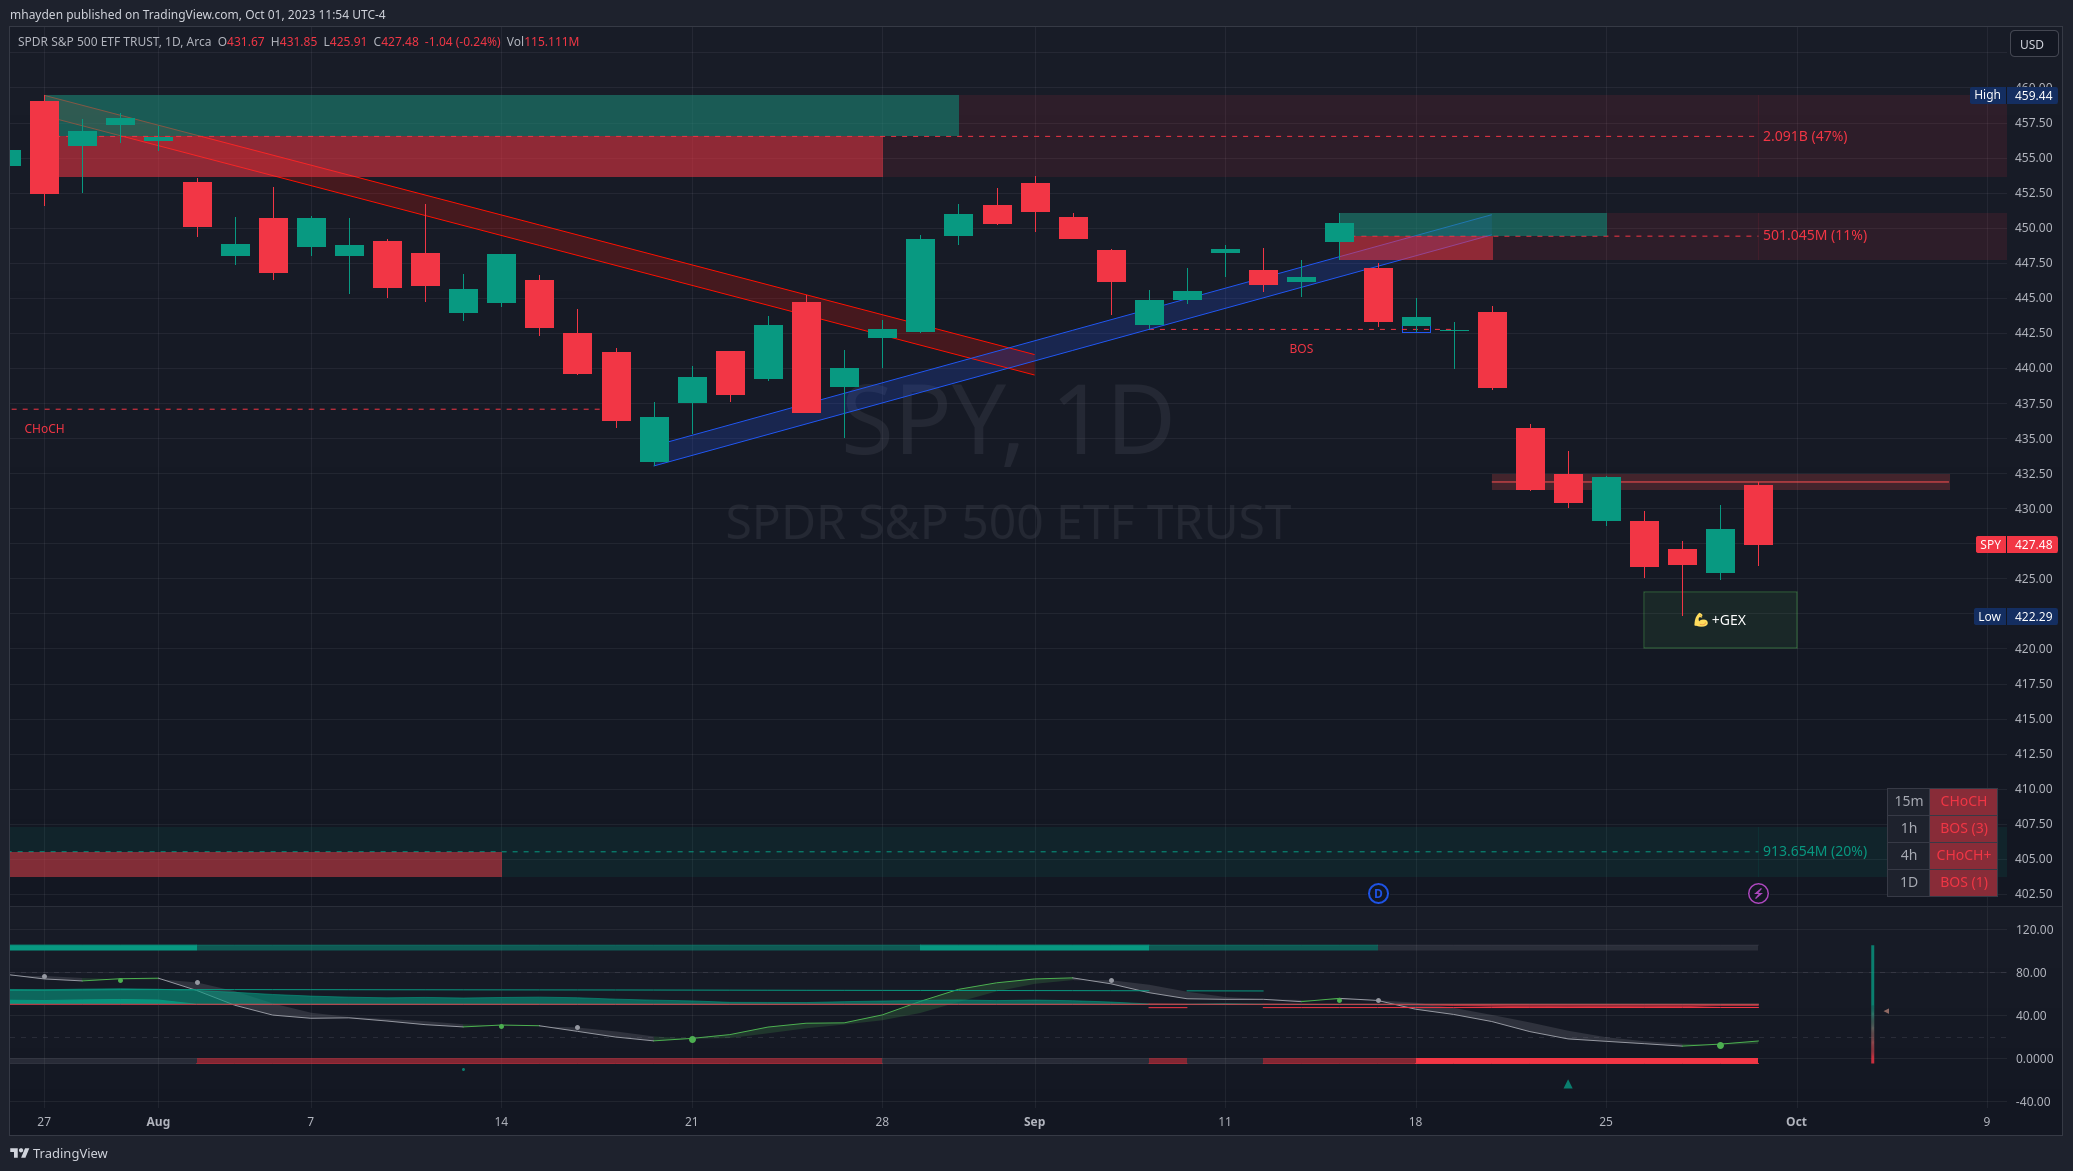
If we're headed up: SPY really needs to break through the FVG just under $432.50 to get a run higher to around $437 where we have a gap from earlier in September. If we keep running through that gap, we have a bearish order block near $450.
If we're headed down: There's still that positive gamma exposure down there around $420, but we're focused on price and volume in this post! We have a bullish order block down around $405 that could be a base. $400 is a big psychological support level and we have some critical VWAPs from the COVID low/high in the $380's.
AMD
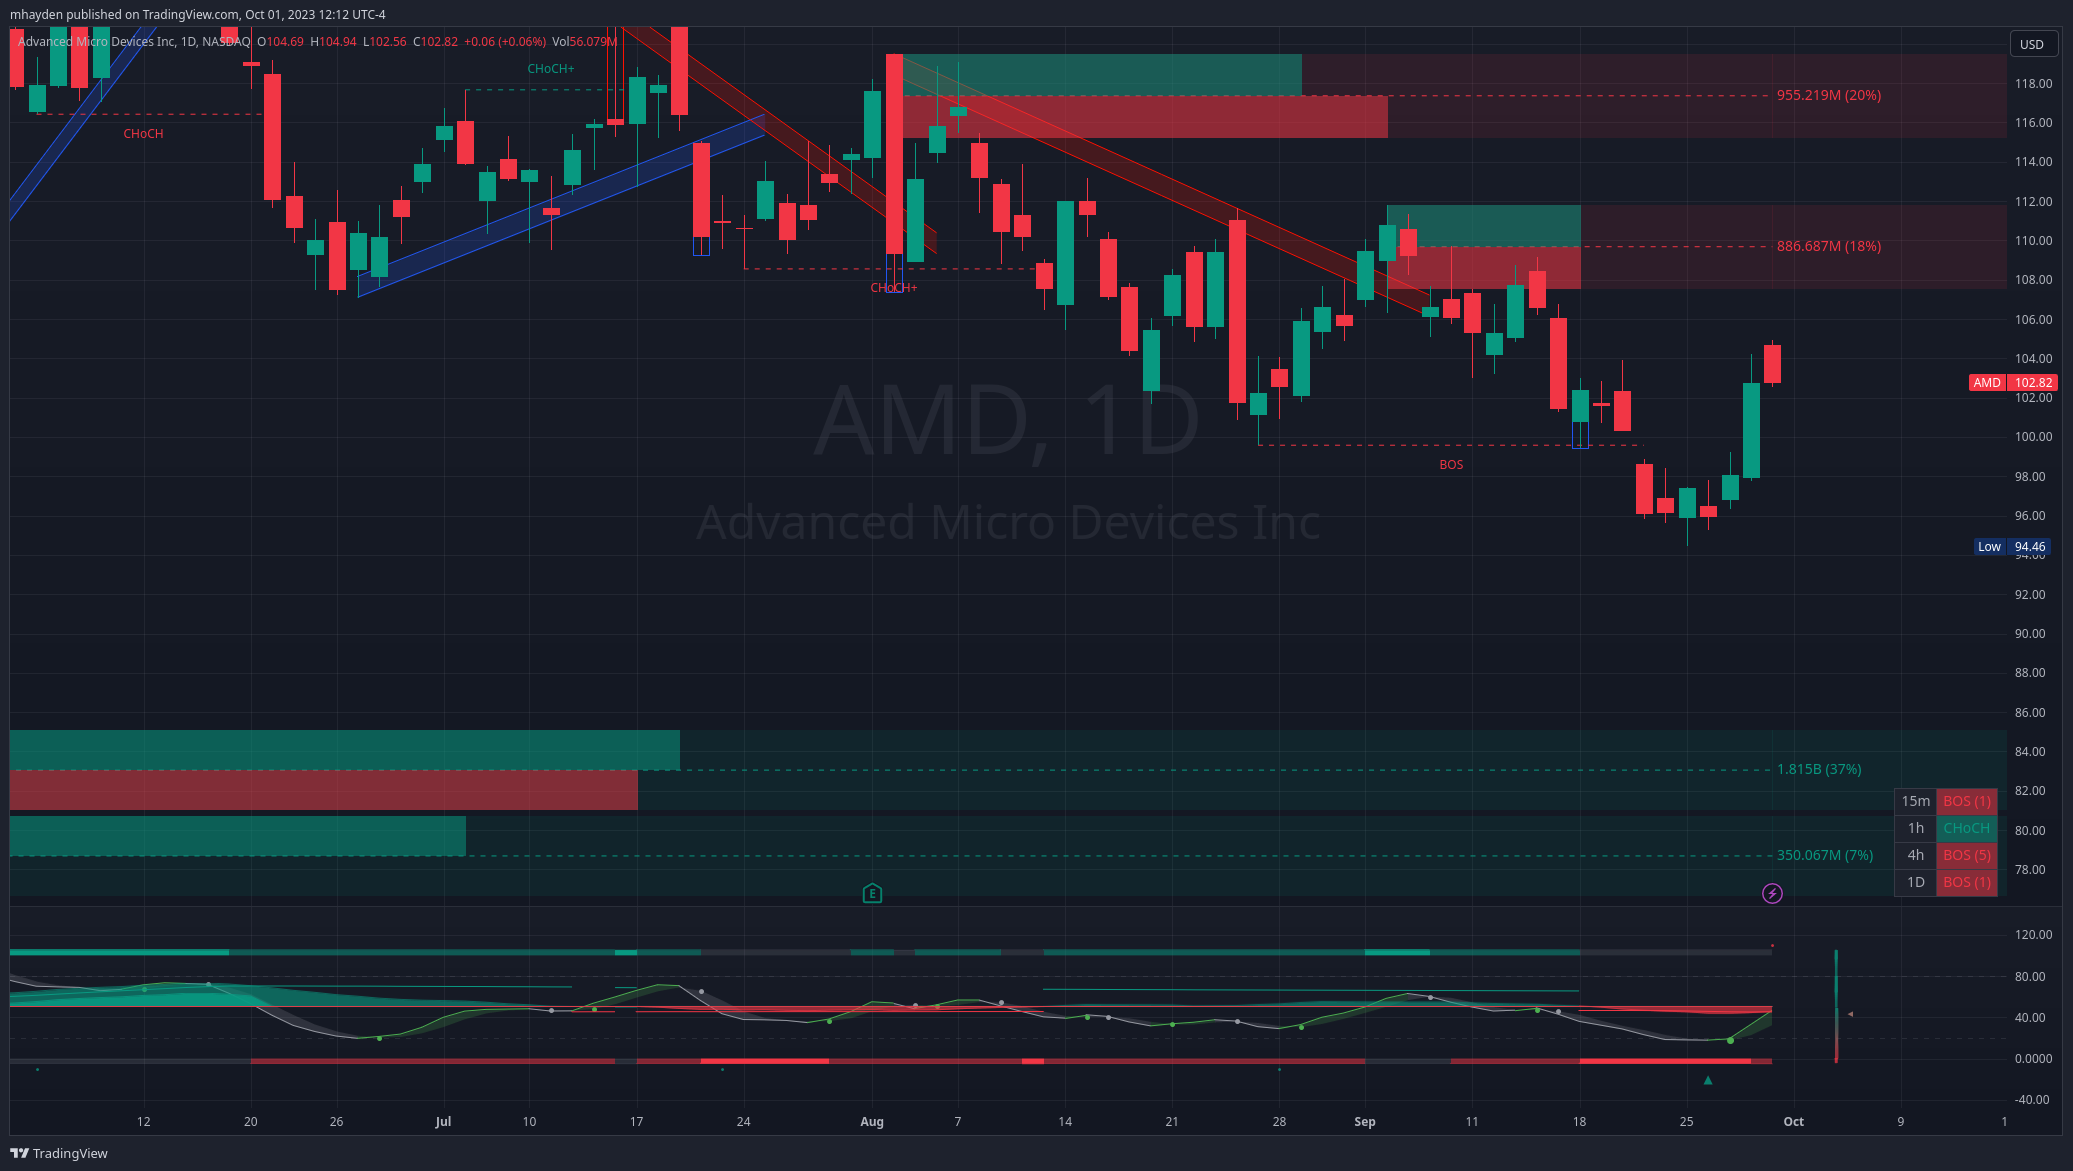
AMD had a good rally over $100 this week, but it stalled out on Friday. There was a bullish order block just above $100 and AMD crossed it, retested it, and moved higher on Friday. We also filled the $99 gap with significant volume as if it wasn't even there on the chart. These are strong bullish signs for me.
AMD turned bullish on the 15 minute and 1 hour time frames, but then the 15 minute turned bearish again on Friday. It looks like it's building out the right mechanics for a move higher but it's still unclear where it's going in the short term.
This chart makes it difficult to tell why AMD stopped falling at $96 and stopped rallying at $105, but check the next chart to see my theory.
On the four hour timeframe, there was a bearish liquidity grab Thursday morning right below a big positive gamma exposure level. In addition, if I bring over my gamma exposure levels from Tradytics, AMD followed them almost perfectly. Negative gamma exposure acts much like a magnet for price while positive gamma repels price action in both directions.

If we're headed higher: $105 seems to be a limiter for now based on gamma exposure as well as the liquidity grab. AMD has some bearish order blocks from $108-$112 and $116-$120. That area around $120 has been a challenge for AMD for months.
If we're headed lower: AMD still has a decent amount of negative gamma exposure around $95 that could be a magnet for price. There are two order blocks that run from $76-$86 where I would expect to see AMD get a bounce.
TSLA
I'm not sure what's easier: predicting the weather or predicting TSLA's price moves. 🤭 TSLA made a big doji candle on Friday after coming off the $240 level earlier in the week.
TSLA looks bullish on the 15 minute and 1 hour time frames, but that's about it. LuxAlgo's oscillator also suggests TSLA and AMD are in the same boat: the elements are there for a rally but the execution just isn't happening yet.
Note the bullish liquidity grab from Monday as a slew of orders came through near $240. This is usually a bullish sign but it may take time to develop.
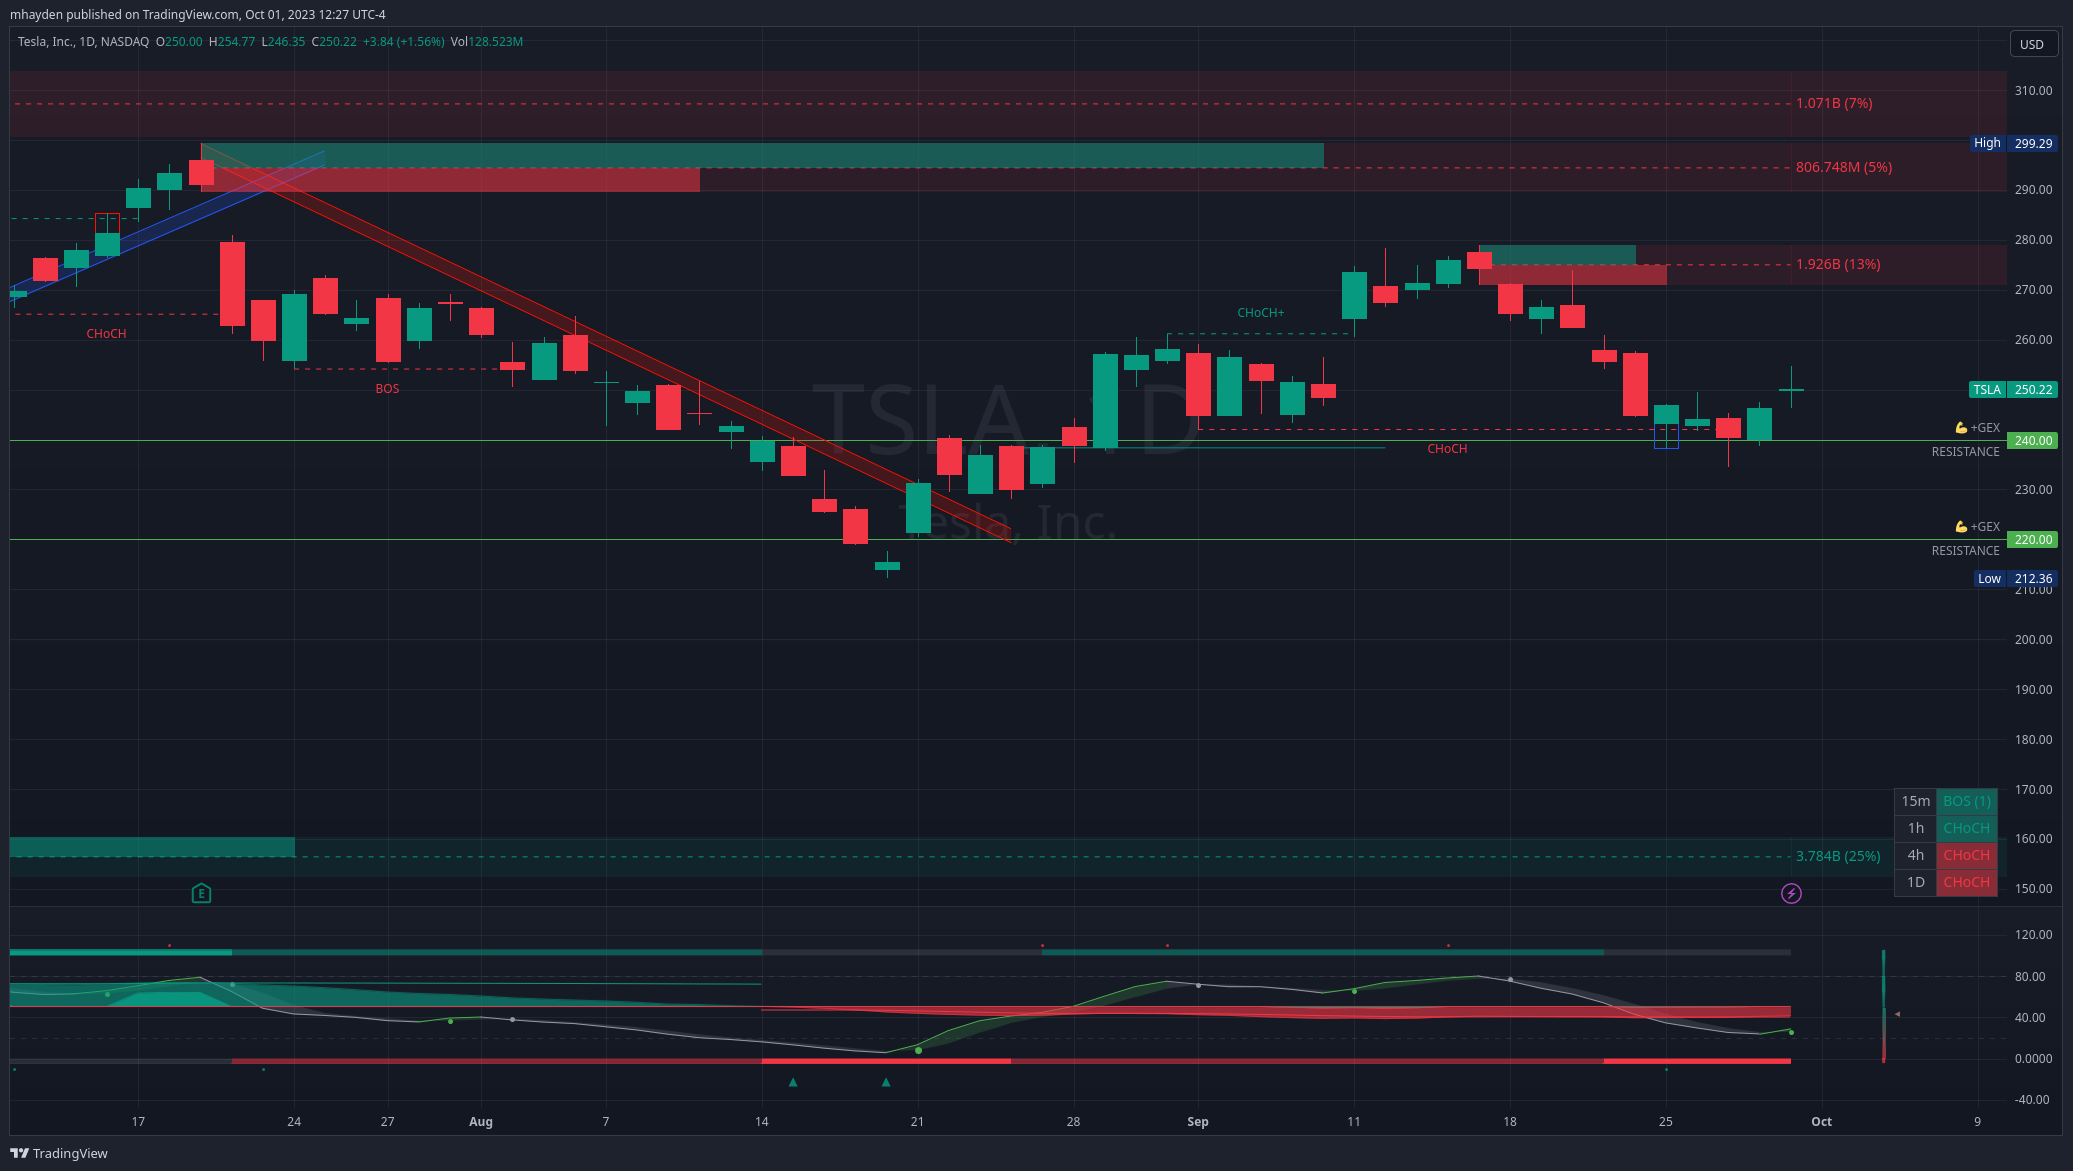
If we're headed higher: TSLA has a small order block in the $270-$280 area that likely won't have a large impact on price. There are more order blocks above that level, but they're even smaller. $300 might be reachable but it's going to take some work to get there.
If we're headed lower: TSLA made higher lows off the $220 and $240 levels, so if it retests those, I would expect some support there. That $220 bounce from August came up on some serious volume. Below $220, there's an order block around $150-$160.
The biggest order block on the chart is from January 2023's pivot and it's massive (51% of the total order volume). That's way down around $110. TSLA has plenty of support levels between its current price and that level.
Final thoughts
TSLA and AMD both have a good potential for a rally as more and more technicals turn in their favor. However, if SPY can't find its way past $432, it may not matter. The overall market could keep sinking and take both of these equities with it.
My plan is to watch SPY's $420 level like a hawk. We tested it once last week and if we test it again, the results of that test will be really important. A break below doesn't leave us much to work with until $400-$410. That type of drop would be a 12.79% correction and we've only corrected 8% so far.
Losing $400 means we're likely relying on VWAPs from the COVID high/low in the $380's. That would be a 17% correction.
Good luck to everyone this week! ☘️
Discussion