Charts and Coffee for September 17 ☕

Let's take a look at AMD and TSLA as we head into a rocky week of potential interest rate changes.

It's Sunday morning and that's a great time for charts and coffee. This is my weekly post where I focus on the two things that never lie in the market: price and volume. They're both found on stock charts for free! 📈
I'll be back to options data tomorrow, but for today, it's charts only! I often look at short time frames during the week, so this post will examine longer time frames on the charts.
All investments come with significant risks, including the loss of all capital. Please do your own research before investing, and never risk more than you are willing to lose. I hold no certifications or registrations with any financial entity.
Let's get started.
AMD
First up is a weekly chart since February 2022 with exponential moving averages (EMA) lines at 20, 50, and 200 weeks. MACD and RSI are at the bottom with volume (and a 20MA volume trend line) in the middle. I'm using Heikin Ashi (HA) candlesticks here.

The big pivot from the end of 2022 had three strong waves of rallies with a fourth wave kicking off last May. Since then, AMD's chart has been full of indecision. We've had 13 weeks since the most recent high and 10 of those candles have been dojis. This suggests that although price has slowly drifted down, there's a disagreement among traders about AMD's price.
AMD's price was perched on the 20 week EMA line, but it fell through on Friday. However, I don't trust much of Friday's price action because it was a quadruple witching day in the market and there are so many forces in play on those days. AMD's 50EMA sits around $99 and the 200EMA is around $82.
As for the MACD, the fast line is outrunning the slow line to the downside. That suggests a decent momentum downwards. AMD's 14-week RSI is right around 50%.
Volume has been below average for five out of the last six weeks. Combine that with a slew of dojis and it makes me think that traders are waiting for something. Could it be the Fed's interest rate decision? Could it be AMD's earnings on October 31? 🎃 I'm not quite sure.
Let's remove some clutter from the chart and just look at volume weighted average price (VWAP) lines:
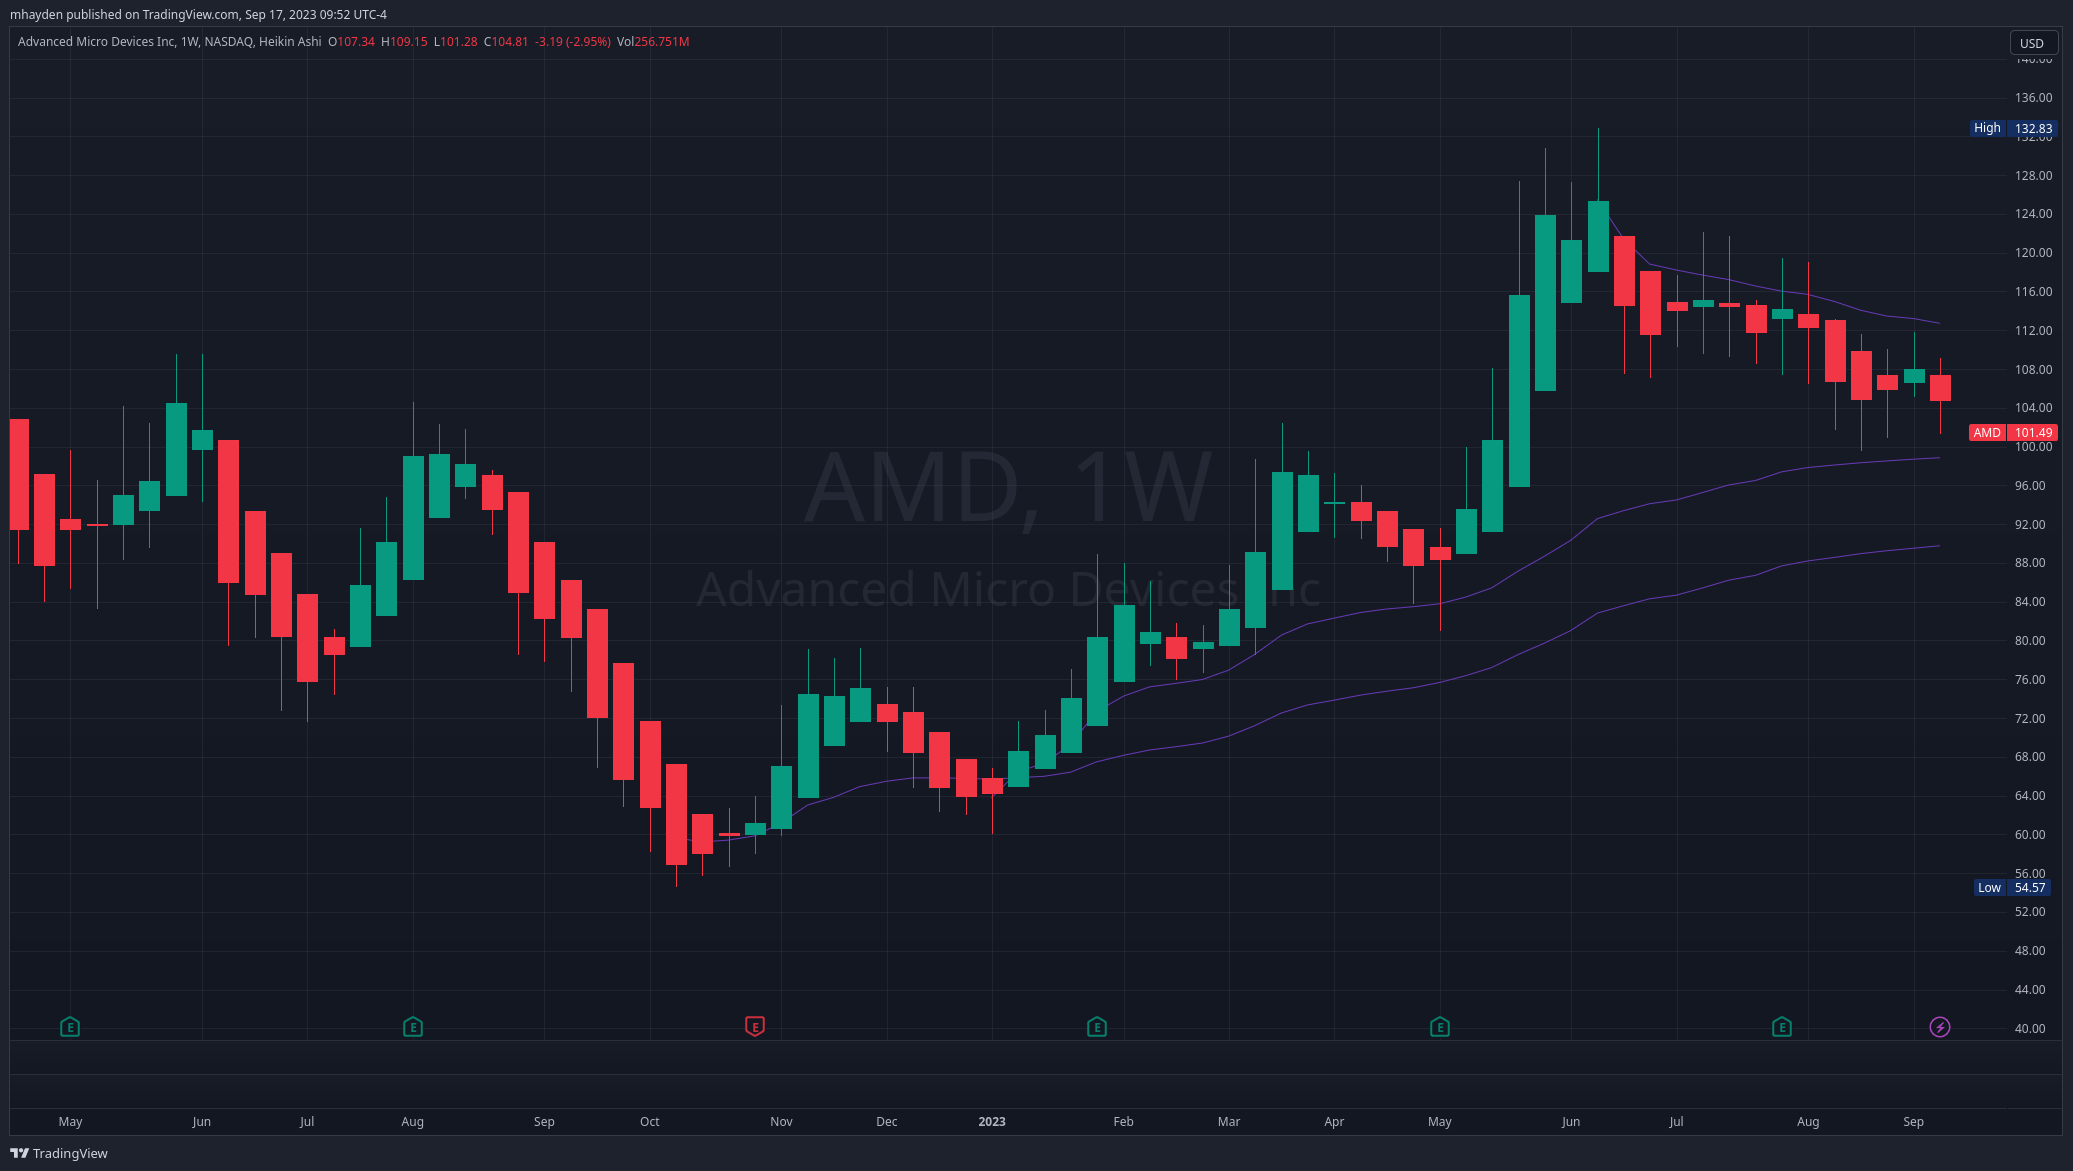
What I notice here is that we're trending below the VWAP from the most recent high back in June. It woulbe nice to break that line which sits just above $112. VWAP lines from the late 2022 and early 2023 pivots are still below our current price and the one from January 2023 could provide support at $100 if we make it there.
This suggests that AMD's current price has enough volume to support it from the recent bottoms, but it doesn't have enough volume at higher prices to pass that upper VWAP line from the recent high.
Where is AMD's highest volume since 2022?

Volume by price (VBP) shows you the prices where the highest volume of trading took place since a certain date. If I select the late 2022 pivot (as shown above), the point of control (PoC) line appears around $110. This means that the highest volume has been around $110 since late 2022.
What's interesting is that if I select nearly any pivot point since late 2022 – whether it's on rally highs or correction lows, the same PoC appears: $110.
We've hit the $110 level multiple times since 2021:
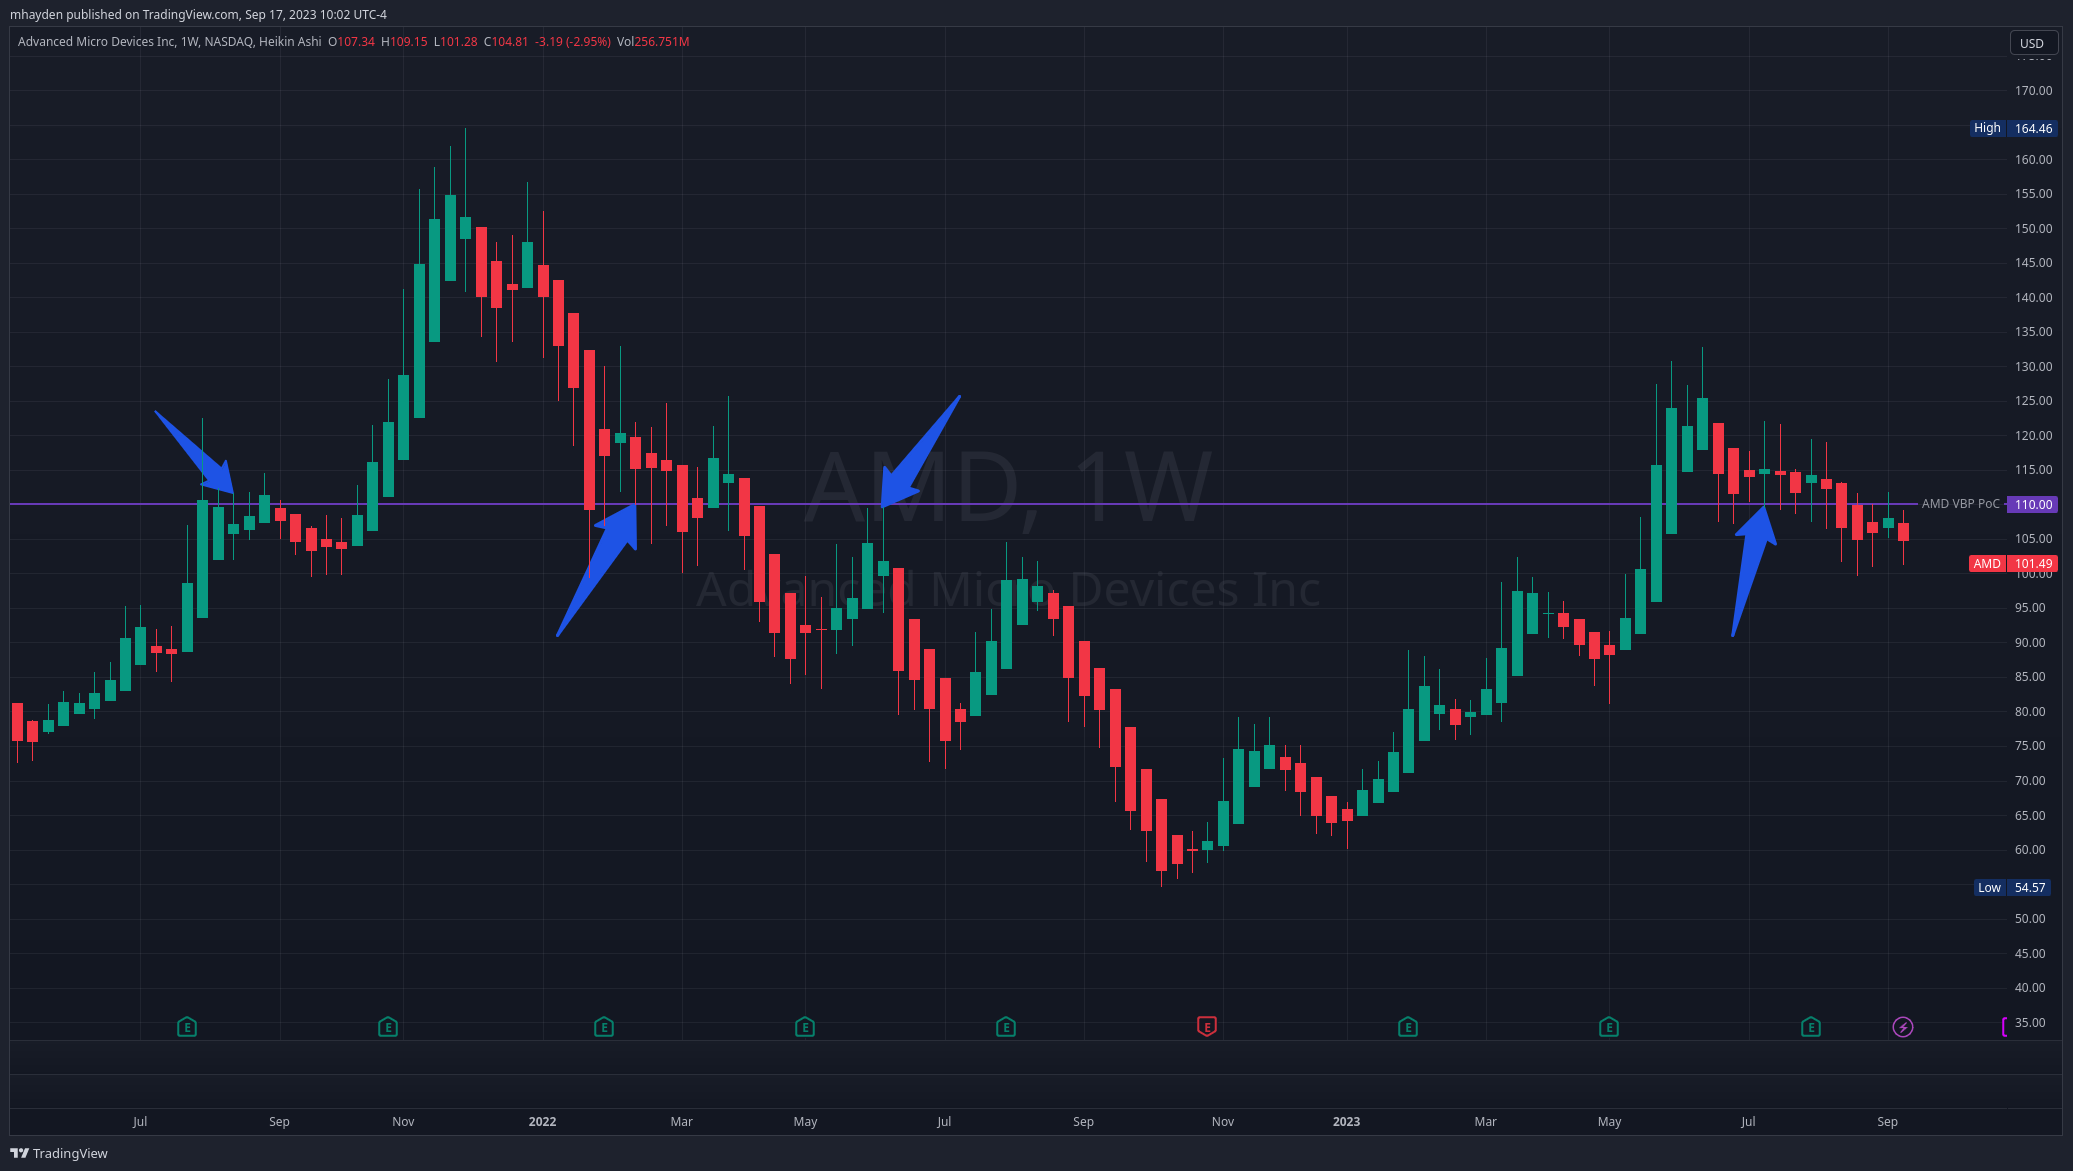
Will $110 be a resistance level as we head lower? Will $110 be a starting point for a new rally? It's difficult to tell for now, but it's definitely a zone to watch.
The charts suggest that $100-$110 could be a decent trading range for the near term, but keep your options open. A surprise announcement from the Federal Reserve or a change in thinking around AI could break the indecision we've seen recently. Also, AMD earnings are coming up on 10/31. 🎃
TSLA
First off, keep in mind that TSLA is bananas. 🍌 It often ignores trends and its valuation is always contested. It swings a lot based on news (which may or may not be true) and changes in the overall EV and general automotive industries. TSLA also has a CEO that isn't on the most even keel at times. 🤭
Here's a weekly look TSLA with the same setup as AMD earlier:
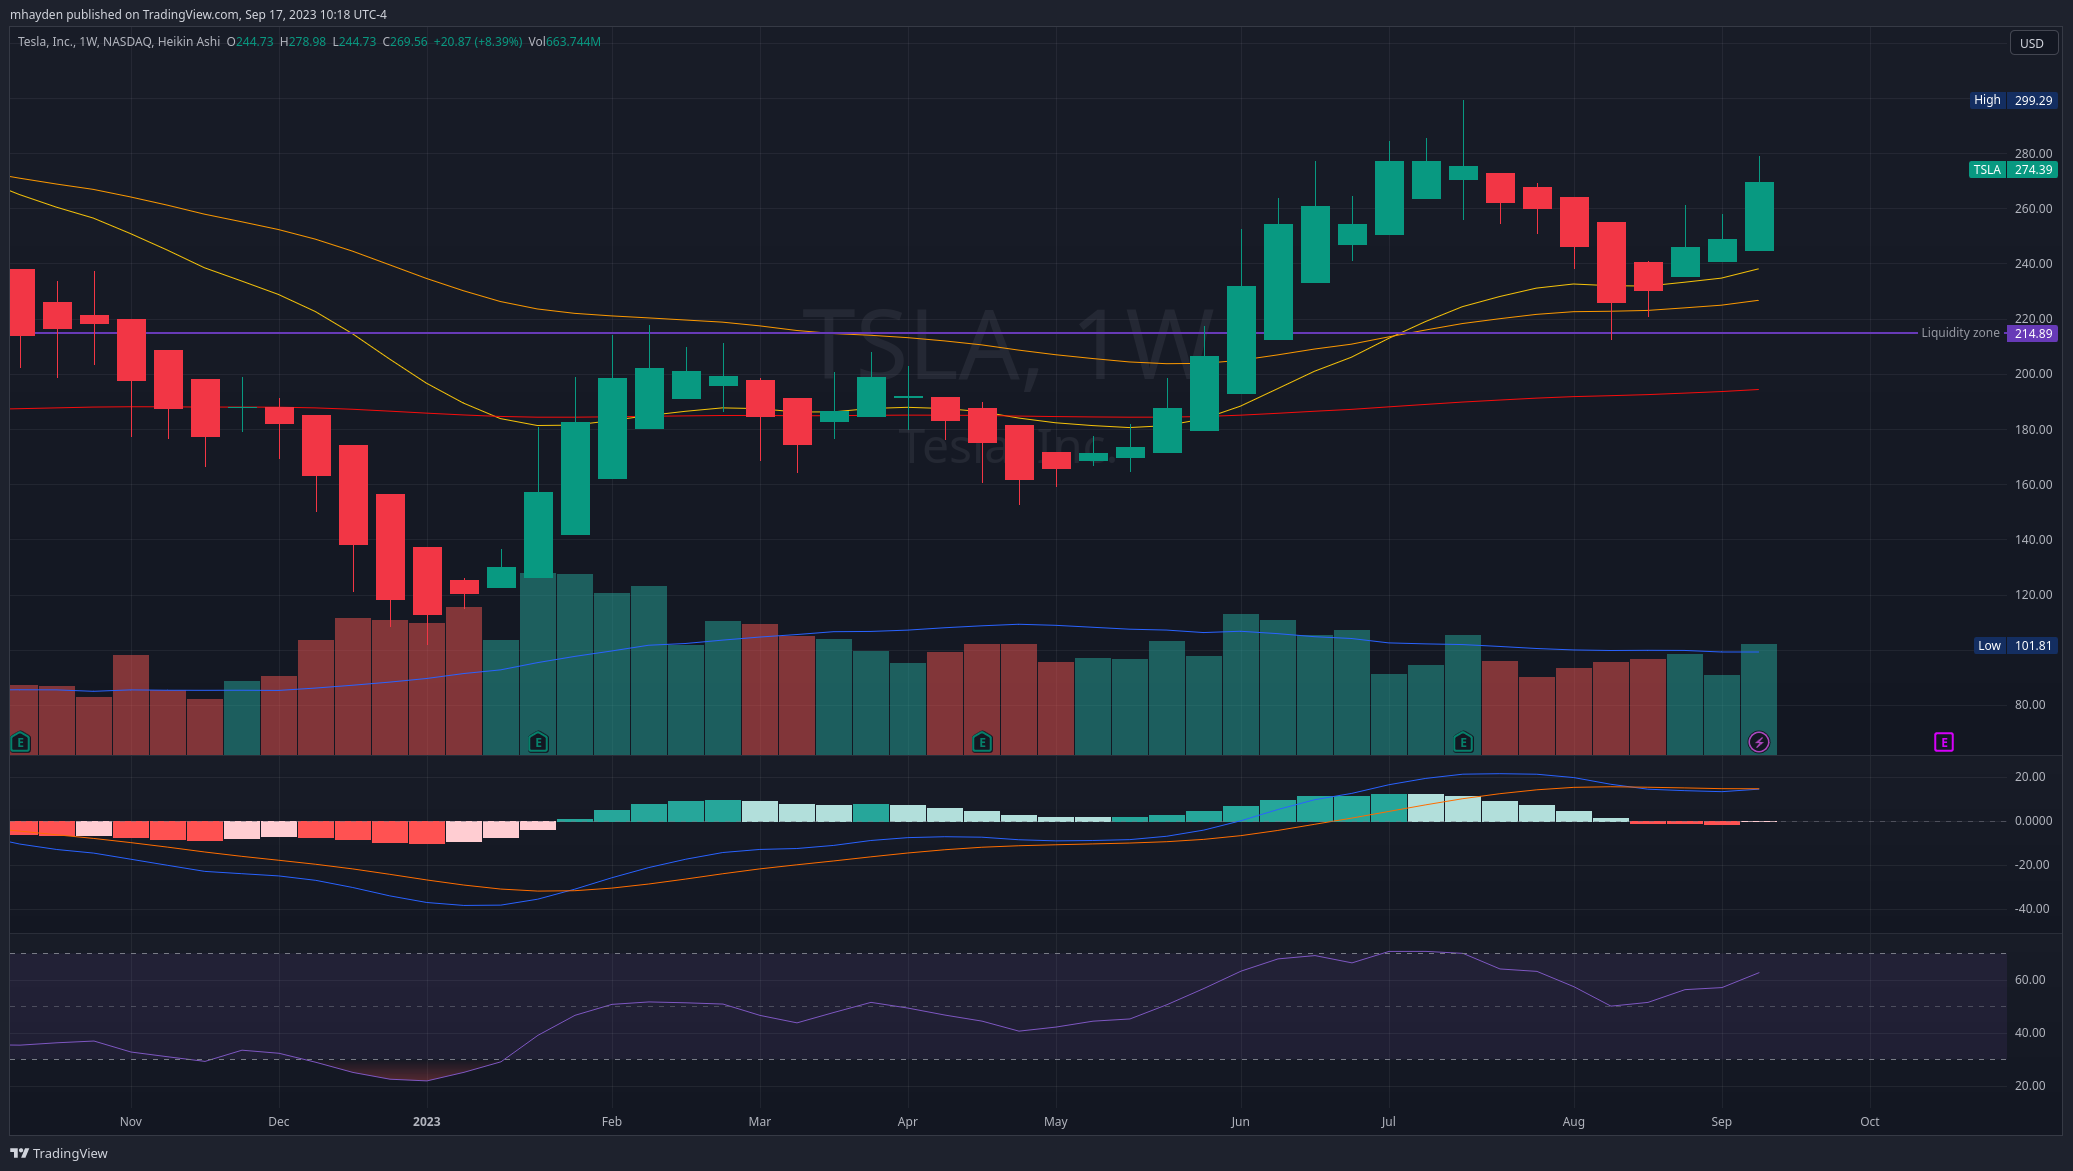
We've had two big rally waves since the start of 2023 with a correction this summer. TSLA fell through its weekly 20EMA five weeks ago and rallied off of that level since then. Volume during the correction was below average and we didn't see a week of above average volume until last week.
A few analysts changed price targets on TSLA last week and it sent the market into a frenzy. I don't follow those closely as I remember how excited analysts were about Enron and MCI Worldcom before their eventual ends.
TSLA's most recent three weeks show a strong rally with three HA candles with no wicks underneath. TSLA reports earnings on October 18th.
The MACD shows momentum above zero but the gap between the fast and slow lines are very small. The 14-week RSI sits just above 60%. I'd say TSLA is running a little warm (not hot) and it has some room to move higher.
Let's clear the clutter and just look at VWAP lines:
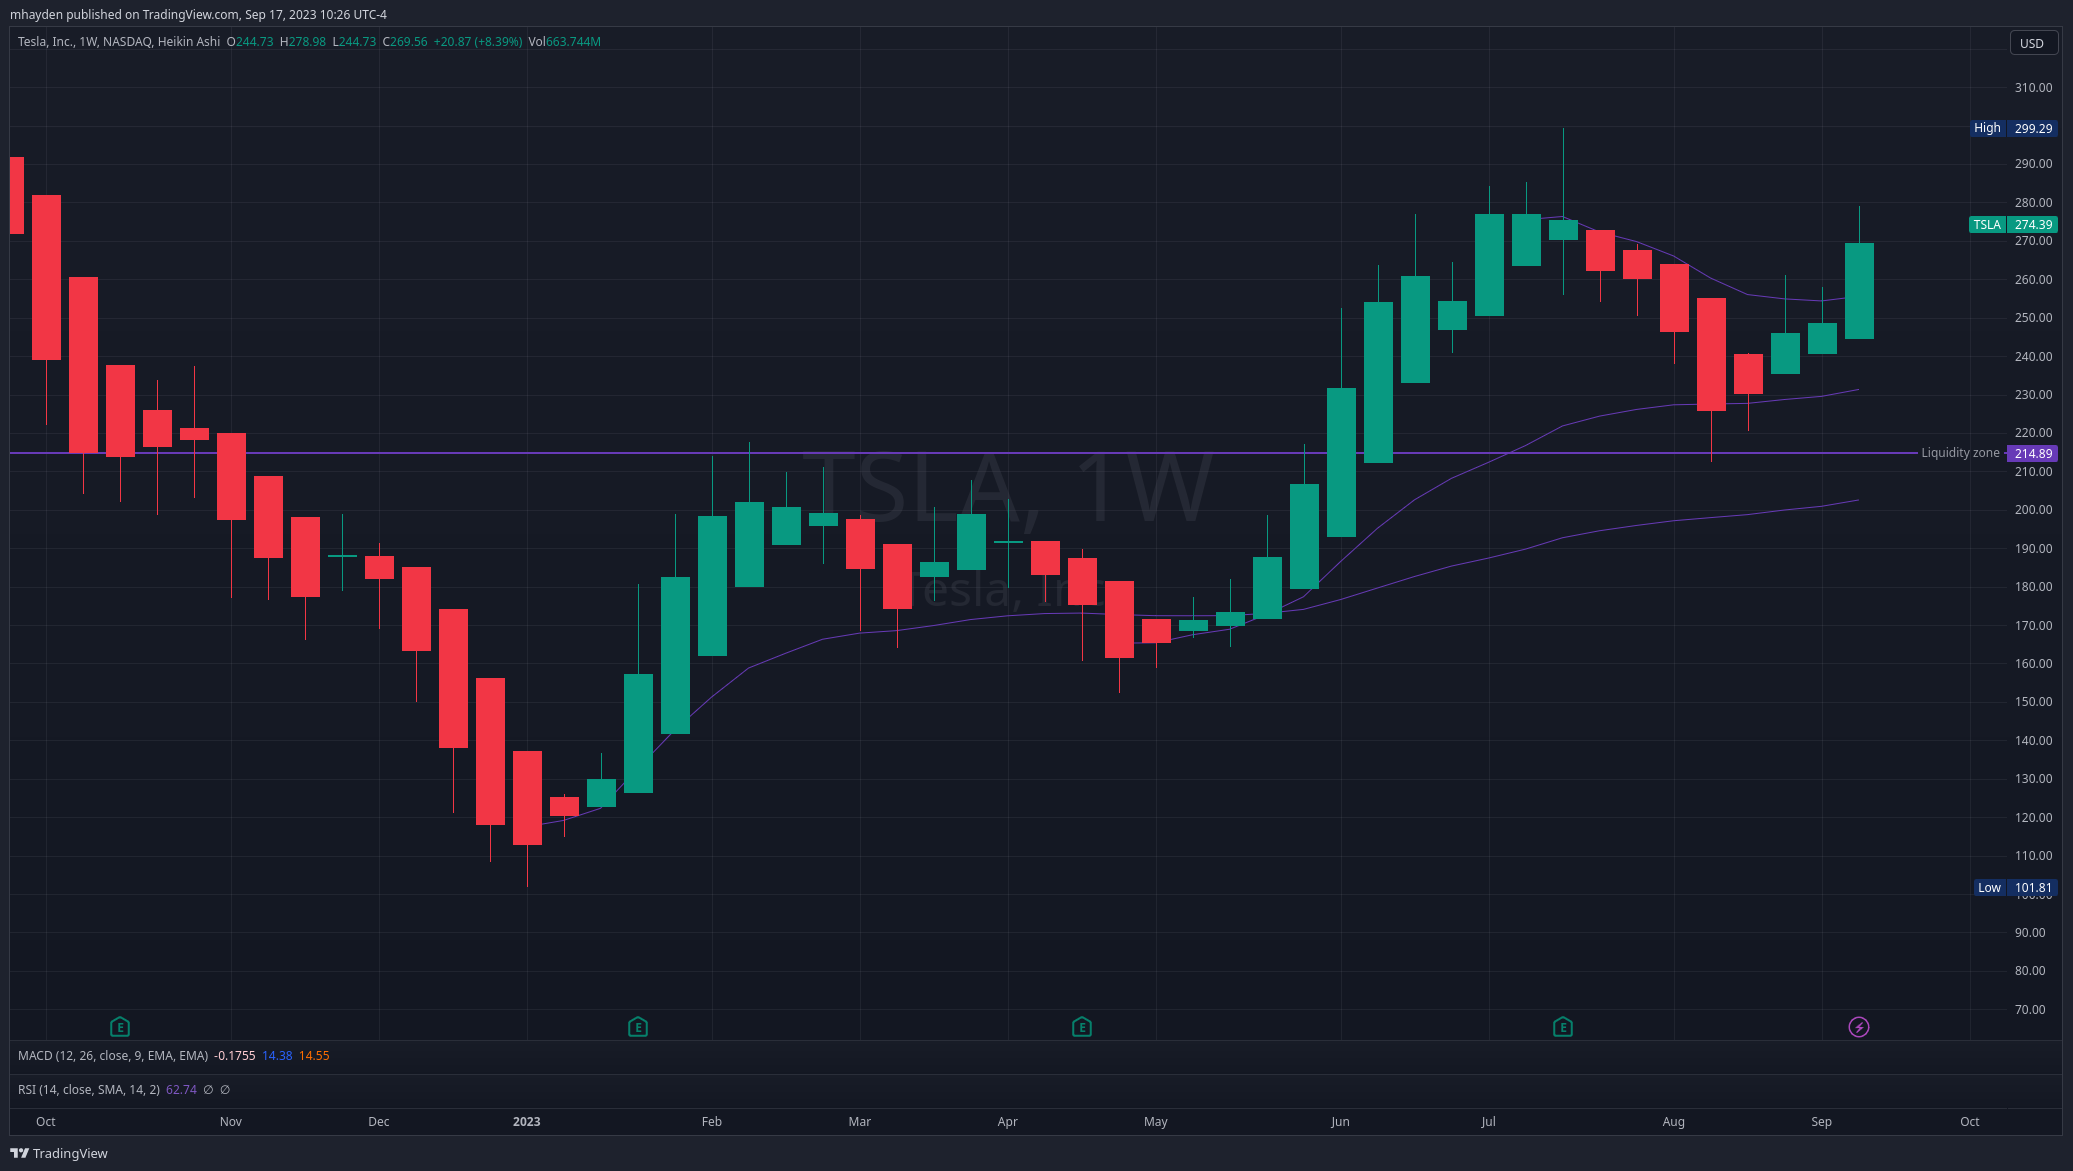
TSLA remains above both VWAP lines from its pivots in January and May 2023. That's a good sign that there's enough volume to carry TSLA higher. In addition, TSLA broke aggressively through the VWAP from the July high last week.
Could we be entering a third rally wave like the ones we saw earlier this year? Possibly.
Let's take a look at TSLA's volume by price:

TSLA's point of control is just under $260 since the January pivot. This pattern looks fairly similar to the one I saw on AMD's charts. Also, even if I change the timeframes for the indicator, that level under $260 remains the highest volume level on the chart.
Although TSLA is famously unpredictable, there's a lot to suggest we're headed higher:
- We've just finished a second wave and second correction with a strong bounce off $215.
- Last week's volume was above average and it sent us above the VWAP down from the recent high.
- Much of TSLA's volume is at $260 and that should provide support for a move higher.
- We've just finished three weeks of HA candles that indicate a strong rally.
- Price is above all three EMA lines and candles launched off the 20EMA with volume.
Thesis
TSLA definitely has the cleaner chart of the two and it looks like it has the room and volume to kick off another wave upwards. AMD traders appear to be very undecided about the future price.
TSLA built a good base at $260 to build on but I'm eager to see if it can break above the $277-$278 range where it struggled earlier this year. It nearly made it there this week.
As for AMD, I'm eager to see what kind of pattern develops. We had three clean waves of rallies in 2023, but that momentum has stalled. Semiconductors are famous for being volatile and there's plenty of change happening in consumer and business computing environments.
I absolutely love AMD in the $90-$110 zone as that seems like a good valuation to me, with or without AI hype being involved.
Good luck to everyone this week! ☘️ Keep a close eye on the Federal Reserve's interest rate announcements on September 20th as a surprise there would certainly have an impact on the market. 👀
Discussion