Charts & Coffee & What the heck happened?

I missed this week's rally and now I'm looking back to improve my skills. This post covers my thought process around identifying my blind spots. 👓

This edition of Coffee is a bit different. Sure, I'm writing it later in the day when a cup of coffee doesn't make much sense, but the big difference is that I want to better understand what clues I missed about this week's rally.
All investments come with significant risks, including the loss of all capital. Please do your own research before investing, and never risk more than you are willing to lose. I hold no certifications or registrations with any financial entity.
I'll share my journey to discover where I made a mistake.
What happened last week
The VIX started dropping long before the FOMC meeting began and I'd argue it started falling the day earlier. However, all of the vanna charts I looked at suggested that it would be difficult for price to rise past its current level. There was a bunch of negative vanna in place and it seemed like SPX was getting weaker.
Wednesday looked moderately bullish, which wasn't surprising, but Thursday and Friday caught me entirely off guard.
I had a few defined risk trades in play that I made on a bearish bet and they started looking ugly on Friday.
SPX vanna comparisons
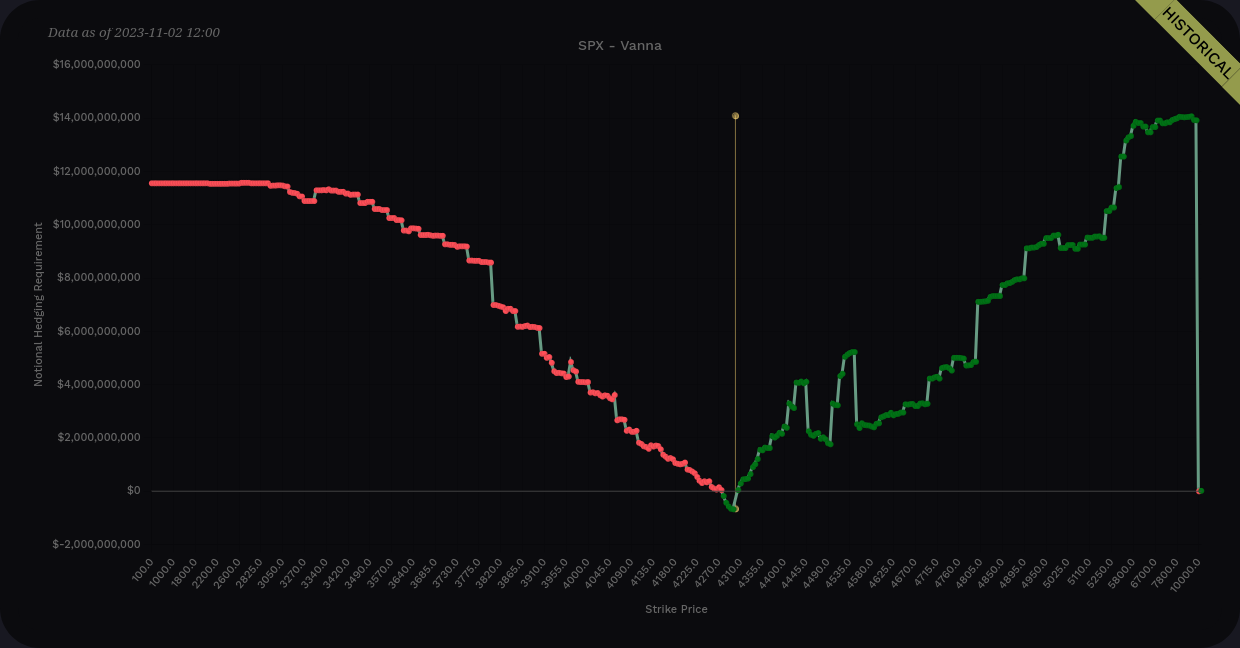
To start, let's examine the SPX vanna charts from last week on Monday, Tuesday, and Wednesday. These are all from 12PM Eastern:
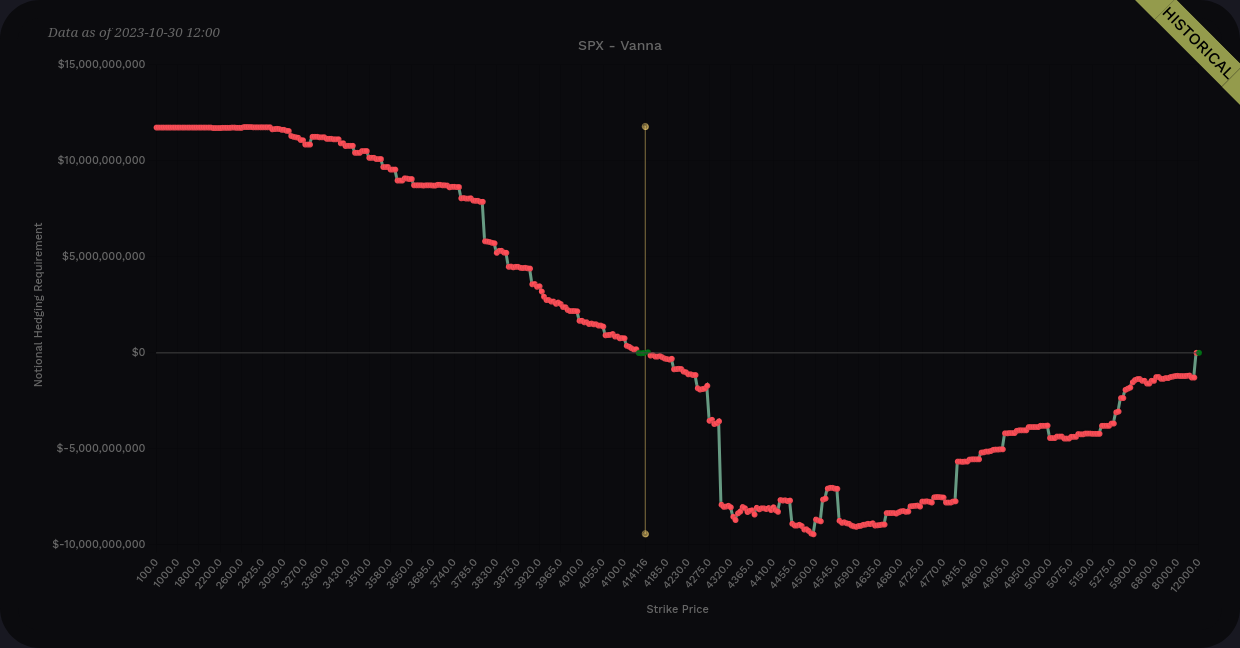
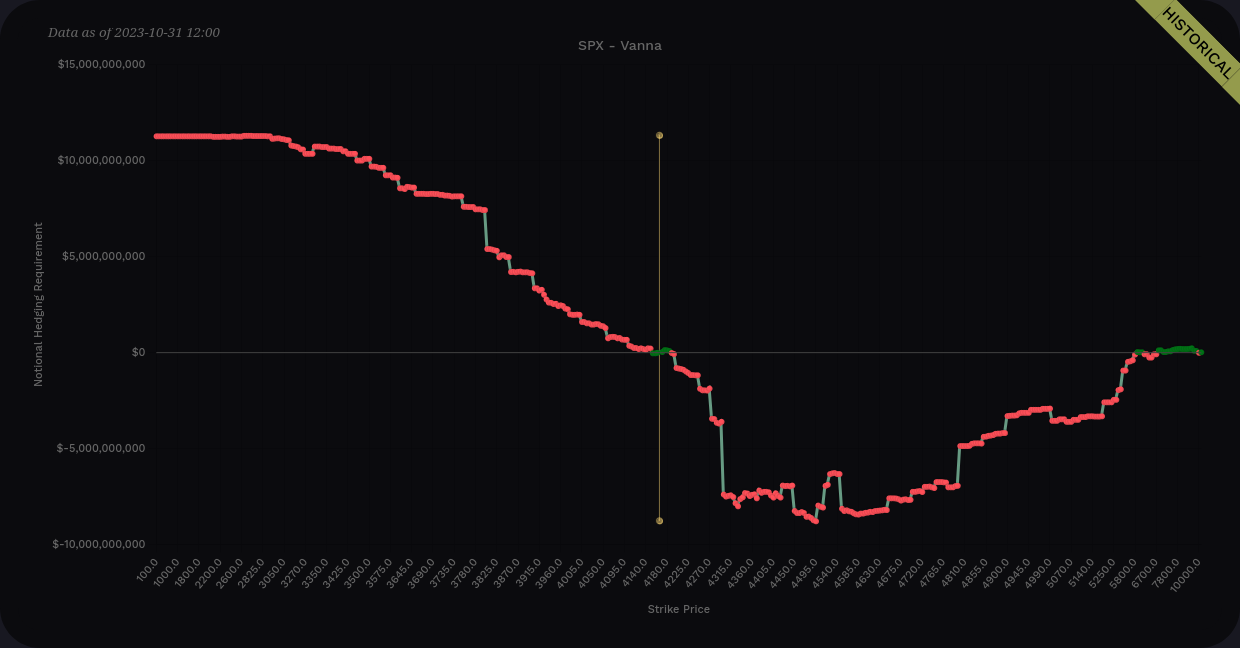
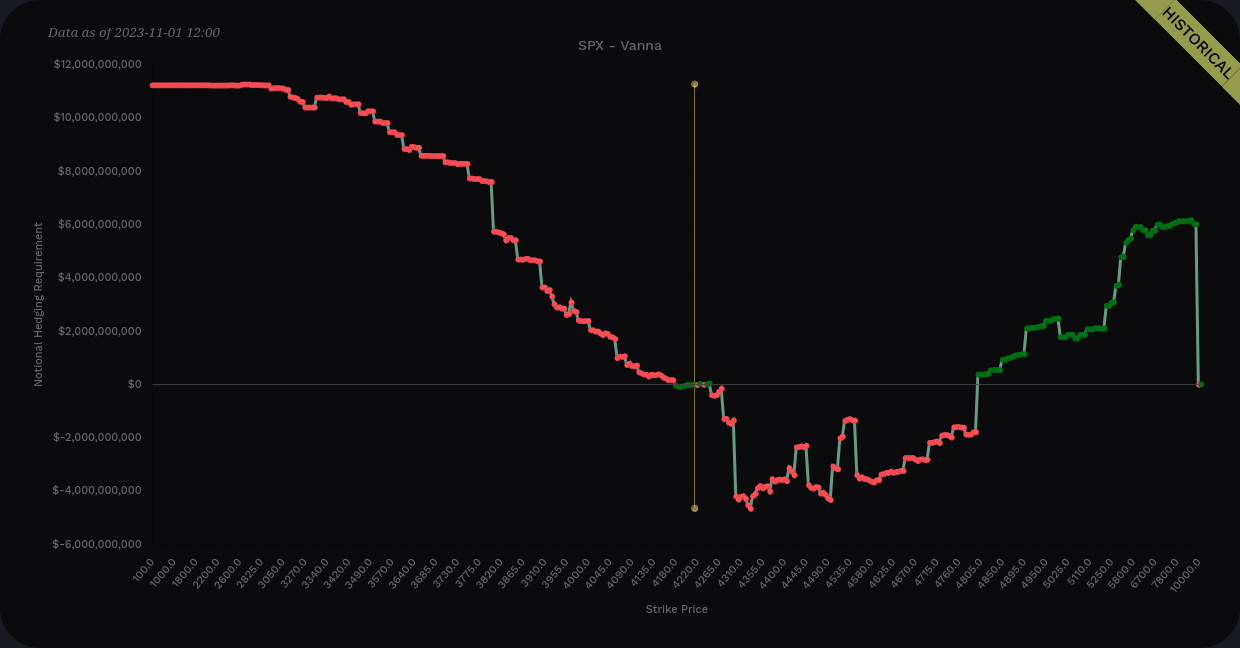
Vanna charts from 10/30, 10/31, and 11/1
What do they have in common? All three had definite negative vanna ahead of the current price, especially around 4300.
What changed? Look at how the vanna above 4300 started becoming more and more positive as the week went on. Finally, Wednesday showed a massive positive zone in the right fourth of the chart.
Let's look at the charts from Thursday and Friday, both at 12PM Eastern:
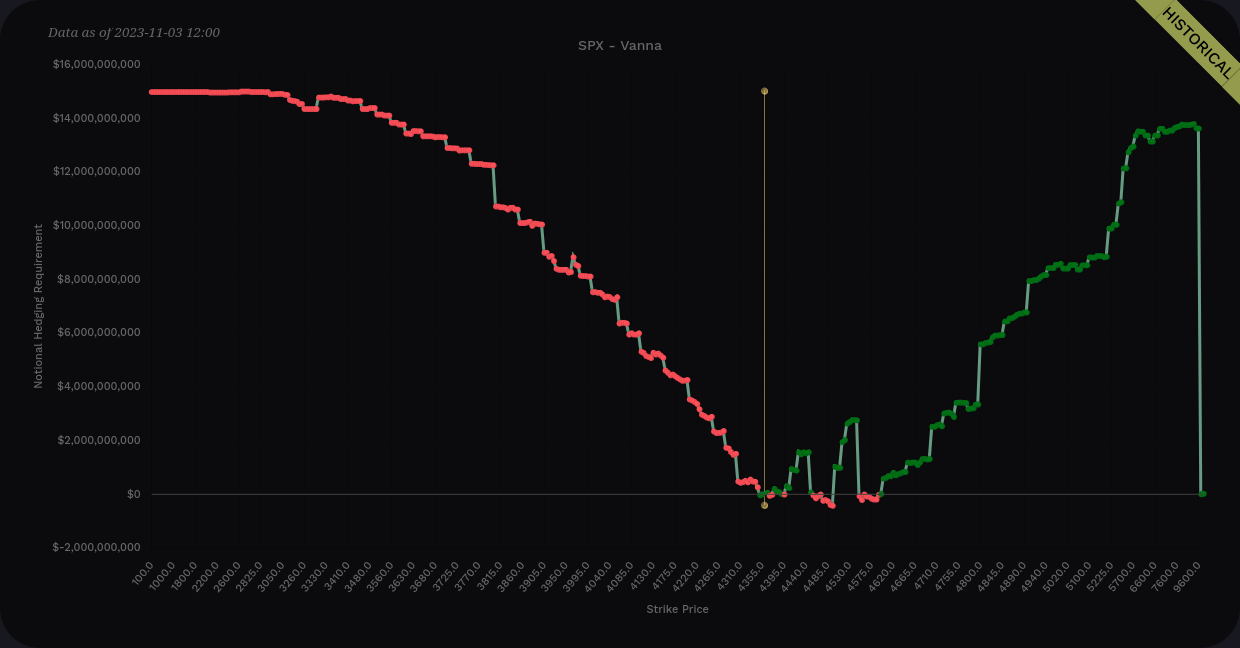
Good gosh! 🤯
Negative vanna above the price nearly disappeared and the right side of the chart went higher than the left. That's a recipe for a strong rally when IV drops. I totally missed the differences in these charts and left some trades on the board that I should have taken down.
So what was happening with the VIX at that time?
VIX chart
The VIX tried to re-test its high above $22 on 10/26 and failed. After that, it started moving down fairly aggressively. That drop combined with a shift in vanna should have been an alert for me that a bullish rally was inbound.

Yes. I missed it. What now?
I missed the start of the rally with some of the items I already mentioned, but now it's time to take this knowledge and look forward. Is there more fuel left in this rally?
First off, let's have another look at the latest available vanna chart. The curve is still looking quite bullish, but we have some challenges next at 4450 and 4550. There's more than enough positive vanna above those strikes to pull us higher if IV continues to drop. 4800 is the largest positive vanna level on the chart but that's a long way from where we are now.
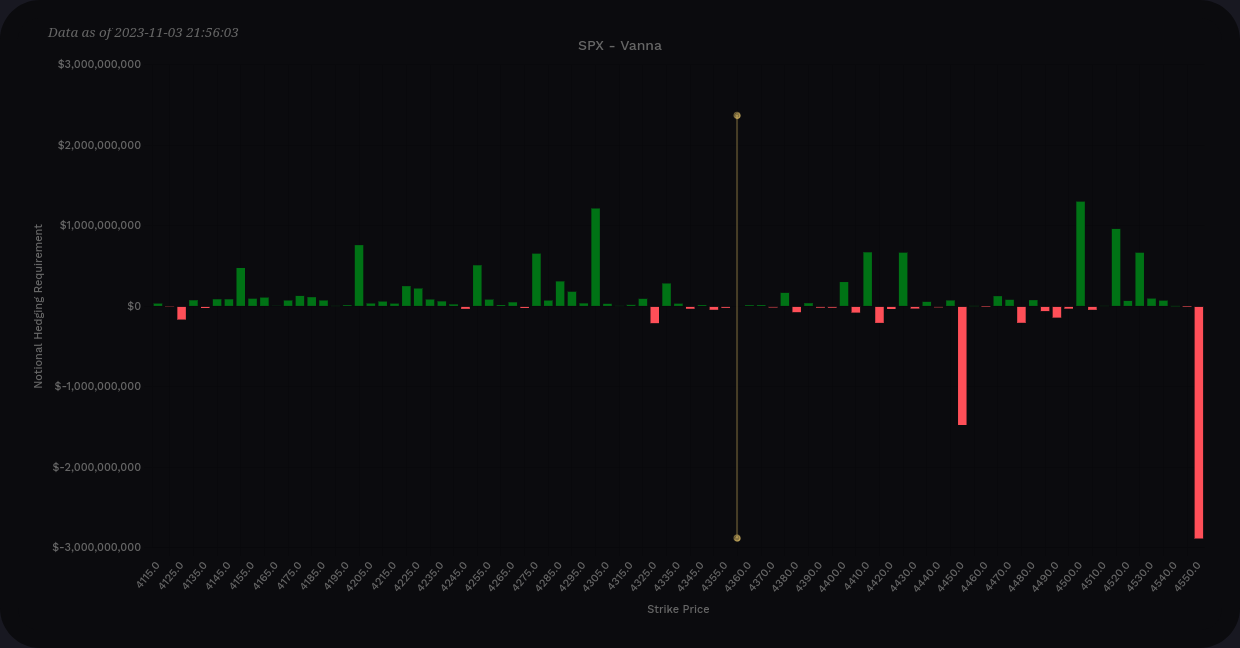
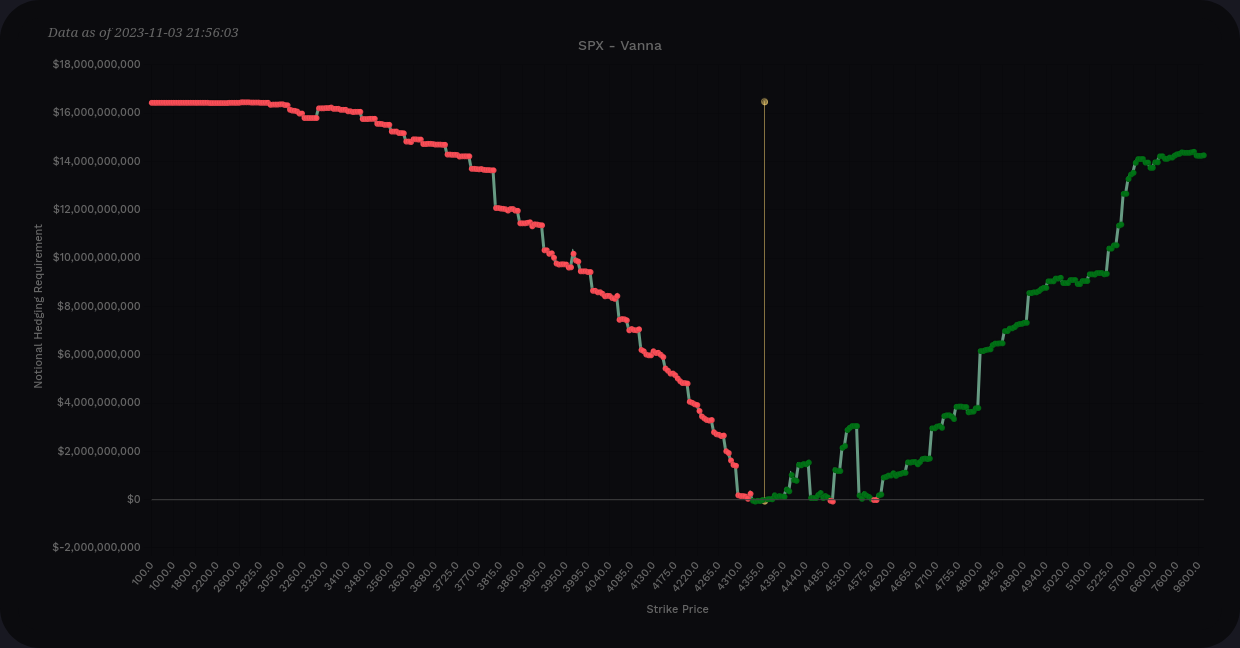
SPX aggregate vanna
On the downside, 4300 is our biggest support level. There are plenty of smaller vanna levels below that level but nothing large until 3800 and 3900.
VIX still has positive money flow (see the VIX chart from the previous section), but the oscillator wave is rocketing downwards after last week. If VIX continues to drive lower, there's a good chance we could see more rallying in the SPX.
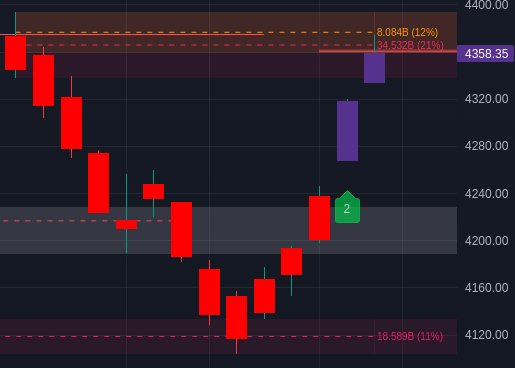
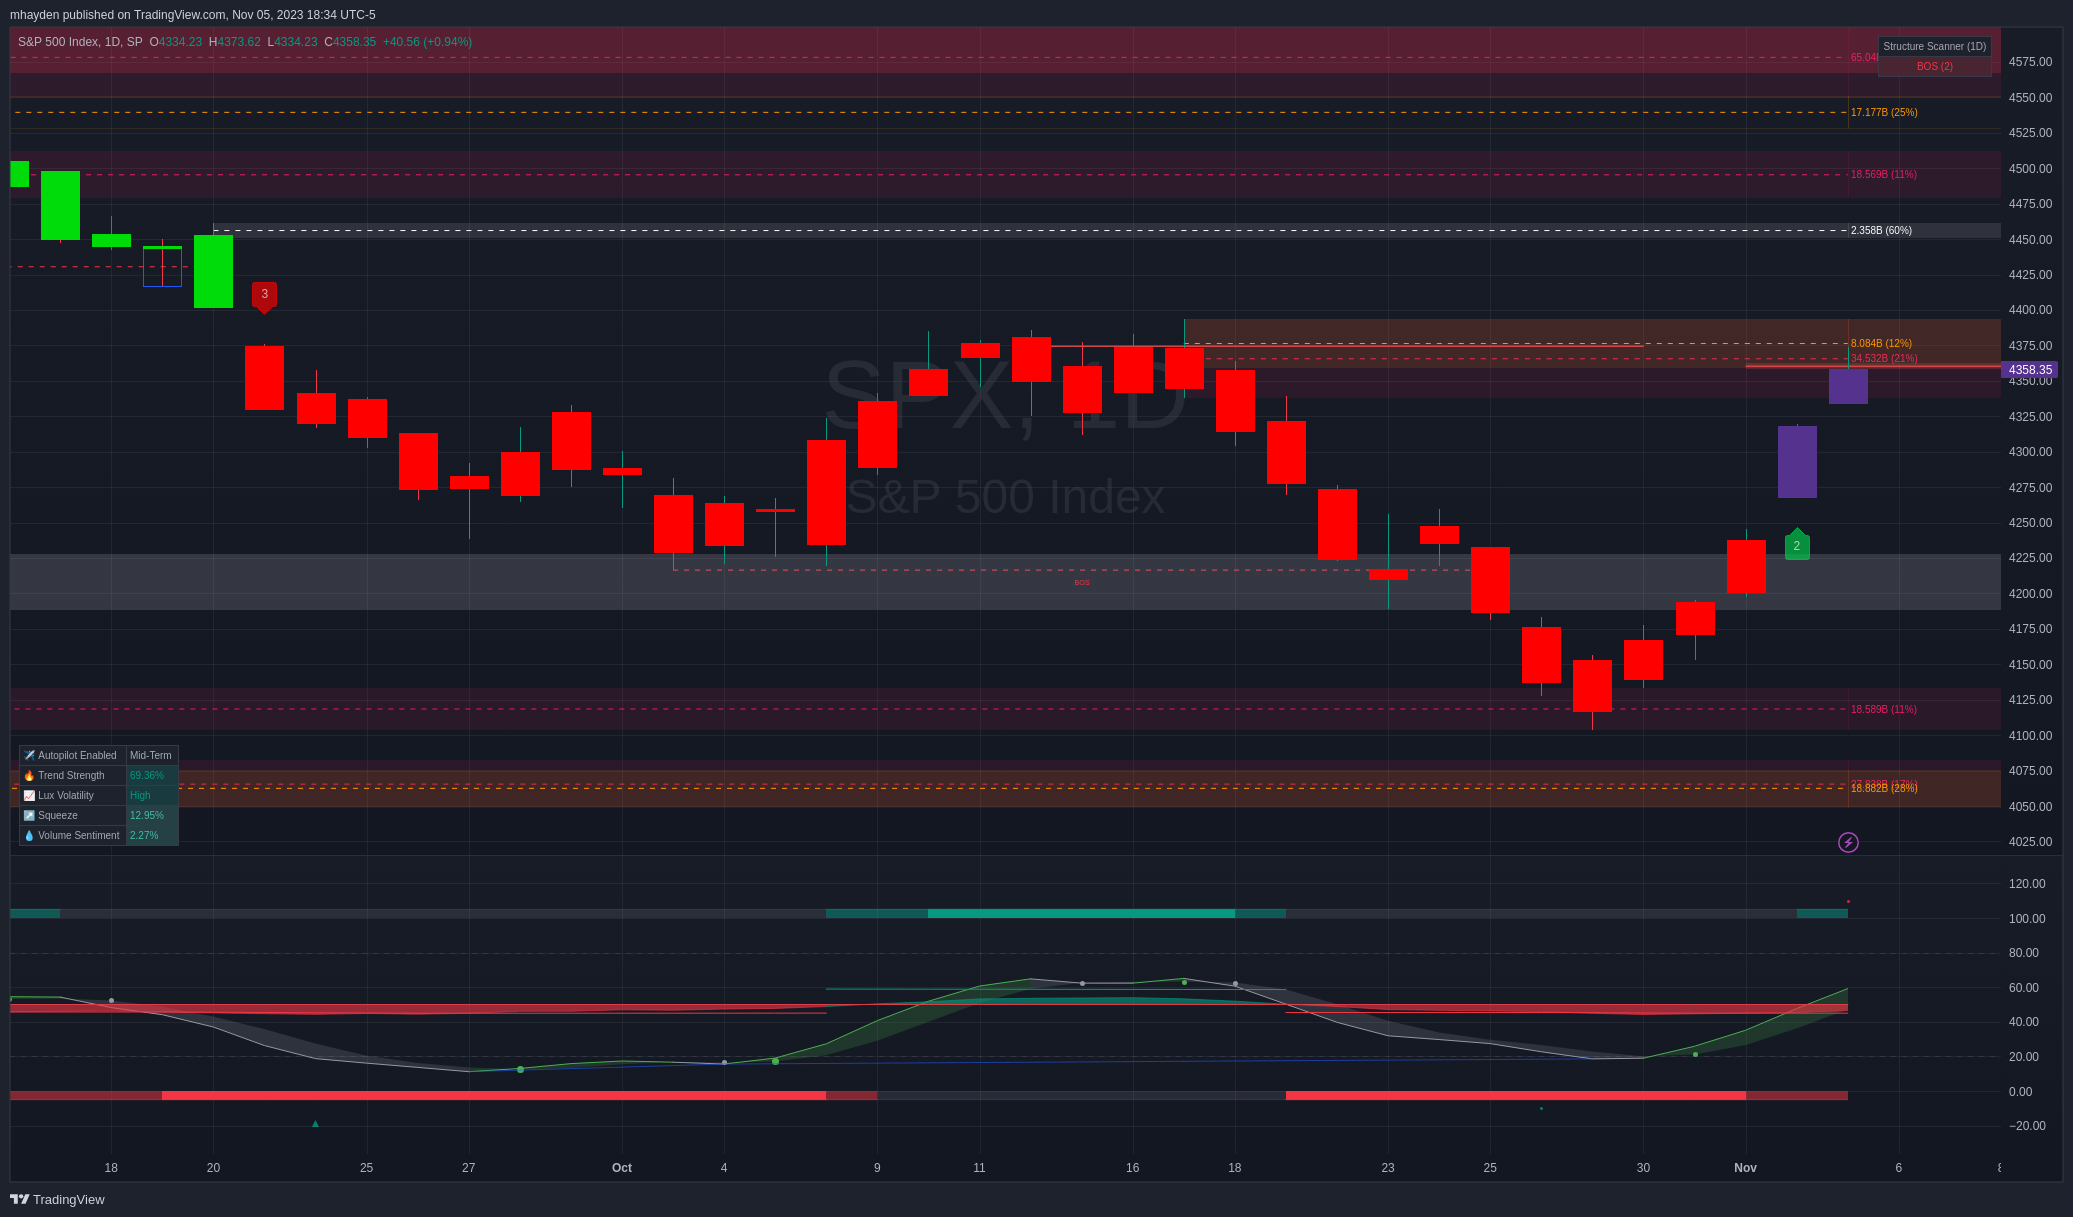
SPX chart
SPX closed on Friday with a fair value gap just above 4358. All of that is happening inside an order block that shows up on the 4h/1D time frames. Some of this could be related to wild 0 DTE bets on Friday so it remains to be seen what will happen Monday.
LuxAlgo put a 2+ indicator on the candle from Wednesday which is on a scale of 1-4 (4 is the strongest). The oscillator shows a slightly negative leaning money flow that is getting more bullish and an oscillator wave that hints the shift in sentiment started on Tuesday. LuxAlgo's Signals and Overlays says the trend strength is about 69% (on a -100 to +100 scale).
If SPX does clear a path to 4400 through that order block, the next stop on the chart is 4450 where a one hour order block remains. That matches up with the negative vanna level there.
If we head down (which isn't unreasonable with a bunch of gaps made last week, we find an order block at 4125 and another at 4075. Both of these are order blocks from May 2023.
Thesis
I can't find much to say the rally is over, but there's a lot of evidence that the rally will fast some tests going forward. SPX left behind multiple gaps last week and it struggled to break through the order block from 4340 to 4400.
Many of the vanna charts for the biggest constituents of SPX are also leaning extremely positive, especially on the right side above price. AAPL, MSFT, NVDA, and AMZN all have vanna above price that looks a lot like SPX's chart. This can change quickly and I plan to keep an eye on it.
I have one half of a SPY strangle for 12/15 at $439 that I'm getting a bit nervous about and might have to do some work to defend. I have various other short strangles that might need some adjustments if SPX wanders up to 4400. It's another good reminder that the market can move up just as swiftly as it can move down.
Good luck to everyone this week! ☘️
Discussion