Charts I'm watching for January 20, 2025
Let's analyze six charts for this week that might be setting up for some bullish moves. 📈

Welcome back for another look at some interesting charts going into the week of January 20th, 2025. Markets are closed for Martin Luther King's Birthday on Monday.
In this post, I'll cover six charts that look really interesting. As a disclaimer, I currently have bullish short put positions in VRT and it is featured below. I do not hold positions in any other stocks featured in this post.
But first:
All investments come with significant risks, including the loss of all capital. Please do your own research before investing, and never risk more than you are willing to lose. I hold no certifications or registrations with any financial entity.
Time for charts! 📈
AXON
AXON's claim to fame revolves mainly around its Taser devices and body cameras. The chart went through some rough spots in early 2024 but kept moving higher over a rising 30 week moving average (red line on the chart below). A high volume close appeared in August and again in November. Both had decent gaps up:
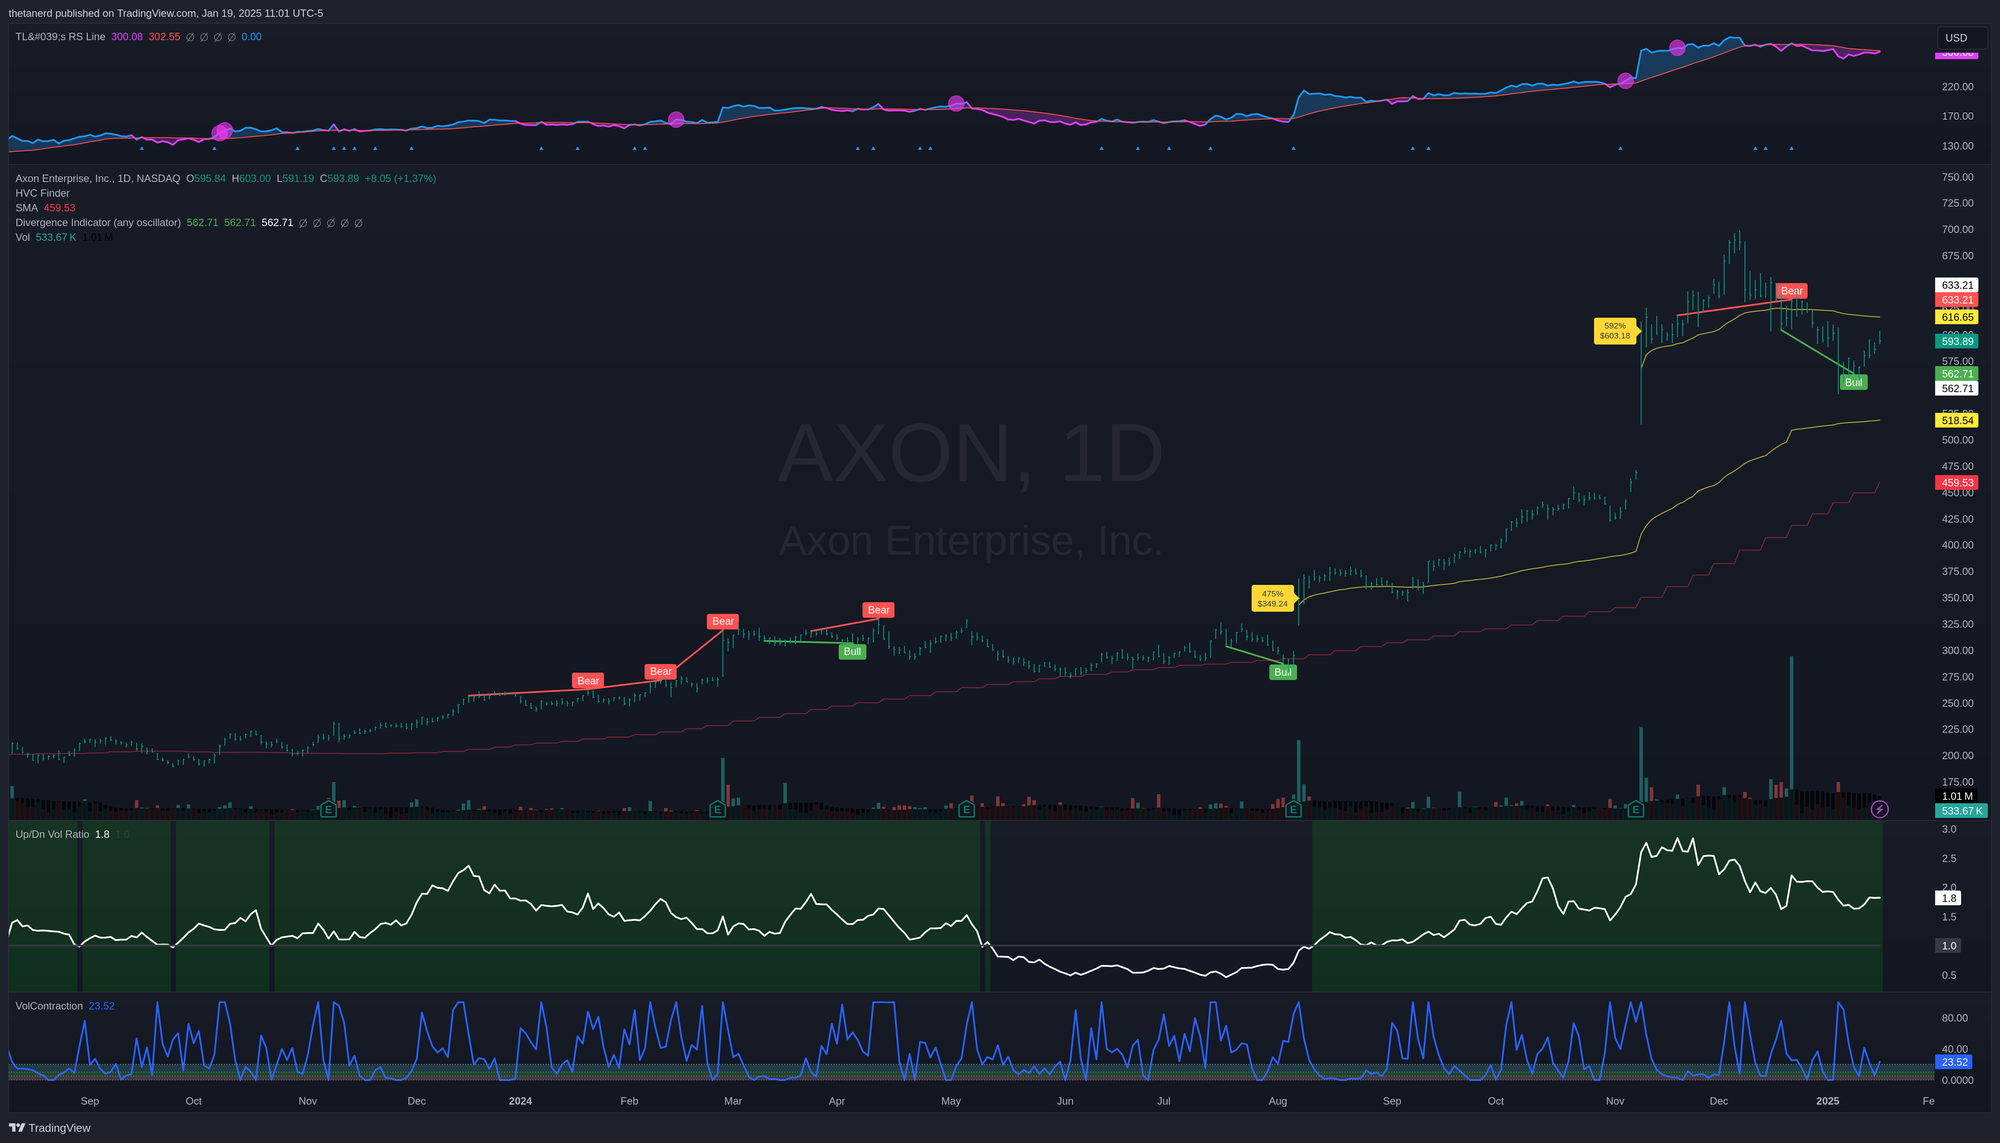
AXON hit a climax high in December and fell back, but the up/down volume ratio hasn't dipped into bearish territory since August (the indicator just below the price chart). The up/down volume ratio sits at a very strong 1.8 today and price formed a bullish divergence with it recently.
If the stock can retake the VWAP from the November HVC, this could be a good opportunity to ride a move higher. That level sits around $616.65 today.
BIRK
The shoe has been on the other foot lately for BIRK as it retakes some previous levels in a much more sustainable way than the wild island reversal from earlier in 2024. The HVC from December's earnings event was a big one and price recently climbed over the VWAP from that gap up.
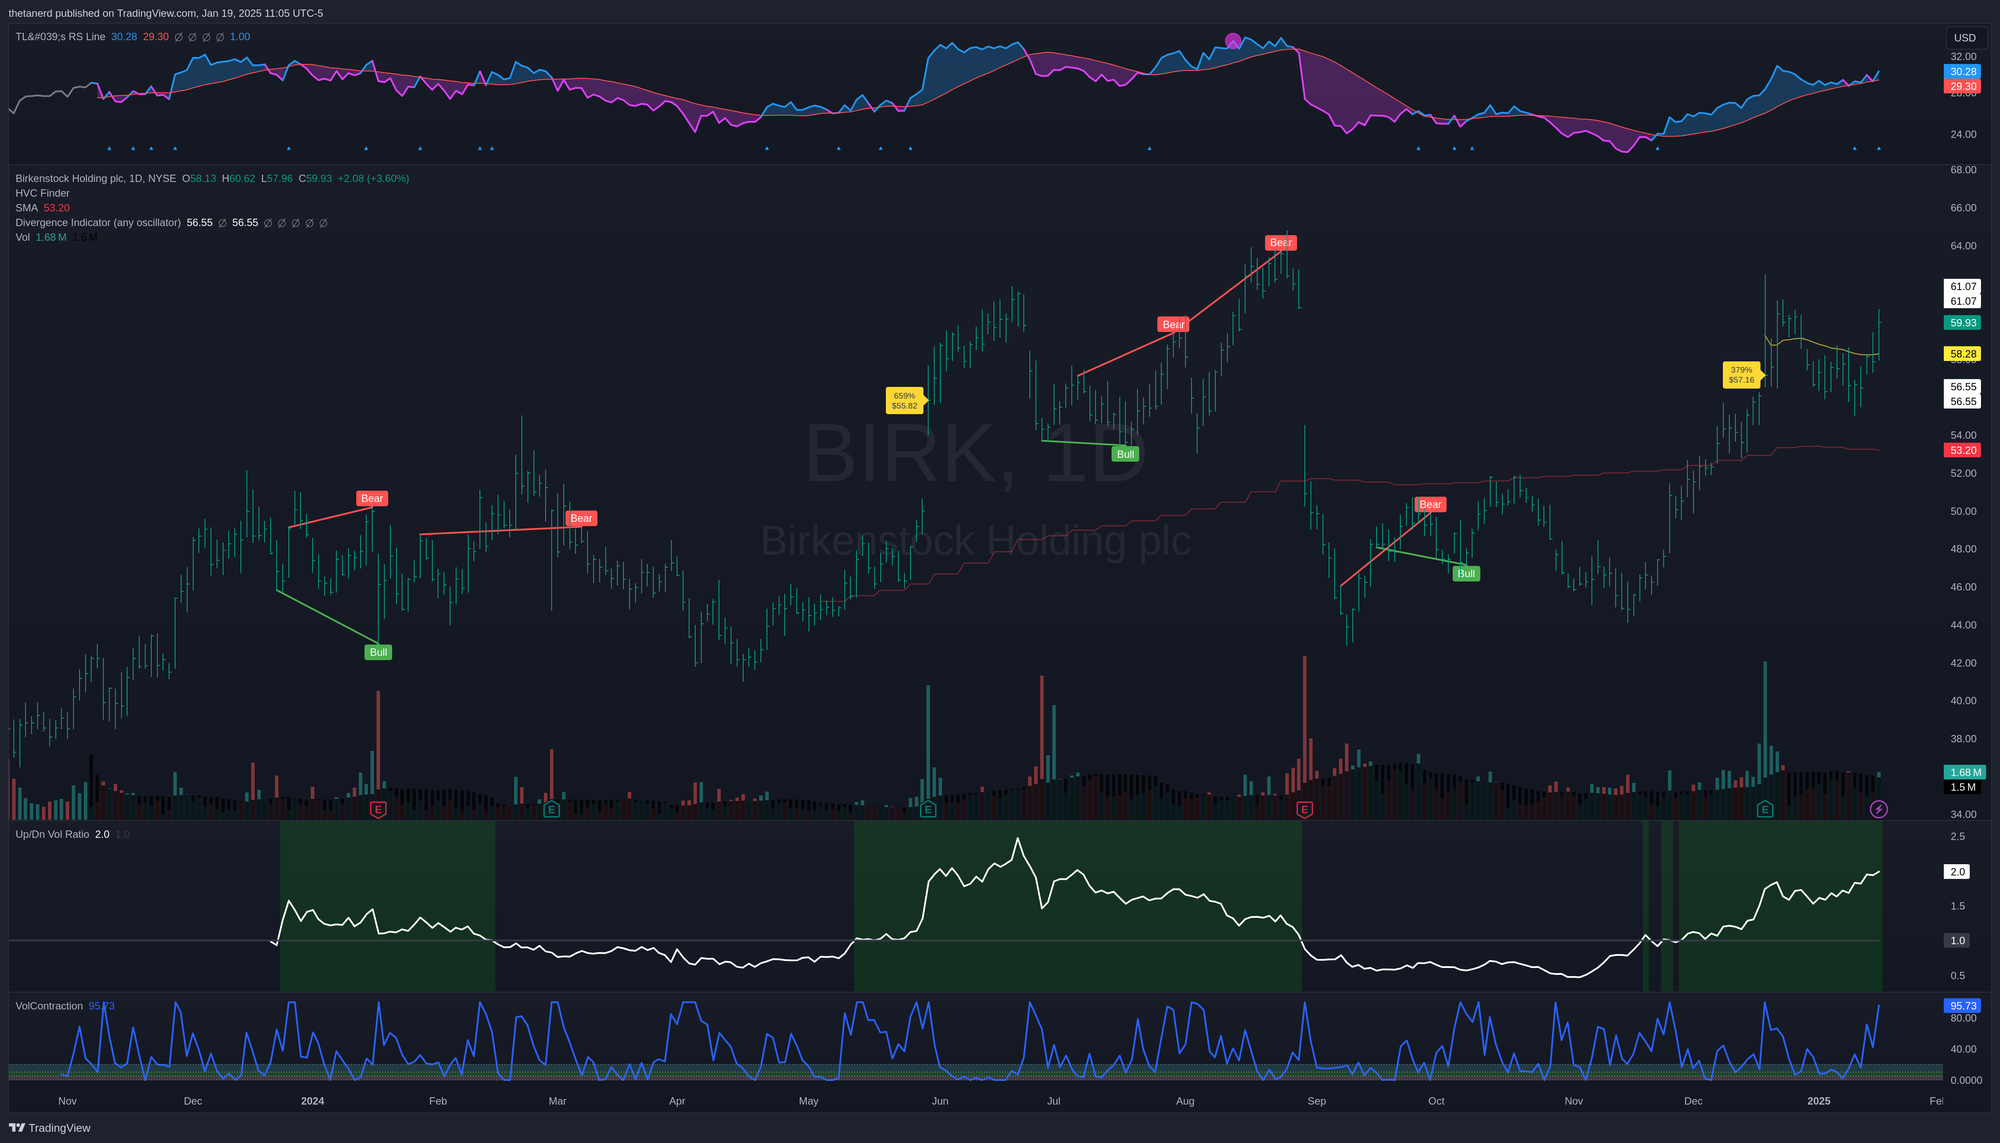
Notice how the price movement since the HVC was pretty compressed at the beginning of January. The volatility contraction indicator (at the very bottom) was under 20 and that shows that the price movement was very tight. In that moment, the up/down volume ratio was still on its steady climb that started long before that in November 2024. This shows that the volume on up days far exceeded the volume on down days and could be a sign of accumulation from big firms.
Could we see another return of the gaps up and down from the summer? Sure, it's possible. However, note how the price movements this time around were much more gradual. The up/down volume line also shows that volume is steadily moving in a bullish direction rather than spiking wildly upwards.
I'd like to see this one hold above $61 with decent volume before making a trade.
LRN
LRN has made great strides upwards since climbing over the 30W moving average in 2023. The chart has multiple HVCs with gaps up and this suggests firms are accumulating shares. The dive in October before earnings was incredibly spooky, but the gap up from earnings resumed the prior trend as if the drop had never happened.
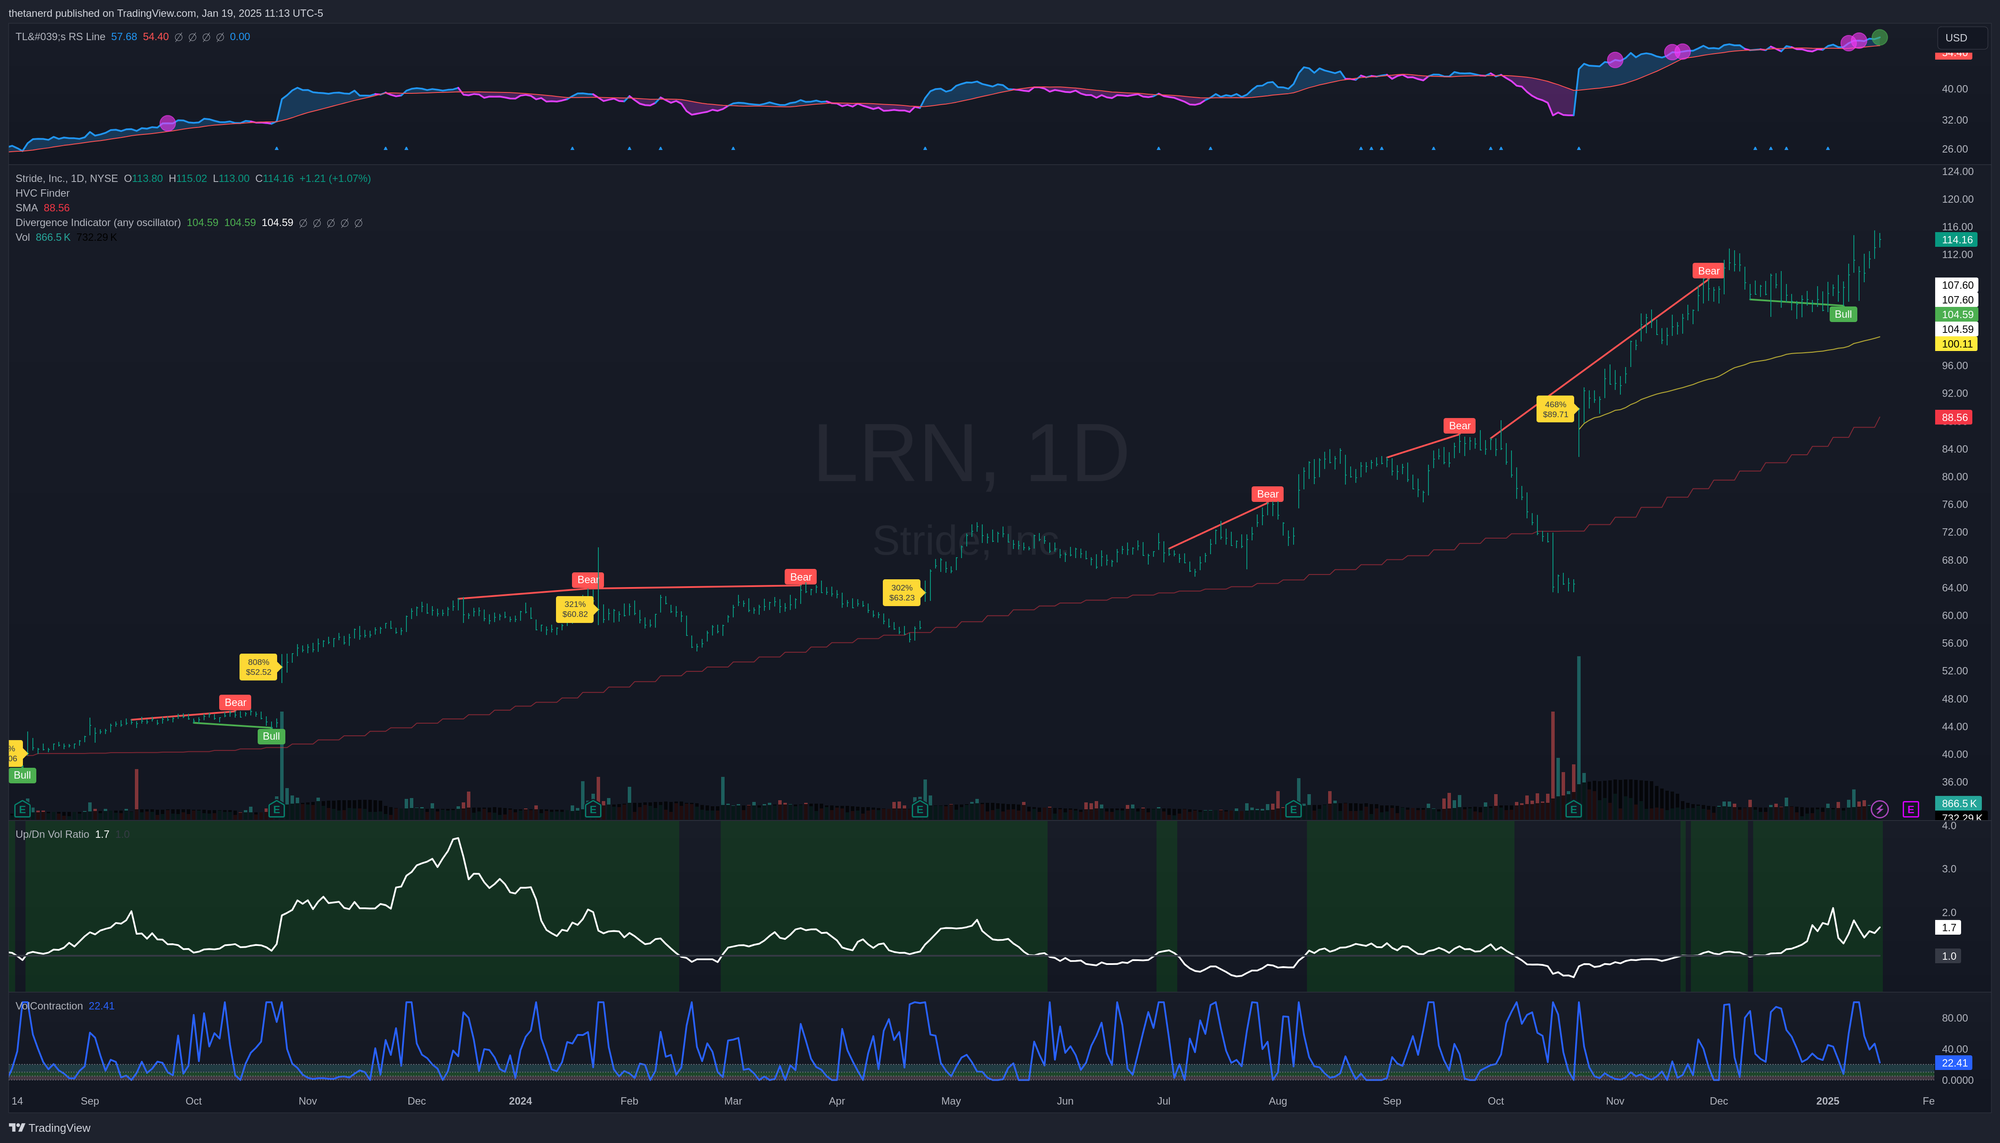
Fast forward to today and price action moved sideways in December as the up/down volume indicator rose steadily (marked by the "Bull" green line on the chart). This divergence was a hint that although the price was largely going sideways, traders were buying a lot more shares than they were selling.
LRN looks ready to go right now as it rose out of its base, but earnings are approaching quickly. LRN's earnings track record looks excellent so far. However, that's no guarantee that the next one will be the same. Volatility has almost contracted under 20%, so it could be a good time to make a trade if you're bullish on LRN's earnings.
VRT
One of my favorite stocks to trade in 2024 was VRT. My only complaint is that I wish I had found it sooner! 😅
VRT made a big base from mid-May to September 2024 and broke out of it. However, it hit a climax high in November and sank back down. Note that the price made new highs while the up/down volume indicator did not. That was a hint that the buying wasn't strong enough at the peak around $140.
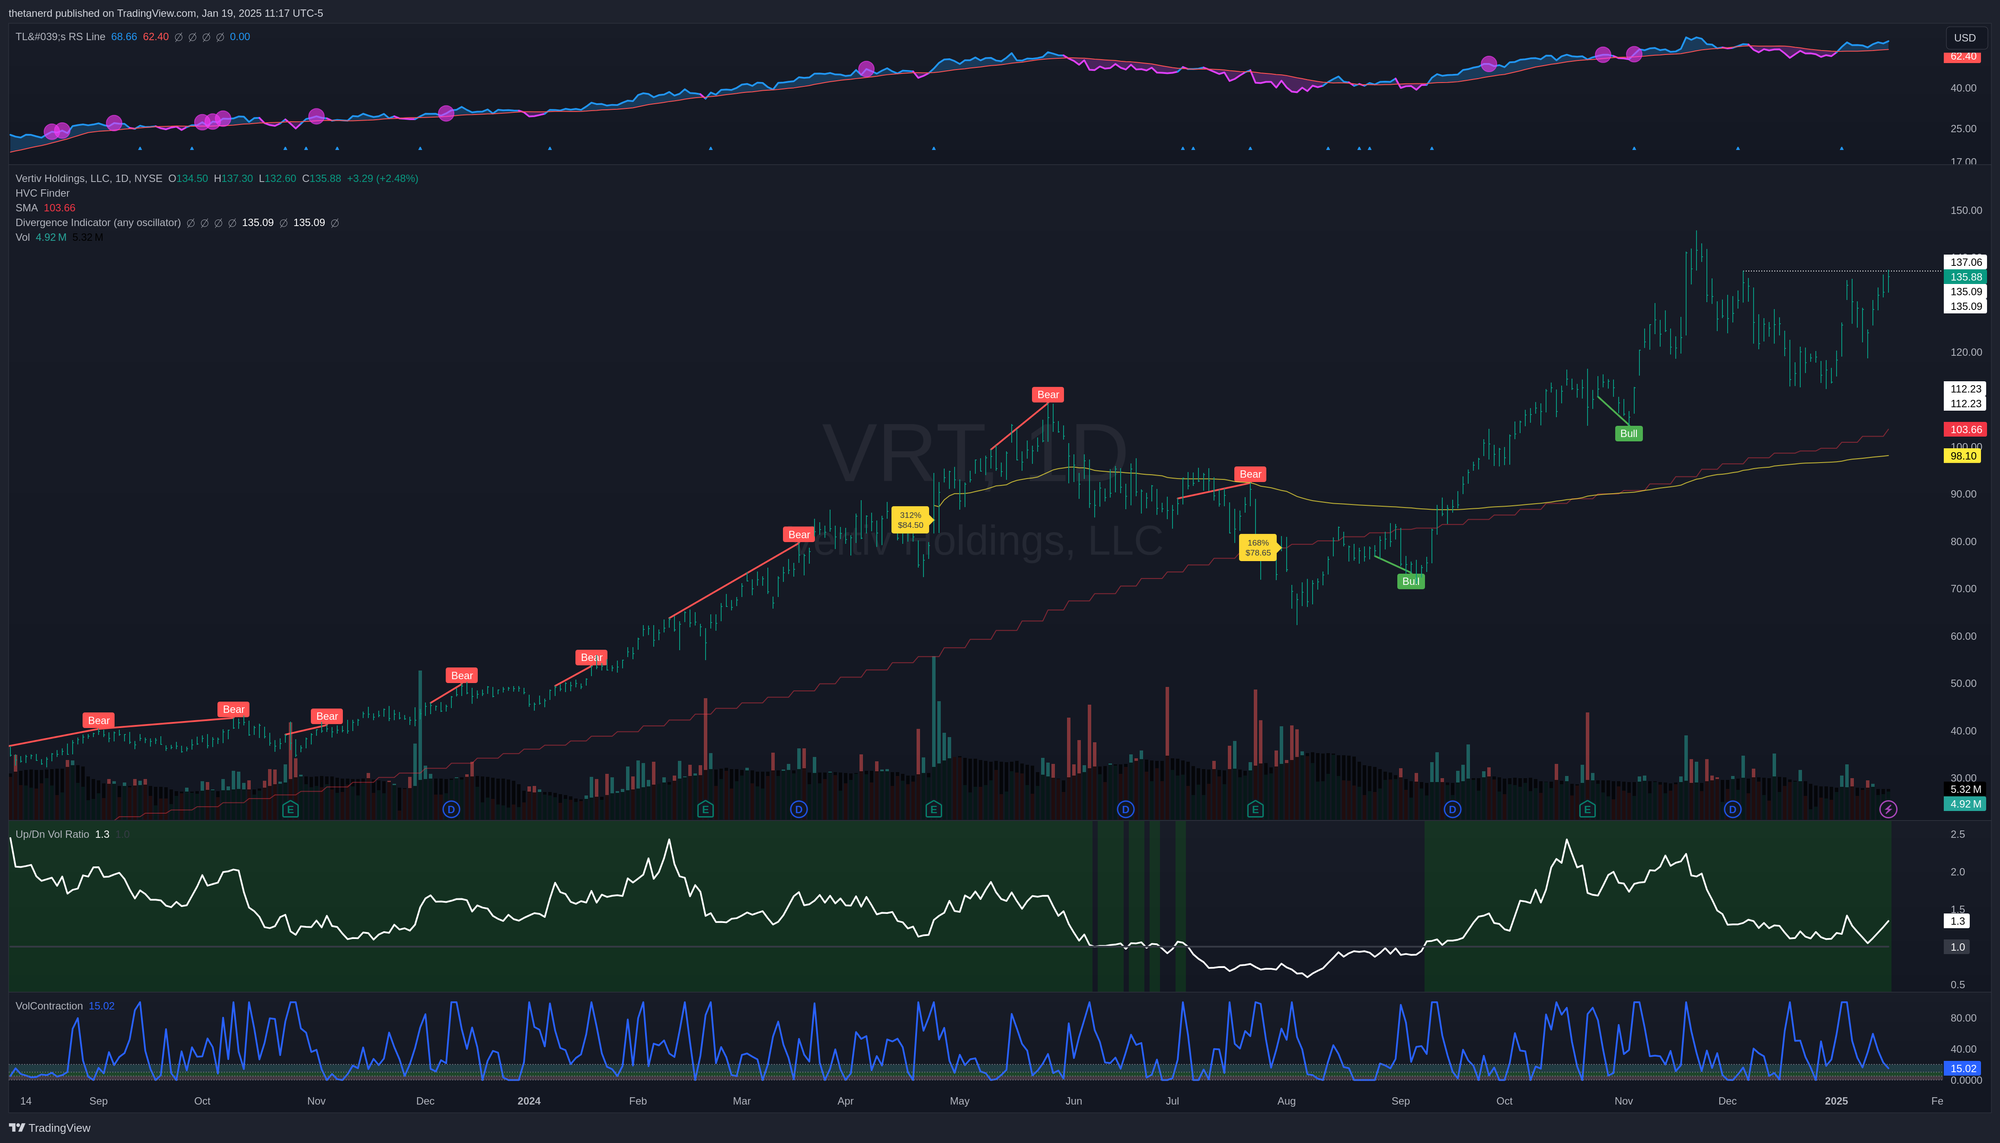
VRT just finished making a cup and handle in December and January and it's poised to break out once again. The up/down volume sits at 1.3 and rising. Volatility has contracted inside of 20%. This suggests that VRT is ready to go somewhere soon, but it's difficult to tell which direction that might be.
If VRT can break above $137.06 with decent volume, that would be another fun breakout to play. That's where I've set my alert.
HOOD
If you've done anything with investments in the last few years, you're likely aware of HOOD. It's had plenty of bullish volume supporting its price moves since late 2023 and it has bounced around above a gap-up HVC from November. This past week was a barn burner for HOOD as it rose from under $40 to over $49.
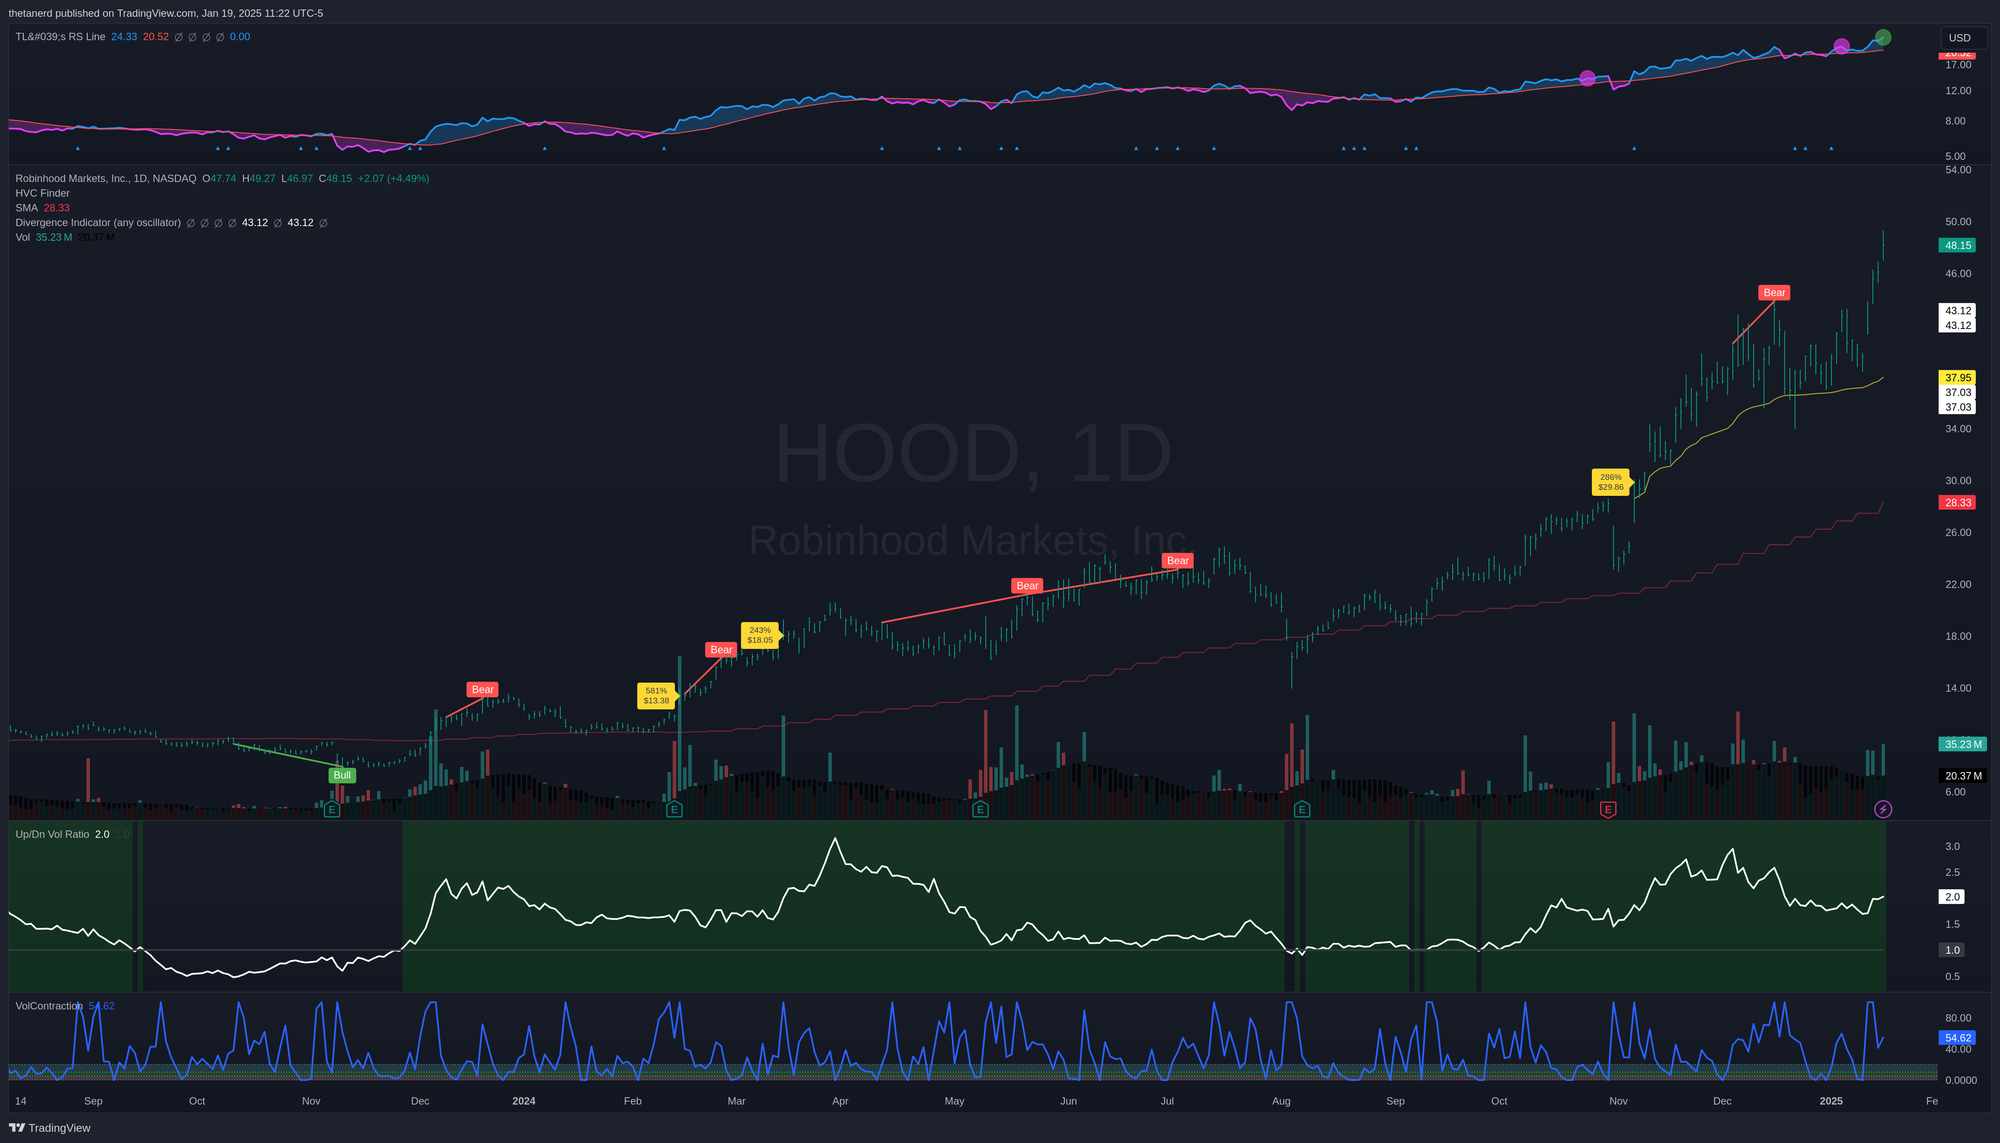
The 30W MA is still rising, volume is bullish, and there are very few distribution days since mid-December. Volatility has expanded quite a bit, so I might wait for HOOD to begin making another base before getting in. However, we might be looking at a lockout rally if it continues moving like it is right now.
Watch out for a climax high, though. Check AMD's mid 2024 chart and MSTR's recent chart for good examples of both. If you see price surging but volume doesn't seem to be supporting it: be careful. These often snap back down viciously but they lead to excellent buy points.
BROS
Rounding out my list of six great charts is BROS. I'm not big on super sweet coffee, but something special is brewing at Dutch Bros and there was a massive HVC with a gap up in November. Volume surged 638% above the 20 day average and price has barely touched the VWAP from that day.
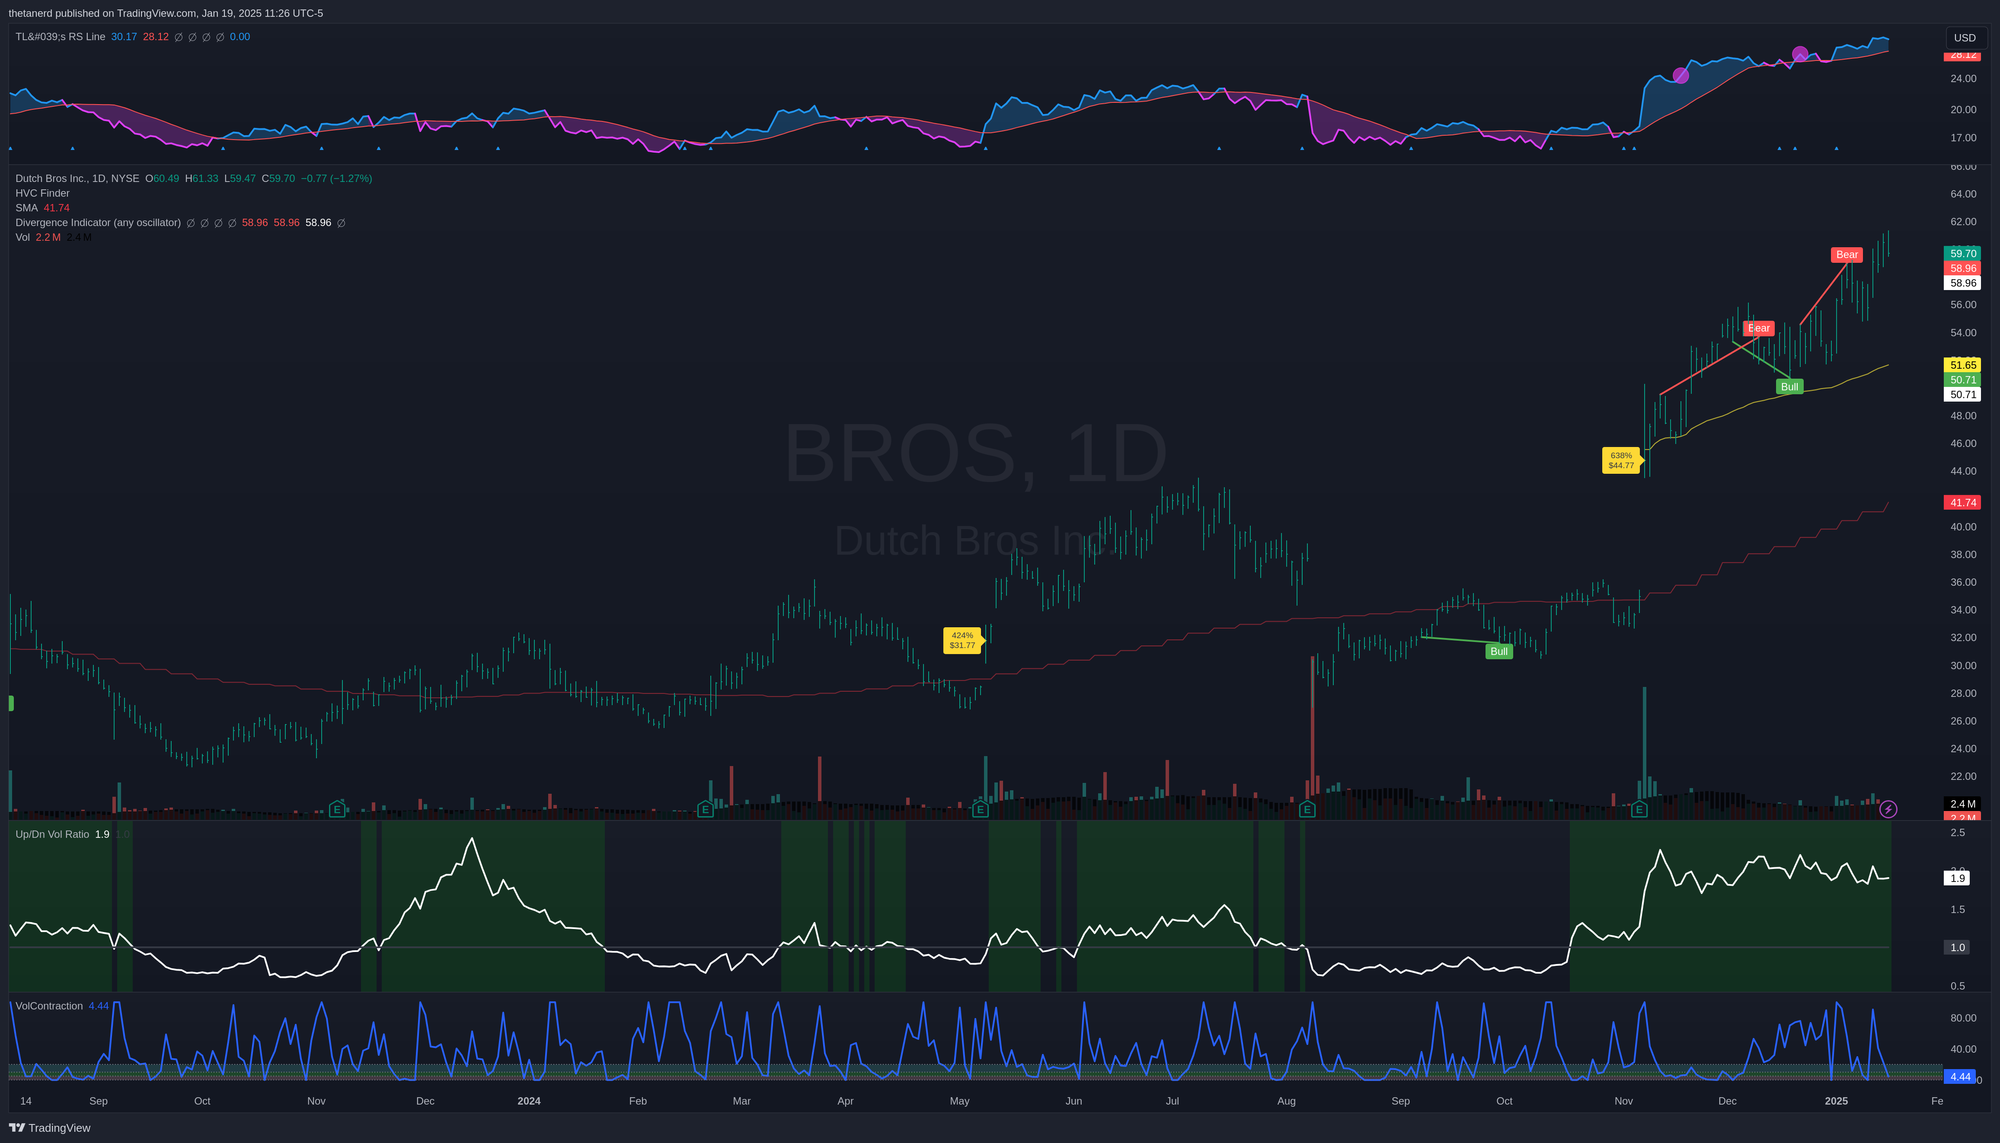
The up/down volume has held around 2.0 since November and volatility has contracted under 5%. I can't find any significant distribution days since the last earnings call, but the one thing that worries me here is that the price action seems to be rocketing upwards at an unsustainable pace. This doesn't necessarily mean there's an underlying problem here but I plan to wait for some kind of base or retrace before making a trade.
Wrapping Up
The broader market might be swinging around a bunch and making everyone nervous, but I'm reminded of the phrase: "It's always a good time to own good stocks." As always, if you're interested in a deep look at where the broader market is going right now, I highly recommend Chris Ciovacco's weekly videos:
Good luck to everyone this week. 🍀


Discussion