Charts to watch for February 9th

Take a dive into my watchlist for this week. The market seems to be chopping around but there are plenty of stock building great patterns.

It's Super Bowl Sunday today in the US, but I managed to take a break and review some charts. This week has some old favorites and some new contenders.
All investments come with significant risks, including the loss of all capital. Please do your own research before investing, and never risk more than you are willing to lose. I hold no certifications or registrations with any financial entity.
Let's get into the charts!
AXON
This stock journeyed from the $200s in early to 2024 to highs just under $700 recently. It ran into a wall just below $699 after making one relative strength high after another relative to SPX. This suggests that market participants accumulated more stock but then took some profits after the most recent earnings call.
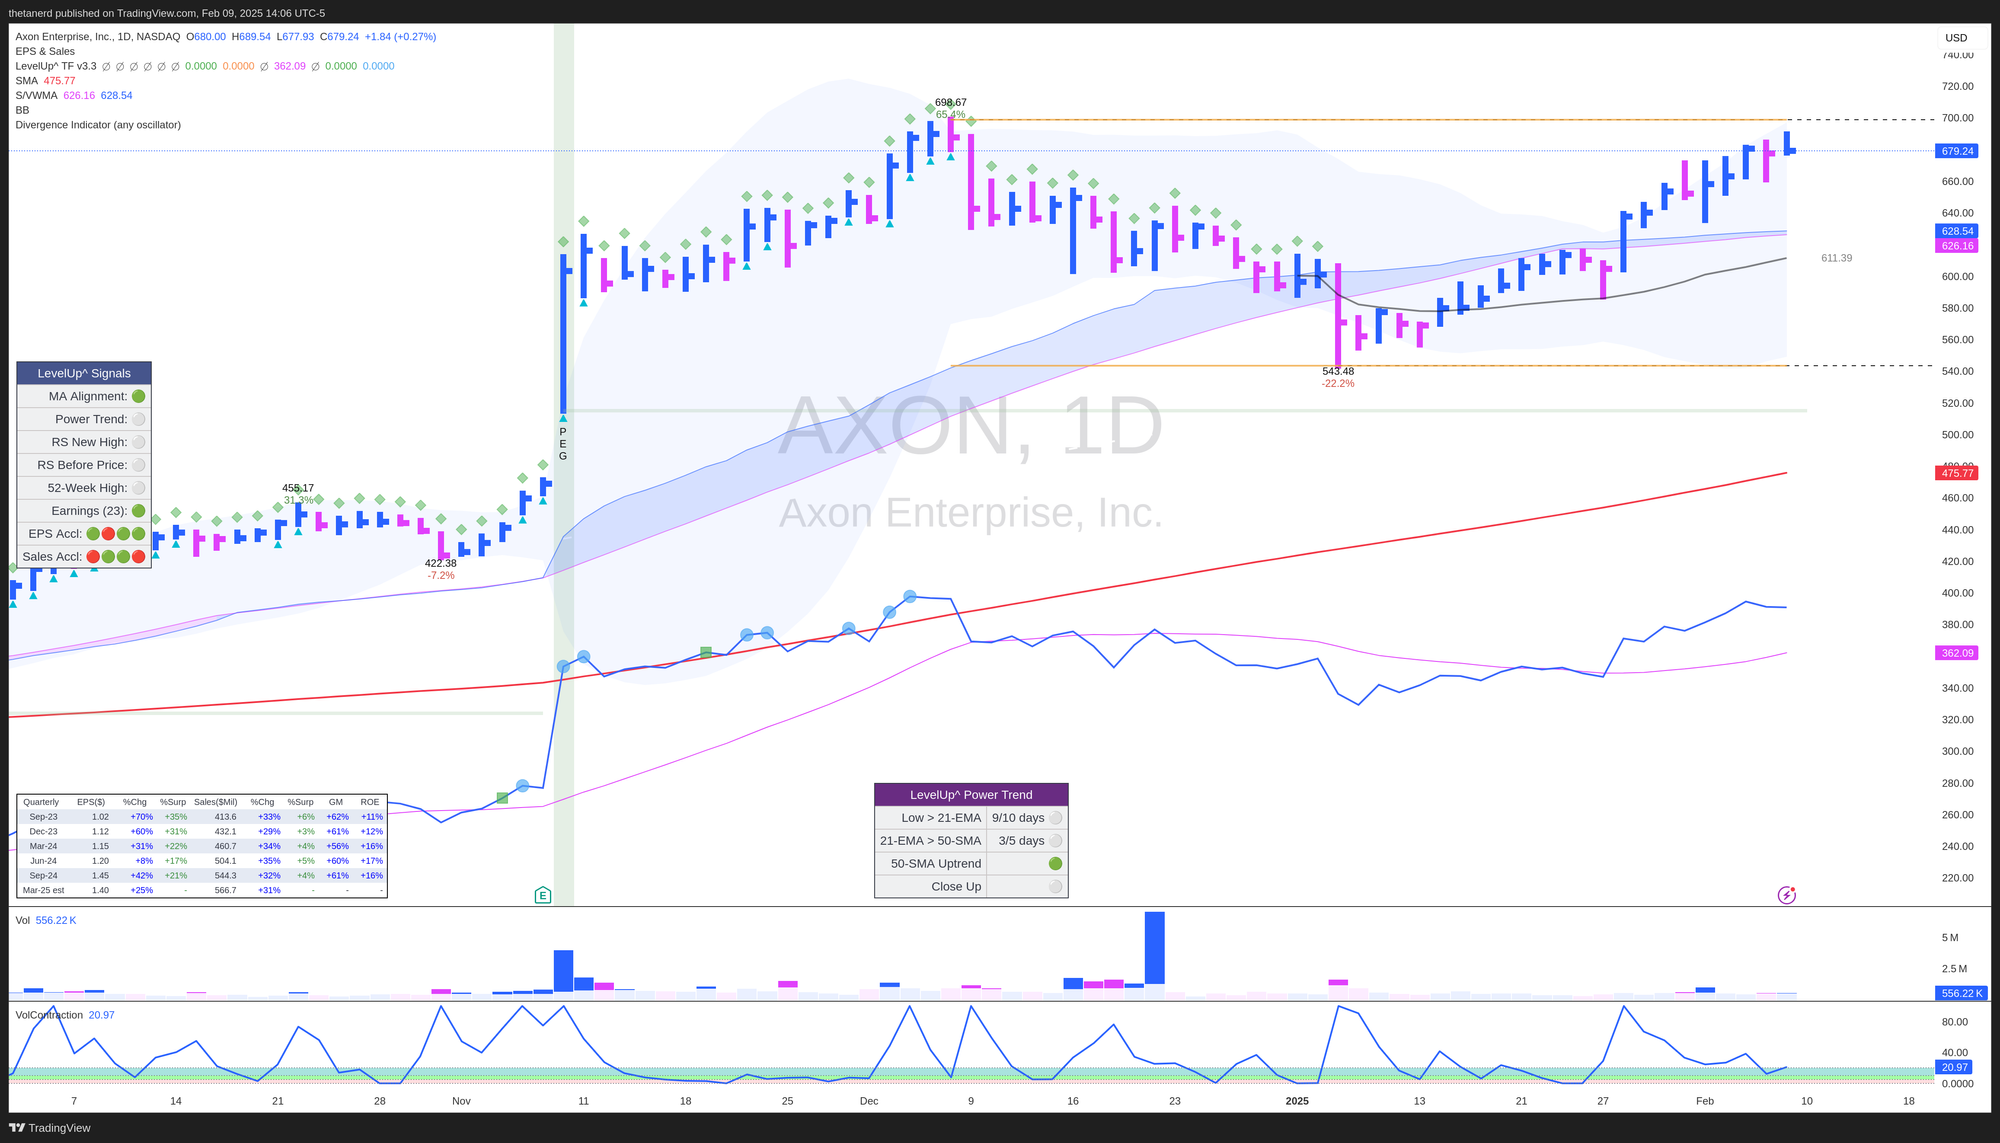
After the bump down from $699, AXON found a base around $543. Since then, it recaptured the year to date VWAP line, crossed above the 50MA, and the relative strength line is once again above its moving average. The bottom of the earnings gap around $515 hasn't been touched once. Earnings are coming up in 23 days, but an entry now could be well timed since the relative measured volatility (RMV) is right around 20.
If it breaks out above $699, it could go on another run into earnings.
APP
Talk about a sustained rally here. APP charged into 2024 and 2025 with an incredible rally. Based on the IBD power trend rules, it gained 316% since the power trend started. 🤯
APP took a similar path to AXON after earnings and it ran into a wall around $418. Much like AXON, it never came down to retest the bottom of the earnings gap, but it did run back to the $307-$308 levels for some gentle bounces. However, the second bounce in January 2025 came with a higher relative strength to SPX.
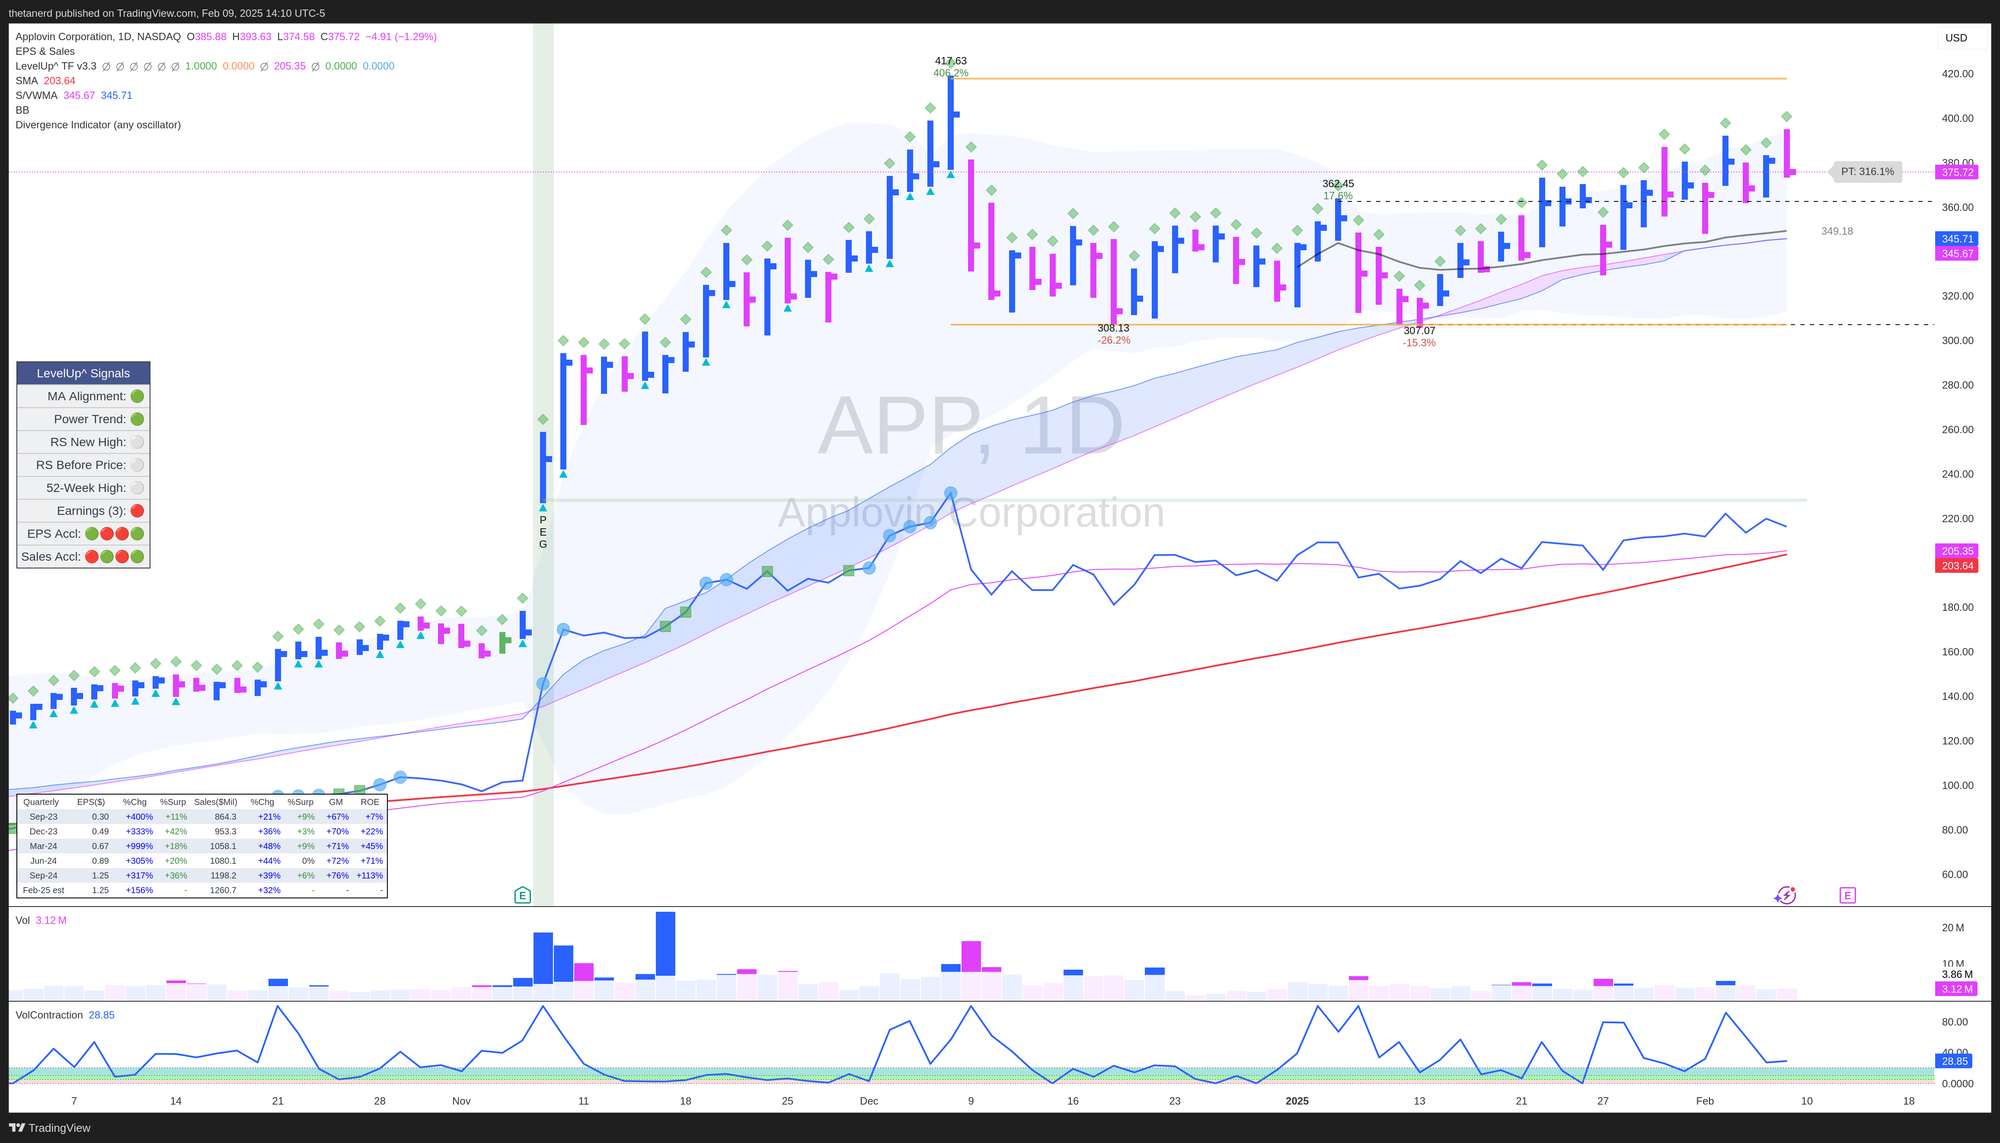
Many argue that APP has run much too far. That argument might have merit, but notice that the relative strength line (below the HLC bars of the price chart) has quietly increased since the drop back from $418. APP continues to quietly outperform SPX (and many of its peers) over bullish moving averages. The 50 day VWAP is leading the 50 day SMA and that suggests that volume is leading the recent moves.
TWLO
After a great earnings gap in late October, TWLO forged a slow grind higher with one new relative strength high after another until mid-December. TWLO began a rough-looking volatility contraction pattern (VCP) in January, followed by another burst higher on strong volume in late January.
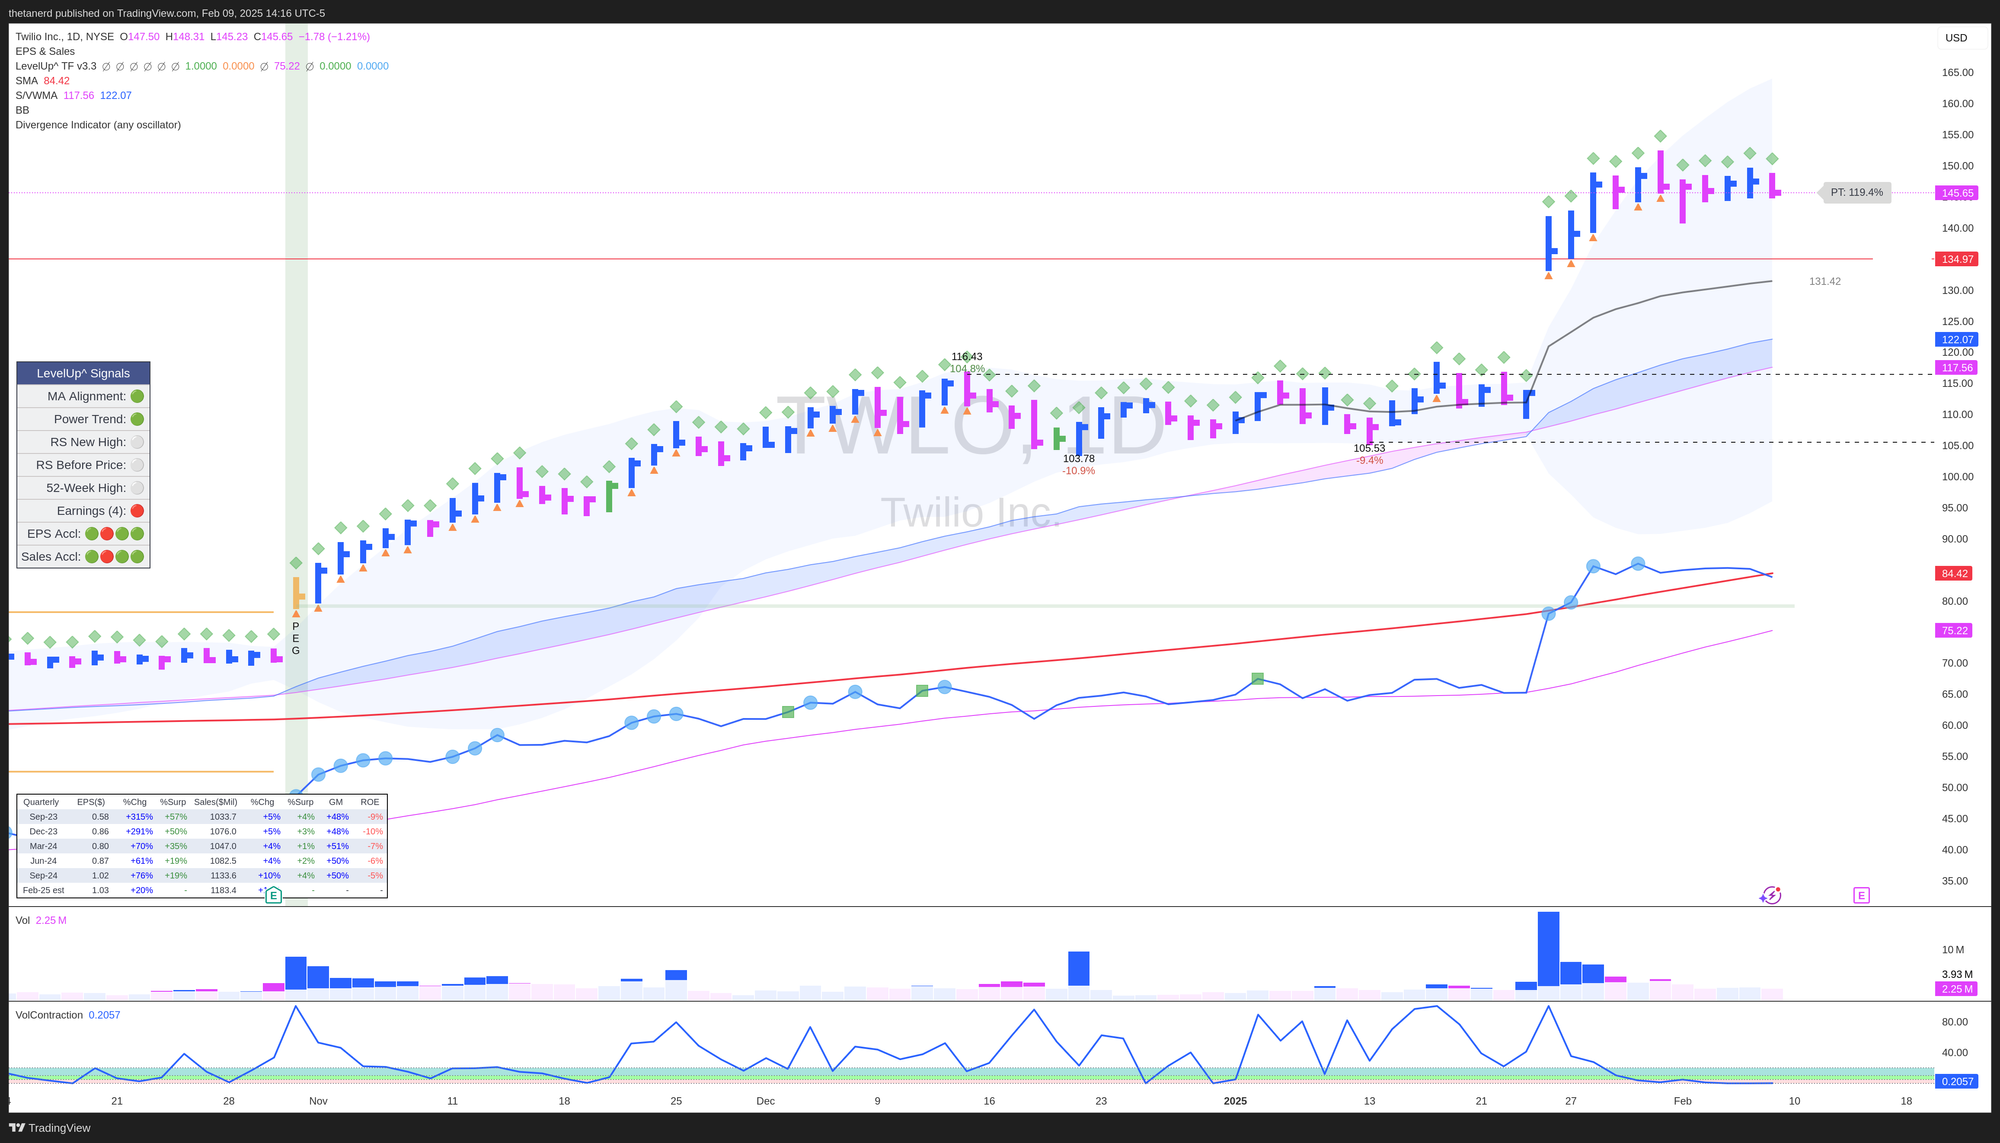
With earnings around the corner, what is TWLO doing now? Volatility contracted fiercely and RMV shows we're almost down to zero (suggests a good time for an entry). Volume is leading price, price is well above the YTD VWAP, and we have recent relative strength highs. The chart's technicals may point to more bullish moves, but earnings are dangerous.
FTNT
I was trading quite a bit of FTNT using short puts as it ran in a range between $90-$100 for a long time since the last earnings call. The first two trips down to the lower $90's after earnings were done on the same level of relative strength. That was a bit spooky.
The most recent run to $90 in mid-January was a little different. Price undercut the last low in December, but the relative strength moved higher. That shows that although the stock looked a little weaker in isolation (nobody likes to see a lower low), it was looking stronger when compared with the same moves in SPX.
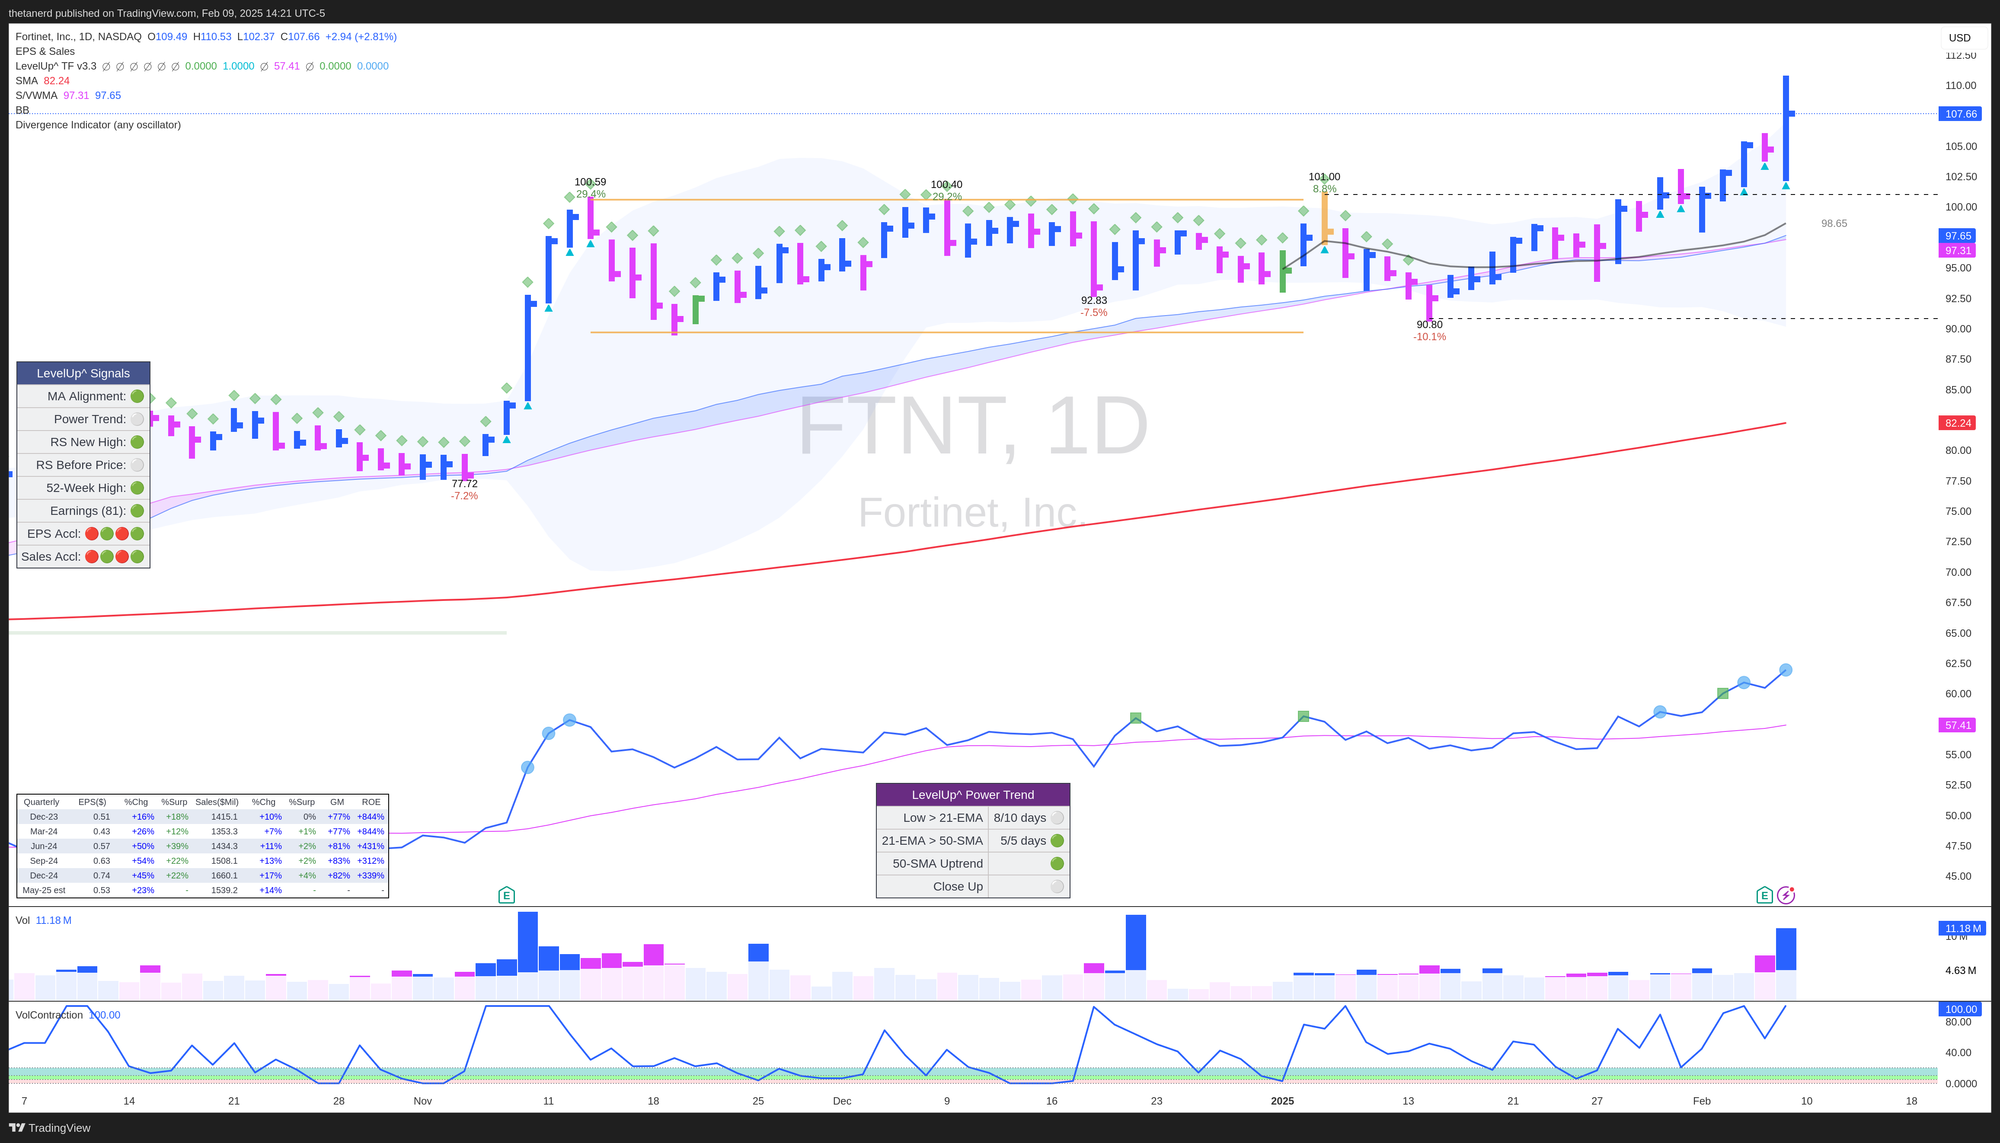
Earnings looked good last week and FTNT may be on the start of a new trend. Two of the criteria for starting an IBD power trend have already been met and two more days of the low over the EMA will likely start it. FTNT has made new RS highs, too.
Volatility remains elevated and FTNT is outside the Bollinger Band as of Friday's close. This tells me that the stock is really strong, but the right time for entry hasn't appeared yet.
Summary
The overall market seems to be in "sideways chop" mode for now, but there are plenty of individual stocks that are building great patterns. To recap:
- AXON: Breakout might show up soon, but I'm waiting for a breach of $700 with volume
- APP: Poised for another breakout and showing signs of strong accumulation (again!). A break over $418 would be huge. Volatility is a bit stretched for an entry right now.
- TWLO: I'm most excited about this one. The RS is weakening slightly, but it has done this quiet time pattern before. I'll likely wait to see if a retest of the 50MA is coming.
- FTNT: I kicked myself for not staying in this one! Relative strength looks great but volatility has expanded to the maximum. I'll wait for a better entry here.
Good luck to everyone this week in the market. 🍀
Discussion