Closing out the week of 6/30

Vanna is back! 🥐 TSLA has some solid data coming through with plenty of correlation, but AMD has some mixed signals. Let's dive into both. 🏊

AMD and TSLA are both up pre-market this morning but what's driving this move? Cem Karsan 🥐 is already calling out that vanna is back:

But you already knew that because you're reading my blog. 😜
Need help understanding vanna and other greeks? The creator of Volland has a new video out that explains them in more detail:
All investments come with significant risks, including the loss of all capital. Please do your own research before investing, and never risk more than you are willing to lose. I hold no certifications or registrations with any financial entity.
Let's get to it.
What is the VIX doing?
VIX futures (/VX) are still headed downwards on a daily chart:

The bar from the 6/21 spike is almost gone this morning. How are options flows on the VIX?
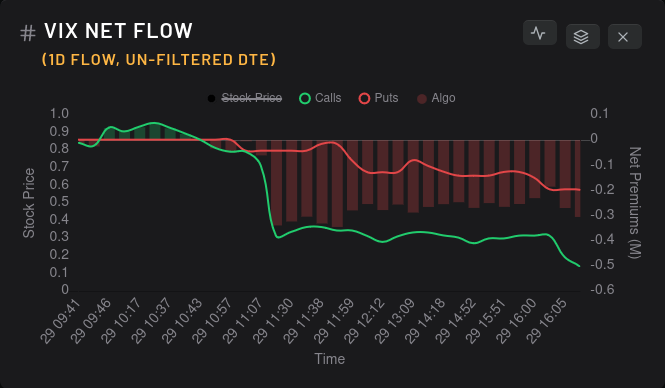
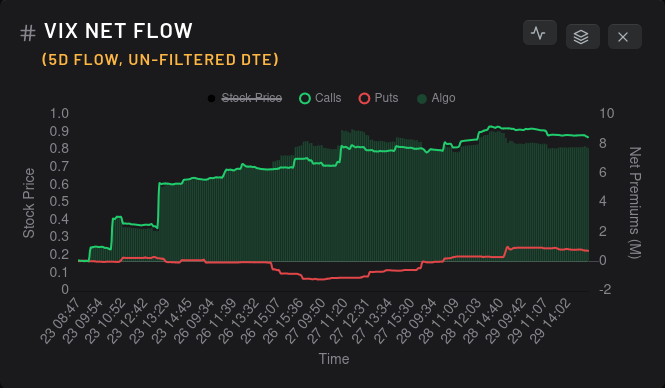
Calls and puts both dipped on the VIX yesterday, but they're going to need to come down more to show up on a longer-term chart.
Why do I care about the VIX? Big moves in the VIX greatly affect how dealers react to changes in implied volatility to maintain their hedges. We can examine that with vanna charts, so let's get into that.
TSLA
I sold a 7/7 $255 put on TSLA yesterday so I'm quite interested to see how it performs with the current vanna environment. First up, the vanna aggregate curve:

This is one of the best possible setups I look for in a vanna curve. We've got it all here:
- Positive vanna above price
- Negative vanna below pricy
- Twice as positive as negative at the extremes
- Positive vanna above price is spread over a reasonably wide range with a big flip around $300.
How about strikes in detail?

$300 is back! It's the tallest bar on the chart at about $1.2B. Sure, the $260 is a decent sized bar, but it's too close to the current price to have an effect. (Reminder: Vanna effects are zero when price is sitting on the same price level. That's gamma territory.)
All of this hinges on what IV does, though. TSLA's IV rank is just under 38% and it seems to have stalled recently:

Earnings are coming soon, so we might see TSLA IV stall a little, but don't expect a decent drop until after earnings on 7/19. Let's see what the chart is doing:

We hit some liquidity challenges just under $280 and we're coming off a 4-5 day breather. We caught the golden cross from the 50/200 moving averages on 6/22 and IV has come down since then. The last two days have relatively low volume as price came down, so I'm not sure I can get much confirmation off the recent moves.
RSI has come down to a more reasonable 63.6%.
AMD
AMD seems to be on a weaker foundation than TSLA lately, but let's see where it's going with the aggregate vanna curve:

This isn't as nice as TSLA's curve, but it has some good points. Positive gamma above the price is fairly well distributed at a distance up to $145-$150. However, there's a decent amount of positive vanna under the current price. That can help apply additional selling pressure that we don't want.

That $70 line still gives me some goosebumps, but it's a long term bet. Much like TSLA, our biggest bar here is fairly far out at $145 and it has a value of $116M. Other than the $70 line, AMD has a fairly bullish vanna chart as long as IV is not spiking:

AMD's IV rank is just under 59%, which means it's running a bit hot. Bears might argue that it's too hot while bulls might argue that it has tons of room to come down. that remains to be seen.
How about that chart?

AMD came down from the $130's and booped that 50 day moving average line ever so gently. Yesterday was green on relatively low volume and RSI calmed to about 47%.
Just as a reminder, the May 5 rally kicked off with IV hitting 43% and RSI falling to 45%. I'm not saying we get another rally like that, but we're moving into those same conditions.
Thesis
Both AMD and TSLA have bullish setups from vanna as long as IV doesn't creep up. I have very bullish deltas on both right now, but I'm being cautious around TSLA's earnings on 7/19. Dealer OI really tells a story about how customers are set up for both:
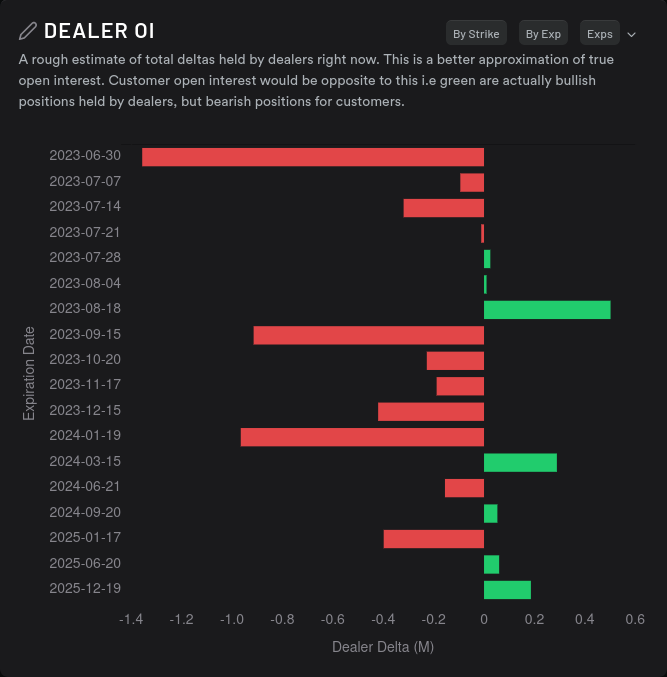
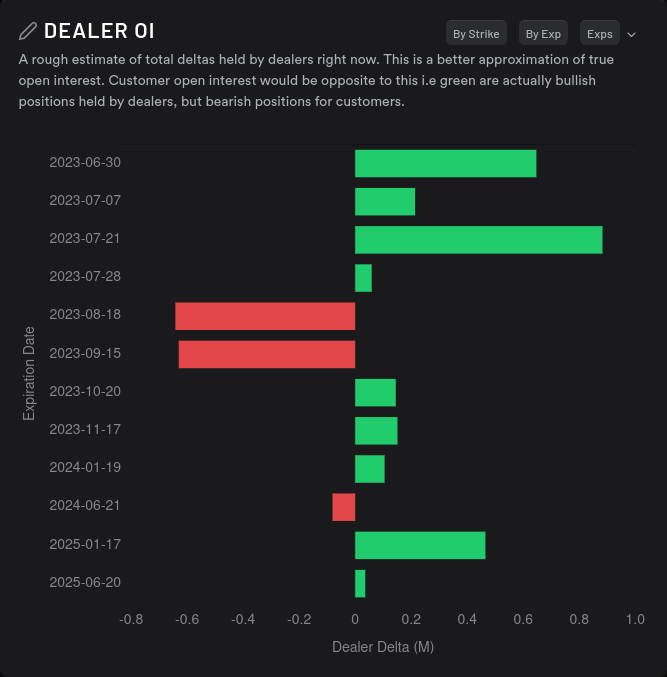
TSLA looks bullish through about 7/14 while AMD doesn't look bullish until 7/28 or 8/18. There may be more of a drop required for AMD before we start getting a good rally headed upwards again.
For now, I'm looking to sit and wait on my TSLA short put and shares but I might look for chances to sell covered calls on AMD on rallies. However, I plan to keep my AMD expirations at 7/21 at the very latest.
Good luck to everyone today. 🍀 If you found this information useful and you'd like these posts in your inbox, hit the Subscribe button at the top right. It's completely free. If you'd like to support my work, you can do that there, too.
All investments come with significant risks, including the loss of all capital. Please do your own research before investing, and never risk more than you are willing to lose. I hold no certifications or registrations with any financial entity.
Discussion