CPI looked good. Now what?

We received some good CPI numbers yesterday, but now it's up to the Fed to make its next move. 🤔

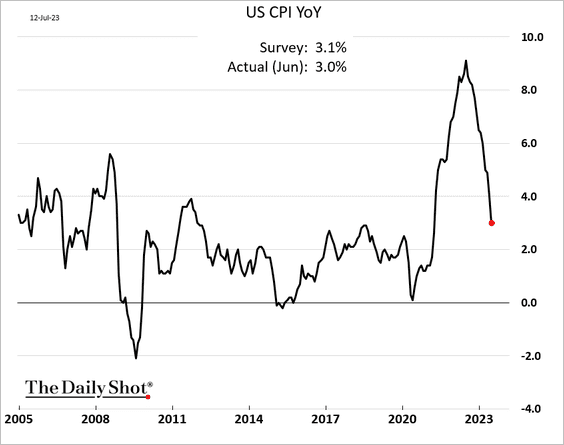
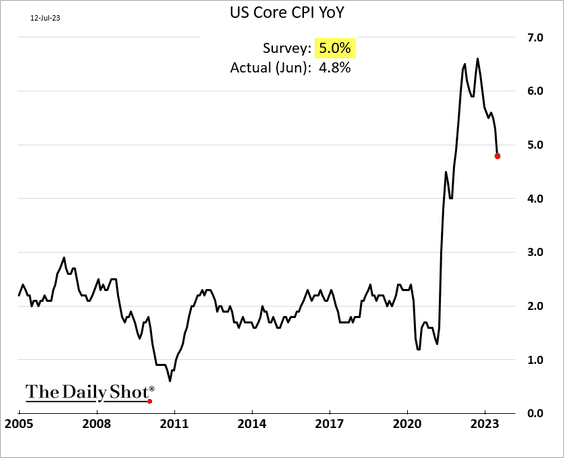
Yesterday's Consumer Price Index (CPI) data looked good, but what happens now? There's plenty of confusion about these numbers because some people talk about how overall inflation changed while others are quoting month-over-month or year-over-year statistics.
To keep things simple, the year-over-year measure of inflation shows a good slowdown, but we're not out of the woods yet:
The market responded and prices started going up, especially for the largest stocks in the S&P 500. SPX is sitting at an RSI of 67% right now and the equal weight SPXEW is at 69%. Are they running a bit hot? I'm not sure.
All investments come with significant risks, including the loss of all capital. Please do your own research before investing, and never risk more than you are willing to lose. I hold no certifications or registrations with any financial entity.
Let's dig into the data.
😠 Volland has authentication issues again this morning, so I won't have that data to play with. I'm getting a bit frustrated with the high cost of the service and the seemingly increasing amount of bugs.
Options Flow
For the overall market, the options flow on a one and five day time frame look incredible:
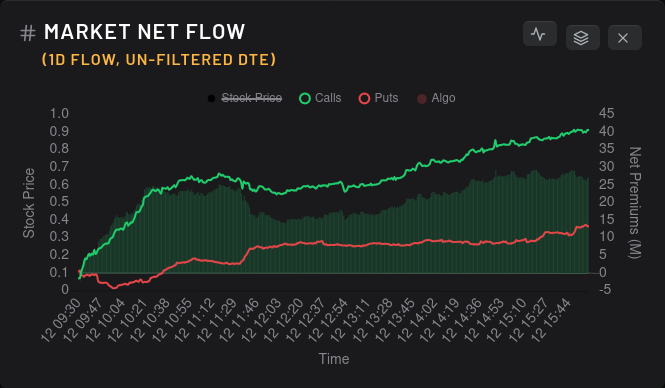
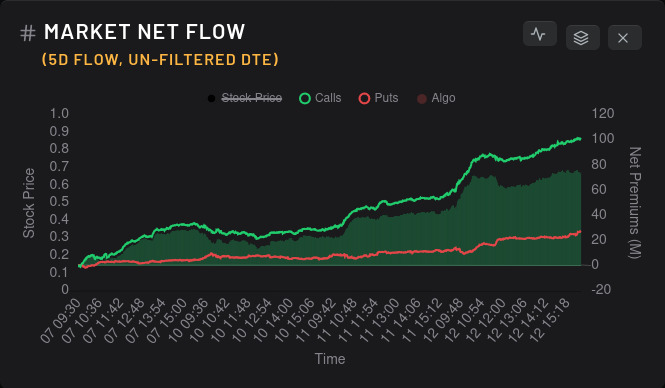
Any time I see a 20M gap in a single day's options flow, I get excited. Yesterday saw a gap between call and put premiums at 27M. 🤯
Some traders felt a bit wary about this pace of growth and there were spikes in VIX calls just before the close:
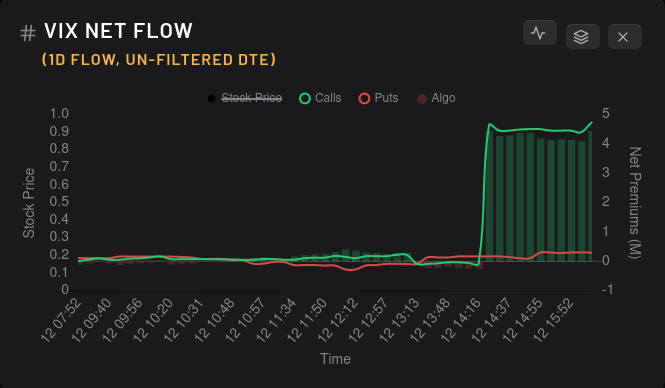
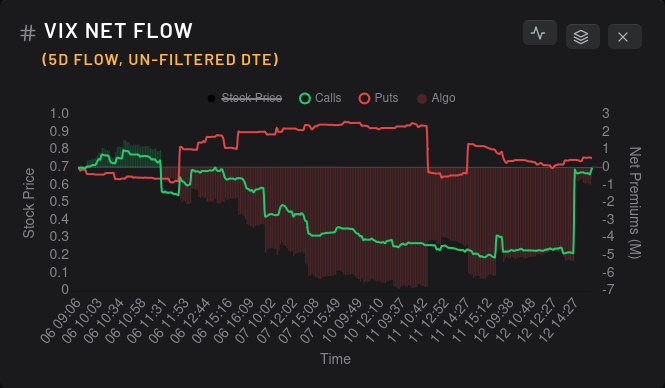
That increase in VIX call flow really just brought it back to the level where it was on July 6th. I'm still waiting on a meaningful drop in calls or increase in puts on the VIX before I'm completely sold on a bullish rally. My timeframe for trades is usually 2-5 days, so take that into consideration.
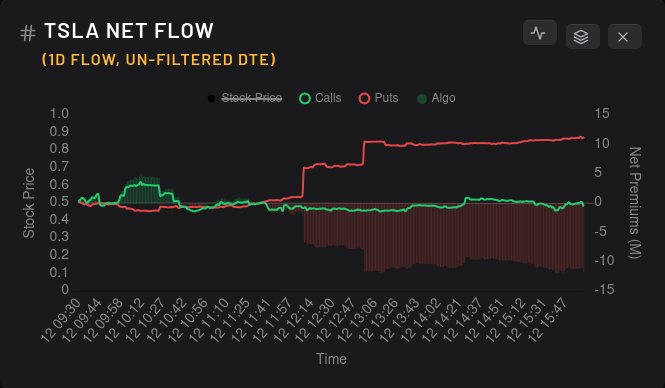
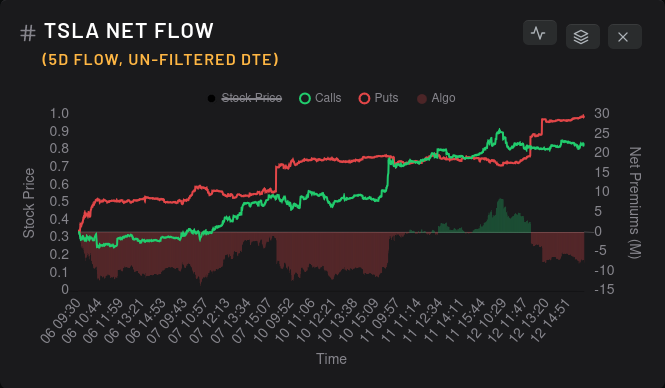
TSLA saw a spike in puts mid-day, but I couldn't find anything in the price action that would have set off those trades. It was enough to flip the convergence on the five day chart:
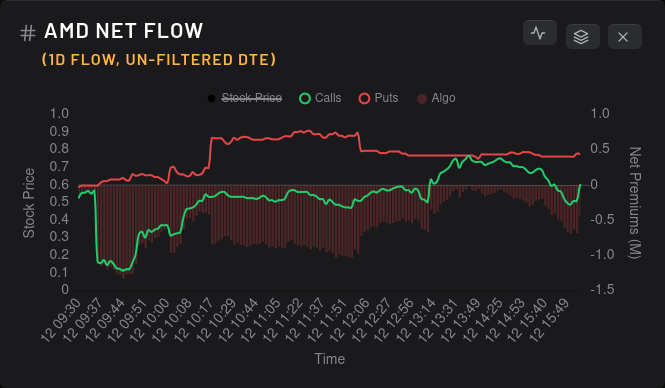
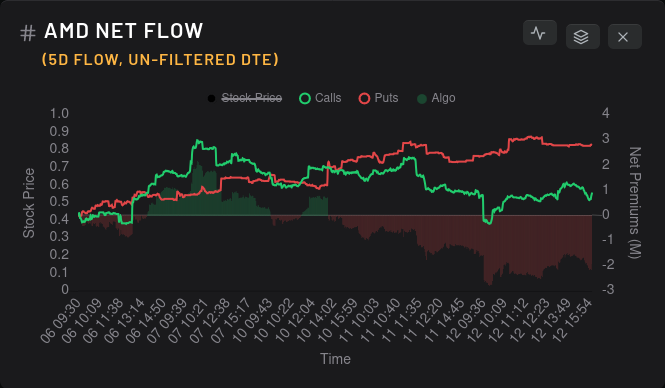
AMD still struggles to get past $115. Each time it nears that level, put flow increases and holds. That happened again yesterday around 10AM. Calls had a slight uptick into the close, but not enough to close the gap on the five day chart:
Dealer positioning
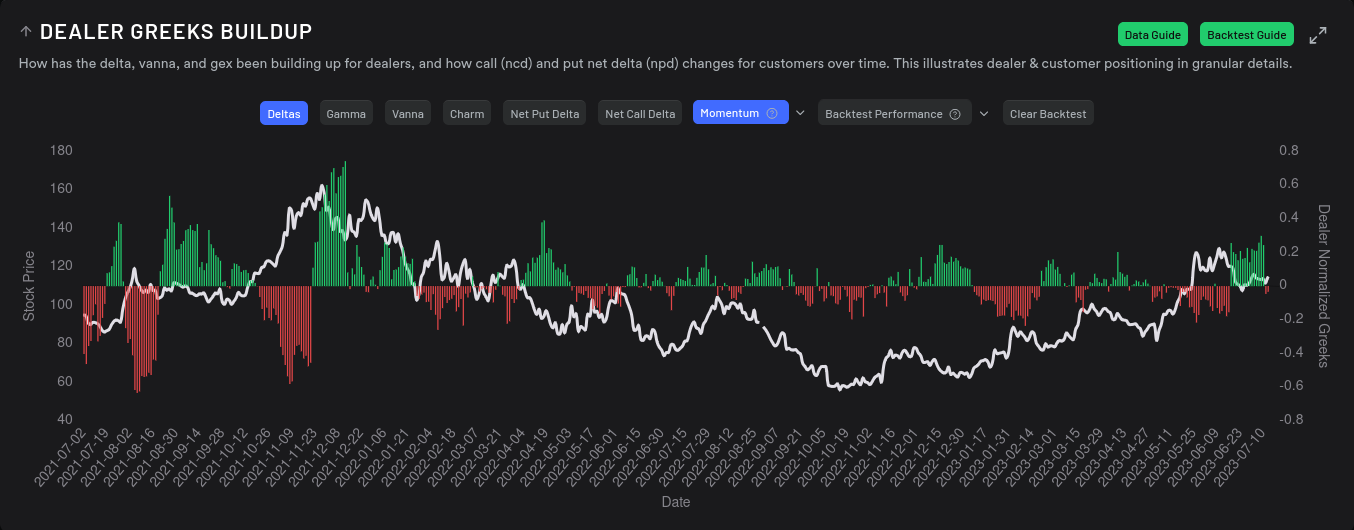
For TSLA, dealers have recently been long, which suggests market participants are bearish. However, the momentum has held near zero for two days straight. That suggests to me that bullish and bearish market participants are battling over this price point but neither have won out yet.
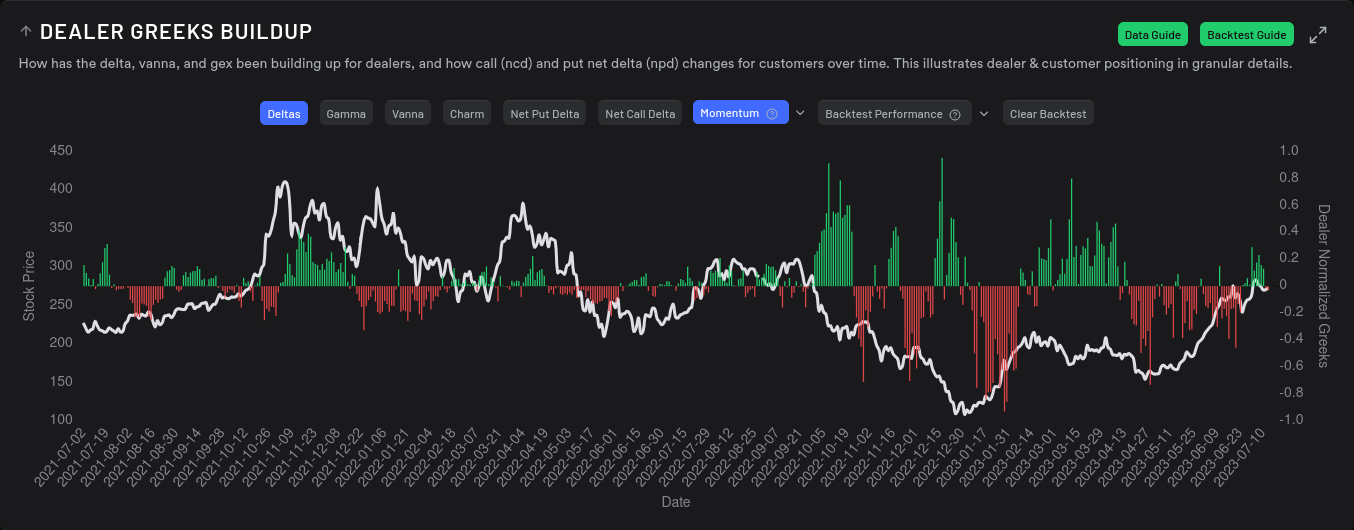
AMD had a similar situation, but dealers were long on AMD for a much longer period. The last two days show a momentum very close to zero which means there's a battle between market participants here, too.
Keep in mind that both of these stocks are headed towards earnings within the next few weeks. TSLA reports on 7/19 and AMD on 8/1.
Dark pools
Again, I don't put much faith in dark pools, but I do like to use them to see they correlate with other data.
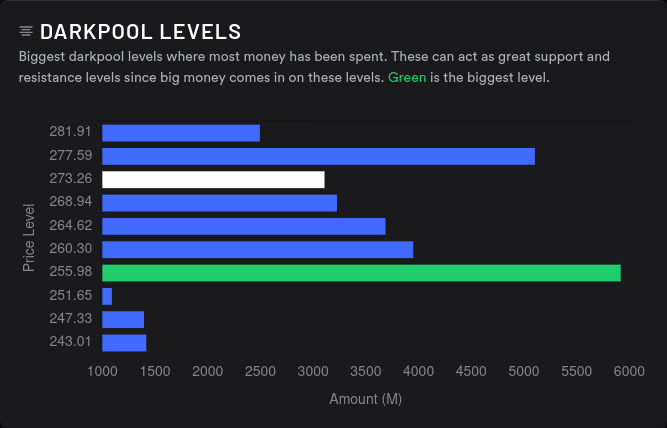
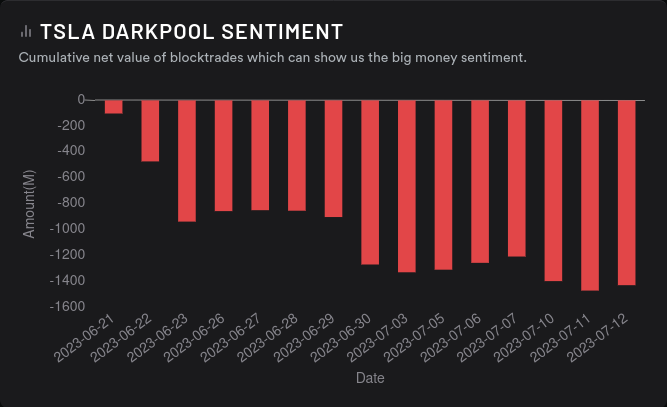
TSLA's negative sentiment has leveled off and the highest volume appears around $256. The second highest level is around $277-$278, so this suggests we might be range bound between now and earnings time. TSLA's overall dark pool volume is extremely high and the volume peaked around June 26.
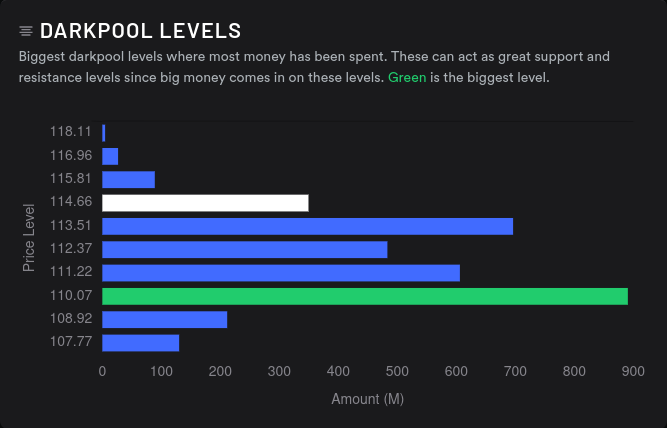
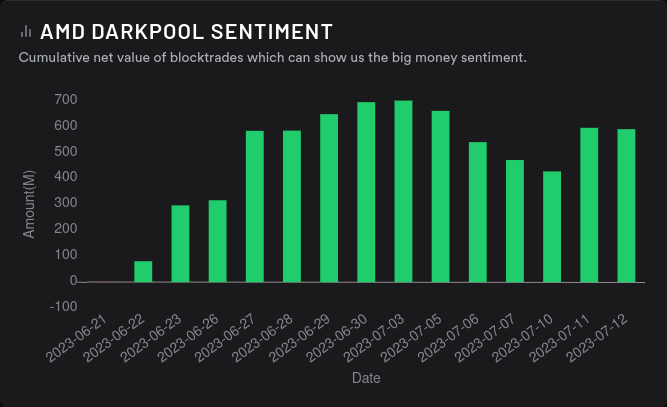
As for AMD, dark pool volume is relatively high but nowhere near the levels from March 2023. Sentiment is bullish and leveling off. The highest volume shows up around $110 and this has been a solid level of support lately. I've sold plenty of $110 puts lately and enjoyed good returns.
Volume falls off around $114-$115 and we've seen liquidity challenges past that point multiple times. Also, there are some strong gamma selling effects at $115 (which I would love to verify are still present, but Volland is still broken).
Thesis
It seems like the market is charging TSLA up for some kind of move, but it's difficult to tell which. Dark pools suggest bearish sentiment is slowing and dealer greeks show a similar story. However, put volume is still outpacing call volume. I sold a $295 call for 7/21 and I'll happily take assignment there as my cost basis on the shares are around $255. (Thanks to the Theta Gang cost basis tracker for keeping a tally on that!)
As for AMD, it has mixed data. On one hand, we seem to be topping out at $115 based on dark pools, options flow, and looking at liquidity on the chart itself. However, dealer greeks have gone from pushing bearish to flat. AMD needs some kind of push to get over $115. That might come from news or something bigger in the semiconductor sector, but we haven't had it yet. Earnings could be the catalyst for that move, too.
I'm long plenty of AMD shares and I've sold buckets of covered calls on AMD for 7/21 from $118-$120. If price sneaks past $115 and threatens assignment on the calls, I'll be okay with that. My cost basis is around $97.
Good luck out there. 🍀
Discussion