CRWD analysis for 2/12
Fresh off a Super Bowl ad blitz, CRWD looks like it's building a base for a rally going into earnings. Let's dig into the data. 🔎
I've made some trades on CRWD lately and I figured it was a good time to have another look at the charts after last night's Super Bowl ad:
CRWD has earnings coming on March 5th after the market close.
All investments come with significant risks, including the loss of all capital. Please do your own research before investing, and never risk more than you are willing to lose. I hold no certifications or registrations with any financial entity.
Let's dig into the data for Crowdstrike and see if we have a greater risk of upside or downside moves going into earnings.
Quick broad market look
One of my weekly rituals is to watch Ciovacco Capital's excellent weekly recap video where they take you through tons of different trends in the market over varying time periods. As usual, last week's video is a good one to watch:
Since last earnings
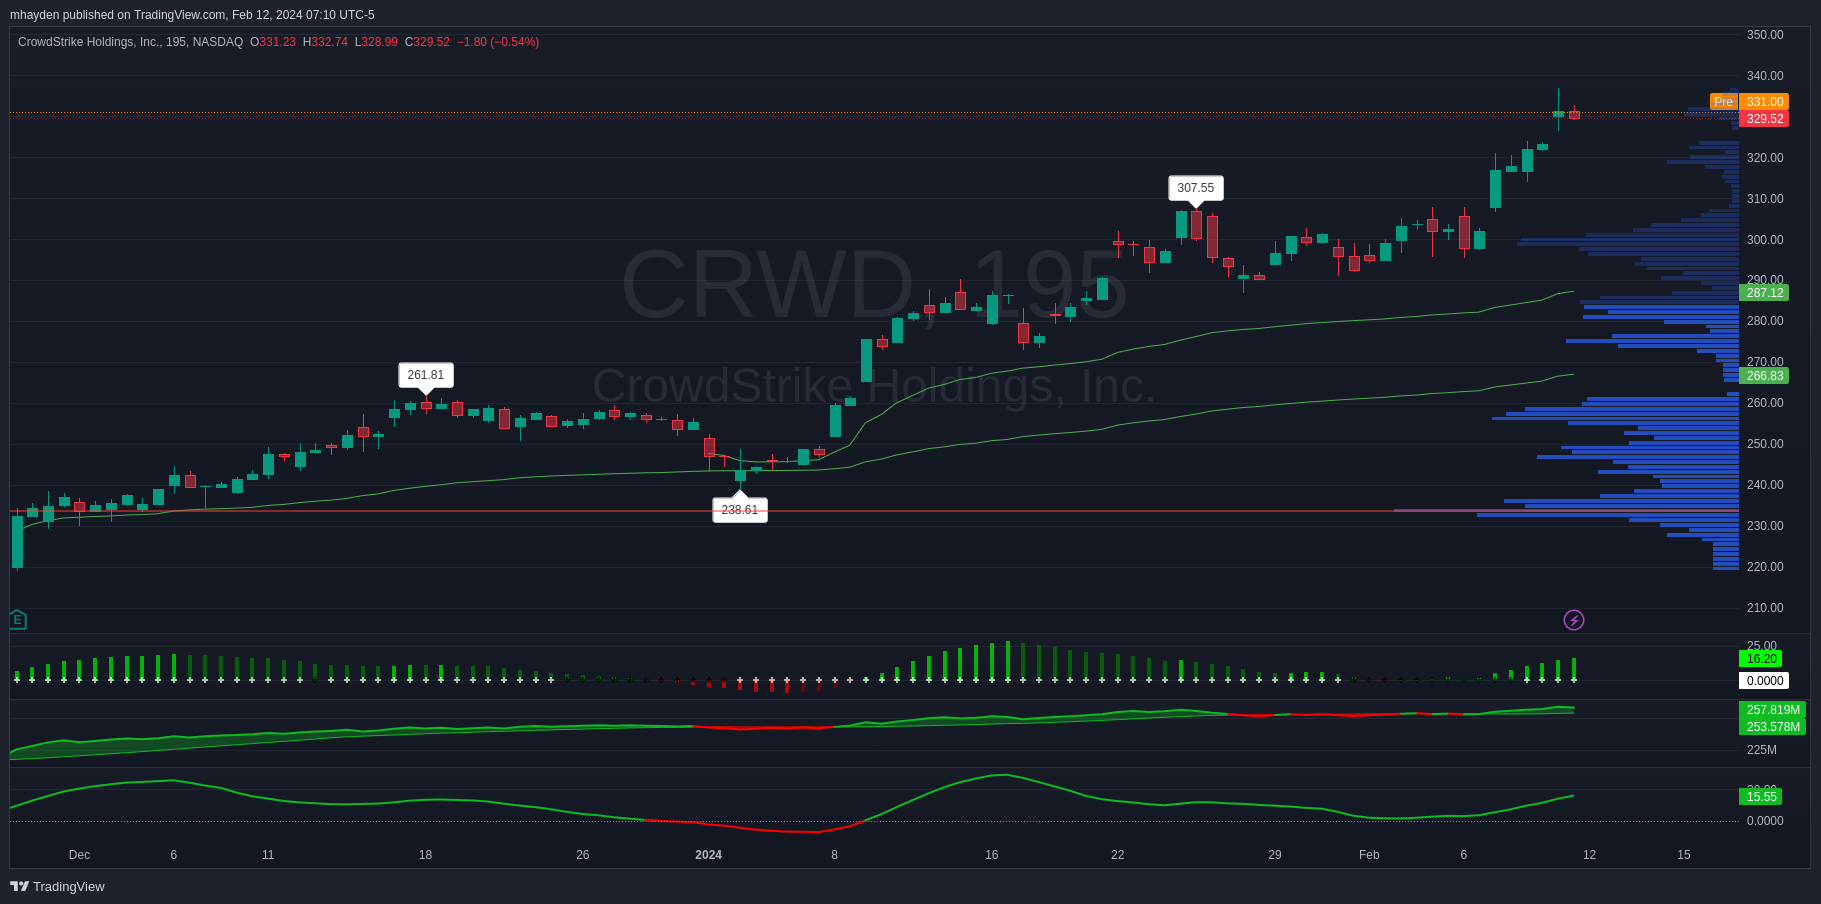
Let's start with a 195m chart (two equal bars per trading day) since the last earnings call on November 28th:

CRWD remains above two important VWAP lines from the last earnings call as well as from the beginning of 2024. That indicates a risk of further upward moves.
The blue Volume by Price (VbP) indicator on the right indicates high volume areas around $234, $255, and $300. These are likely areas where price might be drawn to in the event of a correction or pullback.
The three indicators from top to bottom indicate:
- TTM Squeeze: The squeeze is "on" and bullish.
- On balance volume: Volume is supporting the current move up and that volume has been above the moving average line for over a week.
- Coppock curve: The rate of change of the stock is increasing. This is another bullish sign.
We're already at all time highs here, so there's really no way to gauge where price action might stop. However, if CRWD does pull back a bit, the first stop would be around $318 and then $300.
Institutional trades
The charts from Volume Leaders tell us where institutions are interested in trading CRWD. Although these trades don't tell us the directionality or sentiment of these trades, we can find out when they happened, how many shares were traded, and the price where they were traded.
Let's start things off with a chart of CRWD since the last earnings call with closing trades (market on close) hidden:

The #1 level on the chart is $270, but there were some big trades scattered from $250-$260 during the December consolidation. This strikes me as the strongest support level on the chart.
If we scoot further to the right, there were lots of dark pool trades (orange circles) with a #30 trade right around $300 from January 23 to February 2. This was a big volume level on the chart as well.
At this point, I'm thinking $270 and $300 are our big support levels in case the price action turns lower. Let's dig into this further by getting another chart since the beginning of the $300 consolidation on January 23:

It's clear here that institutions were very interested in CRWD at the $300 level. I keep seeing this pattern on lots of charts where institutions try to pile into a stock as quietly as possible during a consolidation period before it blasts off the level. This is another one of those cases.
It's also interesting to note that when the price jumped off the $300 level, institutions haven't done much with it. Sometimes you'll see some profit taking as price rises, but I haven't seen a significant amount of that yet.
Thesis
We have a lot of evidence supporting an argument that there's more risk to the upside on CRWD in the near term. Every indicator is looking bullish on the chart itself, and it's about $30 over the heavily-traded $300 level. Institutions don't seem to be looking for the exit in any meaningful way yet.
I'd love to see another consolidation around $330 here followed by another blast higher before earnings. Cloudflare (NET) recently had a good earnings call and the cybersecurity sector will certainly see more demand as attackers wield the power of AI to make their attacks more efficient and effective.
I sold two April 19th $280 puts last week for $6.35 each. They were down a bit on Friday, but they should be looking a little better once the market opens this morning. These are fairly conservative at 0.16 delta (1 standard deviation), but I might consider rolling to $300 since that level has been traded so heavily by institutions.
Good luck to everyone today! 🍀


Discussion