Did traders know about the Crowdstrike issues early?

Crowdstrike's stock was giving some hints about a weakening rally before the worldwide incident. Traders were getting out in a hurry. How do we find these events in the future? 🤔

Howdy! 👋 The Crowdstrike outages that rocked the world last week have made front page headlines everywhere, but quite a few people have pointed at some signs in Crowdstrike's chart that point towards investors knowing that something was coming. Fintwit loves to get clicks, so let's see if we can figure out what might have happened (and how we might spot it in the future).
But first:
All investments come with significant risks, including the loss of all capital. Please do your own research before investing, and never risk more than you are willing to lose. I hold no certifications or registrations with any financial entity.
Let's dig into some charts.
On balance volume
Let's get a common understanding of on balance volume, or OBV, before digging into the data. It's a stock chart indicator that has been around for a long time and it has a fairly simple calculation (pulled from the StockCharts page linked above):
If the closing price is above the prior close price then:
Current OBV = Previous OBV + Current Volume

If the closing price is below the prior close price then:
Current OBV = Previous OBV  -  Current Volume

If the closing prices equals the prior close price then:
Current OBV = Previous OBV (no change)
Said another way, if the stock has a green candle for the day, then the volume from that days trading is added to the OBV line. Red days cause the volume to be subtracted. If you see the stock price moving up, but the OBV line is fairly flat, then that's a signal that the rally needs some additional scrutiny.
In addition, if the OBV line barely moves up on green days but then it drops a lot on the red days, that could be a sign of a weakening rally.
Abrupt changes in the OBV when the stock price isn't moving much can be a huge sign of someone trying to accumulate or sell a large amount of shares as quietly as possible. This pattern is fairly common with institutional trading (trades from large firms with deep pockets).
Daily chart
Here's my daily chart for CRWD. My indicator stack includes, from top to bottom:
- SCTR rating: A composite indicator including short, medium, and long term technical analysis indicators.
- 50 (blue) and 200 (red) day moving averages
- On balance volume
- Relative Strength Indicator (RSI)
- Relative Strength Ratio relative to RSP (equal weight SPY)
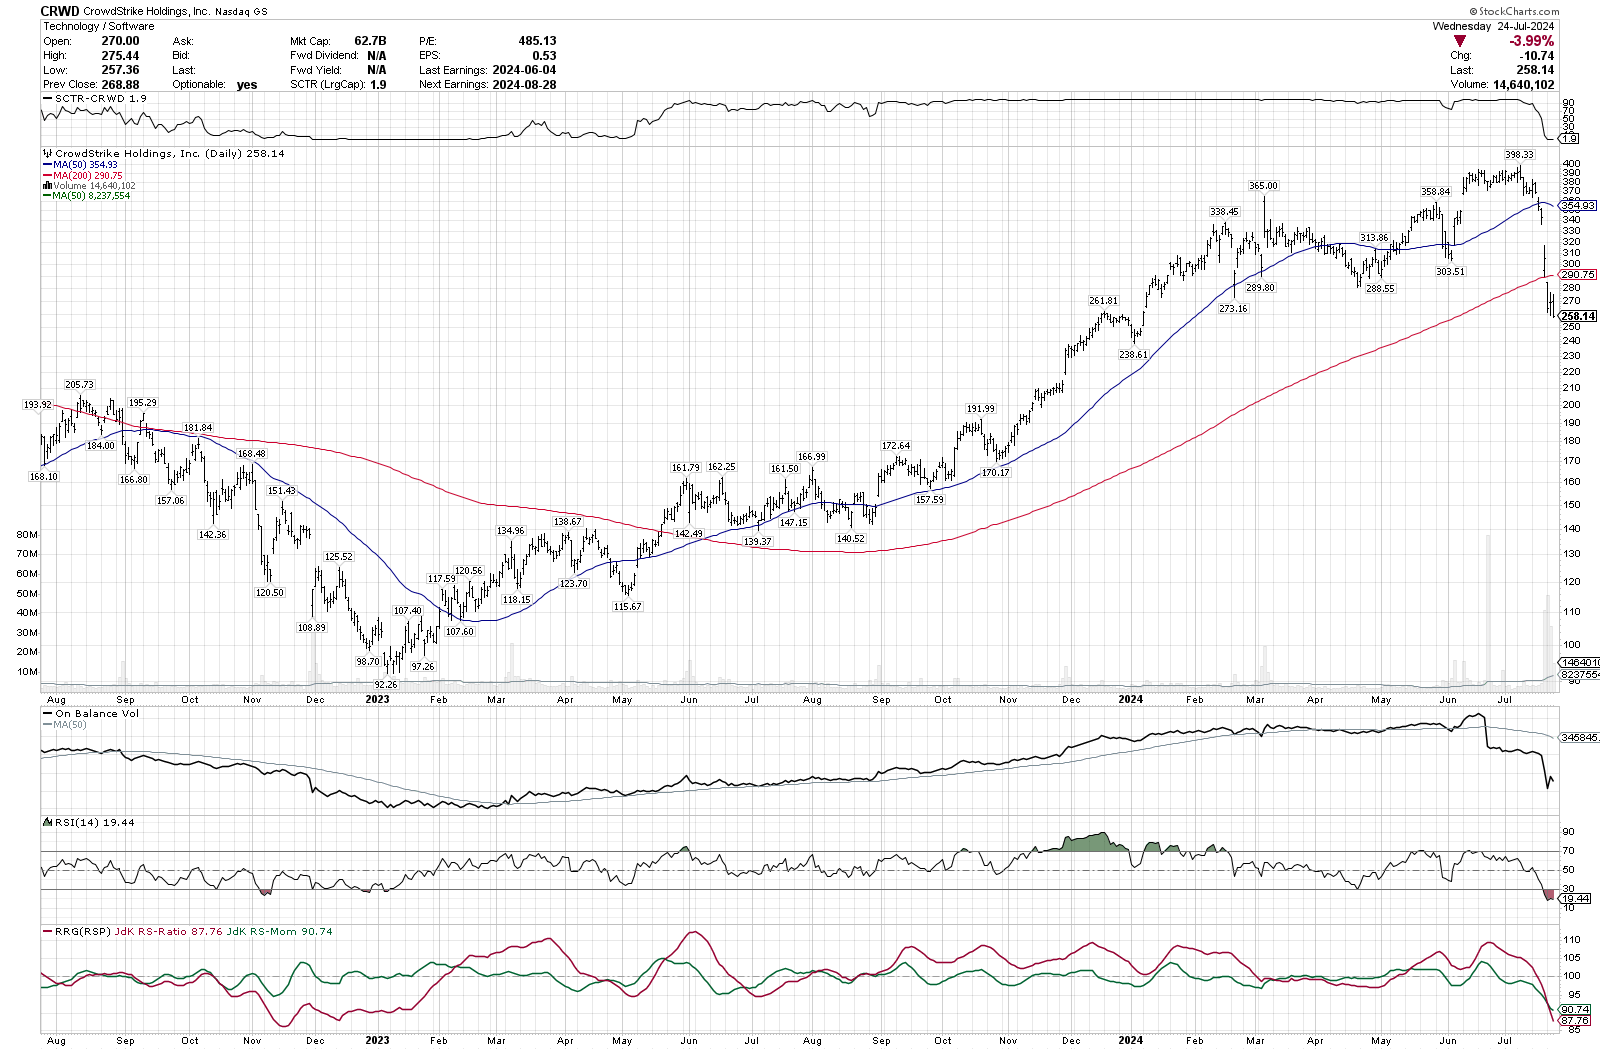
June's price action began with a rally to just under $400 that stalled out for a few weeks. However, look at the OBV indicator (third from the bottom) right around the second half of June. It dropped off heavily on June 21. RSI didn't move much and CRWD's strength relative to the equal weighted SPX didn't move much either.
But what happened in July? A huge slide from $398 landed at $258. That's close to a 35% drop! Yes, there was a ton of news around the incident starting on July 19th, but CRWD was already sliding downwards before that. It was already showing quite a bit of weakness during its consolidation phase under $400 and the news certainly didn't help.
Weekly chart
Situations like these always make me think about how I can pick out these patterns earlier and exit trades before the market turns ugly. The weekly chart has some clues for us, too:
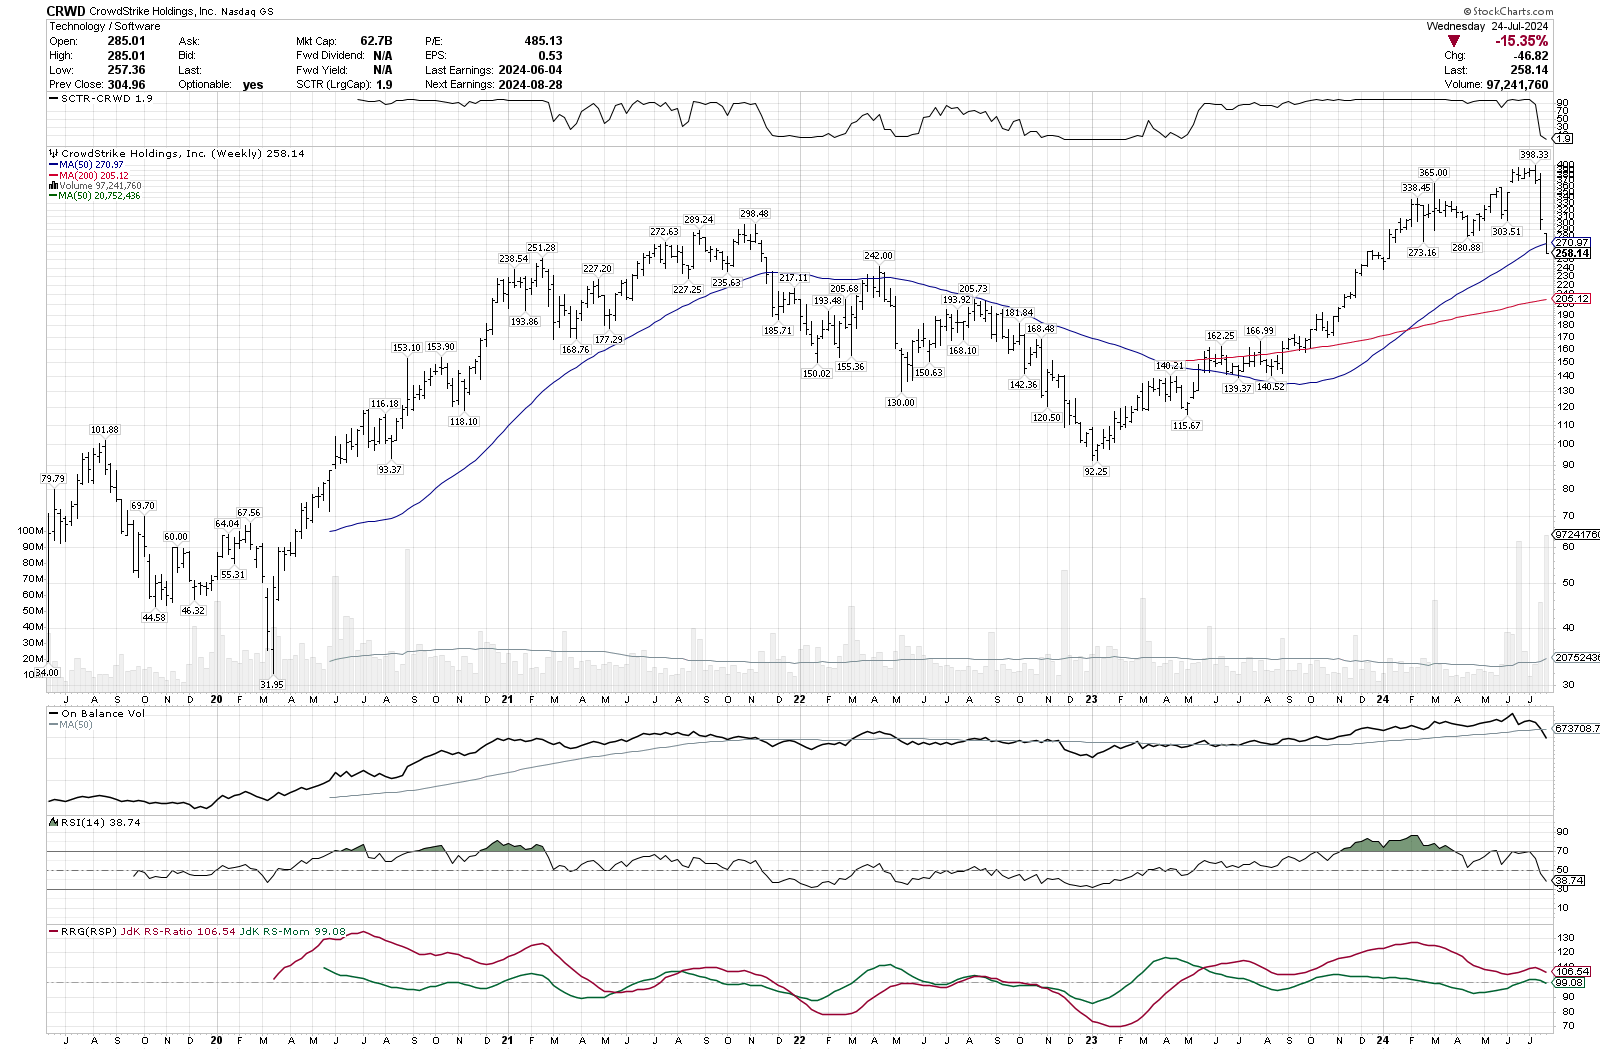
If we compare the 2024 highs at $365 and $398, there are some interesting differences:
- OBV initially printed a higher high but it then dropped off abruptly just before the $398 high was reached.
- RSI made higher highs at $365 but then put in a lower high as we reached $398.
- CRWD's strength relative to RSP made a much lower high as it approached $398 from $365.
All of this points to a rally that was on weak footing.
Institutional volume
Volume Leaders provides some good insight to see what traders with deep pockets are thinking at certain price levels. It also gives you insight into how big these trades are relative to other trades on a certain ticker or ETF. For example, $500M worth of AMD changing hands is a pretty big deal. But $500M of the SPY ETF moving around doesn't tell you much.
It's critical to remember that institutional trades won't tell you directionality of the trades. You don't know if they're entering a long position with a bullish bias or starting a new short position. They could also be taking profits on a position that worked out well or taking losses off the table for one that didn't. However, these trades give us some good data points to increase our edge slightly at certain times.
Here's a 90 day chart from Volume Leaders for CRWD with the top 10 trades shown with a rank of 100 or better. (Volume Leaders ranks trades based on how large they are relative to other trades in the ticker's history. For example, a #50 trade means that it's the 50th biggest trade ever made on that ticker.)
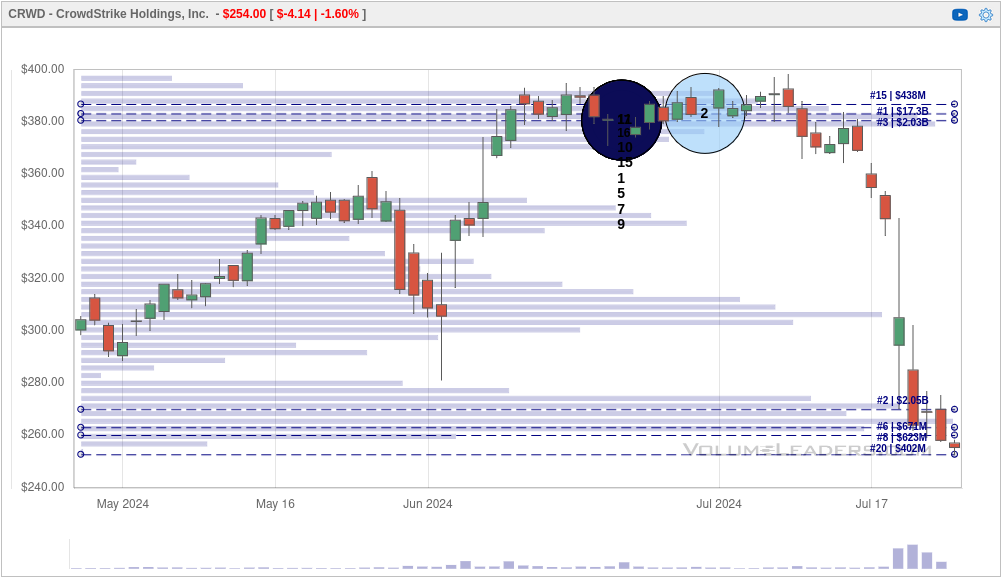
Whoa! Each circle here represents a big institutional trade, but there are so many circles stacked on each other for June 21 that I can't even see what's there. However, I can see that there's a #1 trade (bigger than all trades ever made on CRWD!) somewhere in that circle. There's another #2 trade of 3.5M shares at $383 from June 28.
Let's zoom in on 6/21 in isolation and see what we find:
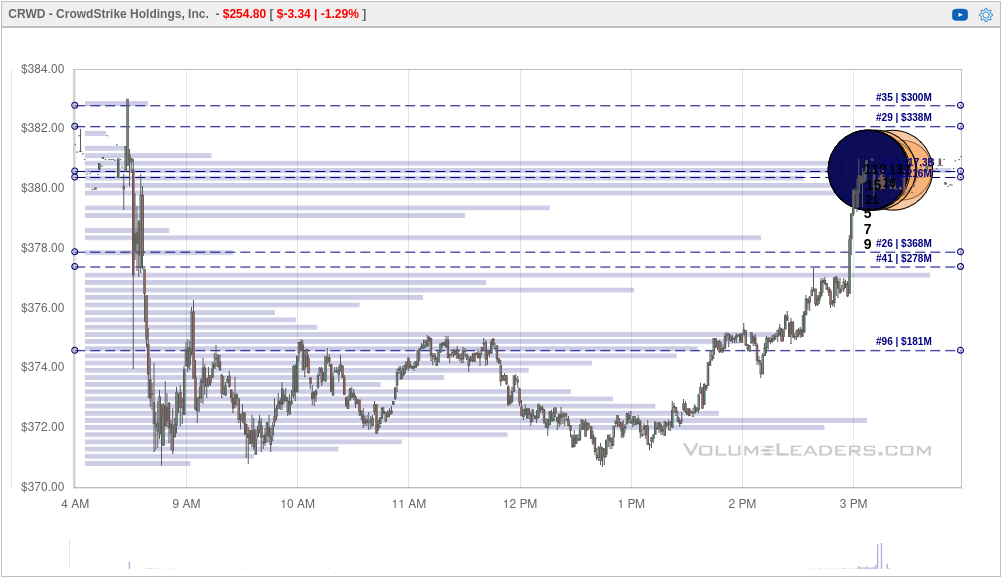
All of these trades are "market on close" trades. There's a quick auction that happens at the end of the day in the market where "buy on close" and "sell on close" orders are executed as quickly as possible. This is often a time when ETFs rebalance their holdings or institutions make larger adjustments to their positions. June 21st was also a monthly options expiration (OPEX) date and there may have been a ton of options contracts expiring that day.
If these options contracts were expiring "in the money", this would have caused lots of institutions to adjust their positions at the end of the day. Remember that CRWD had rallied almost 31% since the last OPEX date in May.
So, just how big were these trades at the end of the day?
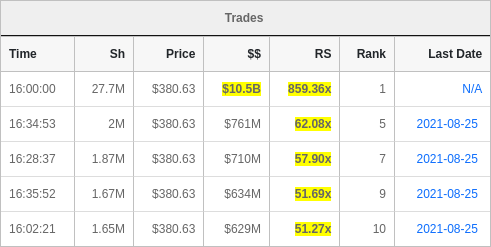
The #1 trade was 27.7M shares at $10.5B. 🤯 That trade was 859 times bigger than the average trade made on CRWD. CRWD's daily volume was usually under 5M shares, but 6/21 saw a trading volume of over 74M shares total. This is one of those situations that really gets my attention.
As a reminder, we don't know the direction of the trades based on what we have here. It requires us to infer some things based on what the rest of the market is doing. After 6/21, the RSI continued to decline as the stock price barely marched upward. CRWD's strength relative to RSP was dwindling, and that means the rest of the market was moving much higher than CRWD. It was being left behind.
Thesis
Lots of people have asked me where the bottom is for CRWD. I don't try to predict the future, but there's likely still more risk to the downside. The incident was really ugly for Crowdstrike customers and the clean up is still underway. However, this does show that Crowdstrike has a lot of customers, especially very large organizations. Will they leave or stay?
The key takeaway here is to look for data that puts price movement in doubt. You might want to look for these:
- Sudden changes in volume (higher or lower)
- Price making new highs while OBV or RSI show weakness
- Stocks moving up slightly while the rest of the market leaves them behind
As for me, my last trade on CRWD closed on 6/10 and I had a strange feeling about the price action after that date. The consolidation didn't have the familiar pattern I'm used to seeing (gradually increasing volume with price consolidating) and I stayed on the sidelines. I did keep trading PANW, though. 😉
CRWD's current chart breaks my trading system rules. I won't trade it until it climbs over the 200 day moving average. This could be a great opportunity to scoop up shares at a 30%+ discount, but I'm not interested.
Good luck to you in your trading and investments. 🍀
Discussion