First deep dive on TSLA

Are we going to $300? 🔋 Enjoy my first deep dive into TSLA's stock and options data.

here's been no shortage of chatter lately about TSLA, including lots of news about breaking into India's market. But this blog isn't about news and all of the manipulation that goes into it.
No, we're interested in the overall market manipulation that we can measure with nerdy options data. 🤓
I'll take a look at TSLA's stock and options data today to see where it could be headed. But first:
All investments come with significant risks, including the loss of all capital. Please do your own research before investing, and never risk more than you are willing to lose. I hold no certifications or registrations with any financial entity.
Technical Analysis

Our short term indicators seem to be the most bullish. Long term indicators are still looking bearish but they're weakening. That becomes pretty evident once you check the daily chart for the past 52 weeks:

The 50 day moving average is extremely close to a golden cross above the 200 day moving average. That would be a bullish sign.
Bearish traders might argue that the stock has risen too quickly without taking a break on the way up. After all, we shot from the $150's in late April to about $274 at yesterday's close on June 21. That's quite a climb.
Options data
I'll start with vanna:
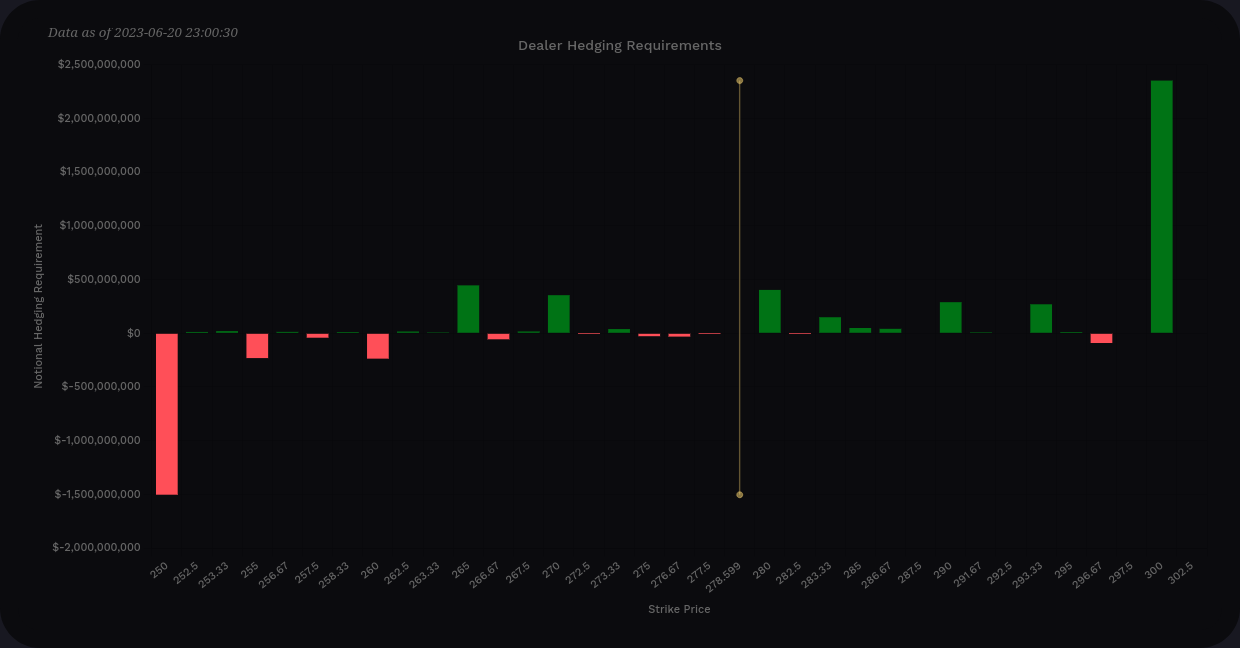
On aggregate, vanna is just over 2x more positive than negative. Two bars really stand out: a negative one at $250 at $1.5B in notional value and another positive one at $300 at almost $2.5B in notional value. These highlight some fairly large bets.
Vanna looks like it's poised to pull price to $300 if IV can remain steady or drop a bit further. TSLA's current IV rank is around 40%:

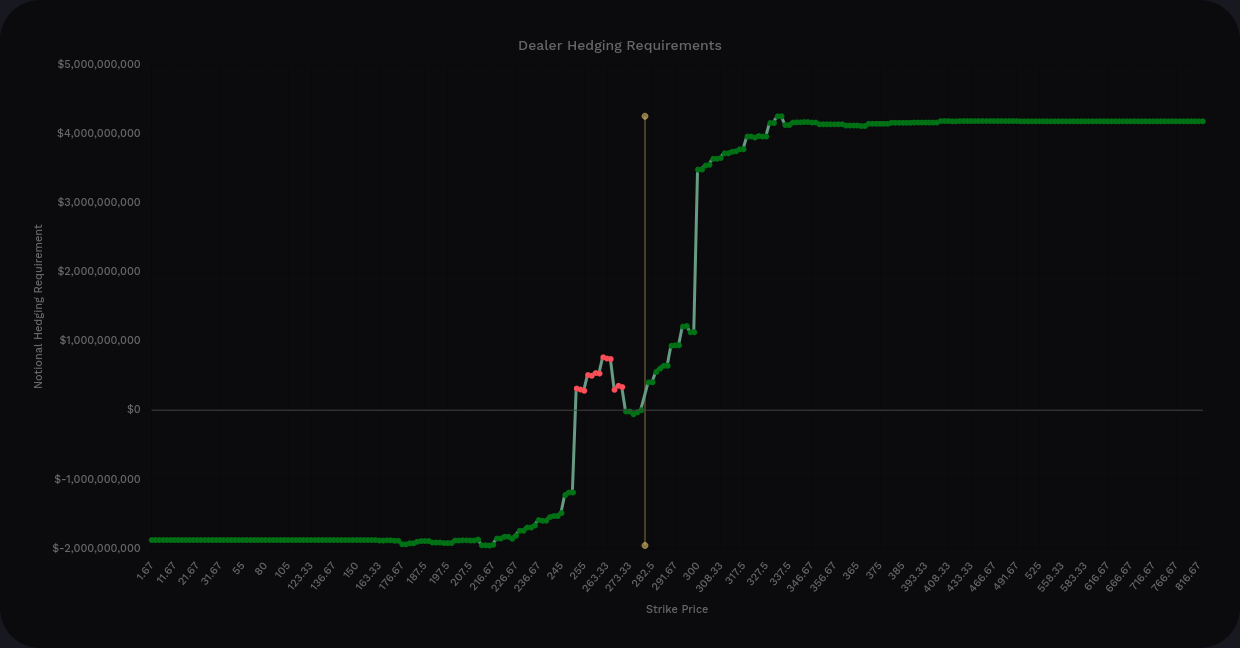
How about the other greeks?
- Gamma maxes out around $50M of notional value at the biggest bar (positive at $260) and it's fairly balanced on aggregate. It might apply some localized price resistance in a few spots but I don't expect it to have a big impact on price movements.
- Charm maxes out around $3M for the biggest bar.
Where are we seeing puts and calls stack up?


TSLA calls are heavy below $300 and puts are heavy above $300. This is another piece of data supporting the $300 strike as something pretty special.
Other data
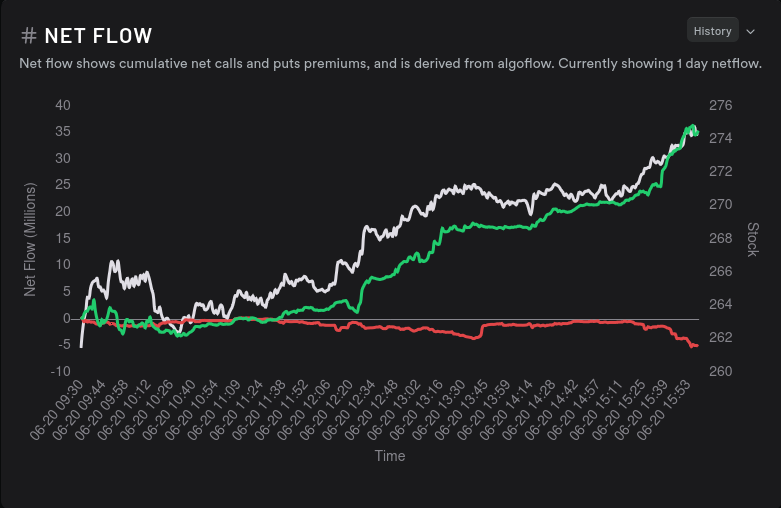
TSLA had some very bullish options flow yesterday and it seems to be priced for an upwards move:

The next question you might be asking is "Okay, so $300 might be a target. But when?" Dealer open interest shows a distinctly bullish pattern through 6/30:

My last chart is one of my favorites from Tradytics: Dealer Greeks Buildup:

This chart shows that dealers are building up more short options contracts on their balance sheet, which implies that customers are getting into more bullish contracts. If we backtest a strategy of buying when this chart turns red and selling when it turns green, we end up with a pretty good result:

But past performance does not dictate future returns. 😉
Thesis
There's certainly something special going on with TSLA right now and there's plenty of attention on the company as well as the stock. Options data shows a ton of bets on price movement moving up to $300 and getting stuck there for some period of time.
Keep in mind that dealer positioning does have an effect on stock price movement, but it's not the only factor. TSLA is in a highly volatile market with new competition coming from multiple directions. However, it's a company that continues to cut great deals with local governments and other manufacturers.
I sold a put on TSLA yesterday for some profit but I don't have any positions in TSLA right now.
Good luck out there. 🍀
All investments come with significant risks, including the loss of all capital. Please do your own research before investing, and never risk more than you are willing to lose. I hold no certifications or registrations with any financial entity.
Discussion