Friday AMD analysis for 10/6

AMD looks trapped in a range for a while but earnings appears to open the top end for some bullish moves. Earnings are coming 10/31. 🎃

Happy Friday! I hope you have an awesome weekend, but first, let's make it a great last trading day of the week. 😉
AMD has earnings coming up on 10/31 and I'm eager to see how the smart traders are setting up for this event. Remember, binary events like these are dangerous. Prices make unpredictable moves before and after earnings announcements. Double check your position sizing and adjust your risk if needed! 🎃
All investments come with significant risks, including the loss of all capital. Please do your own research before investing, and never risk more than you are willing to lose. I hold no certifications or registrations with any financial entity.
Without further ado, let's check on Lisa Su. 😄 (Sorry, I had to.)
Options flow
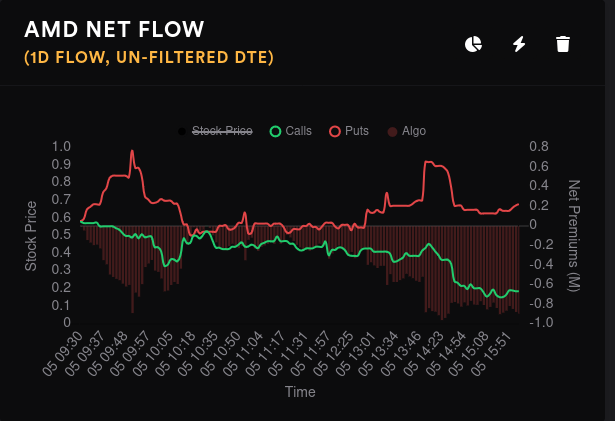
The flow this week has been unusual and contentious. Some bets on AMD closer to earnings flipped the flow from bullish to bearish on Tuesday but the lines are not far apart right now. Yesterday's flow only diverged by about 0.8M in net premiums and the gap is slightly closer on the five day flow.
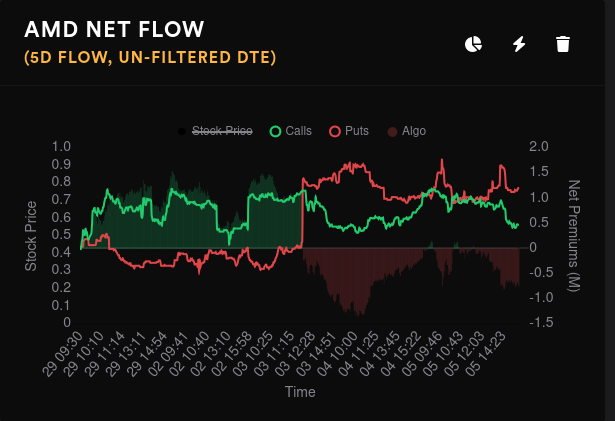
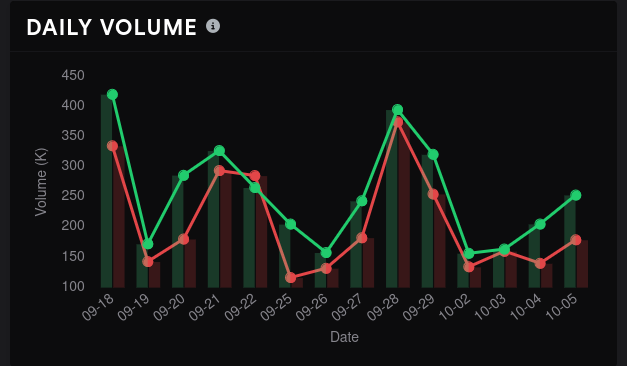
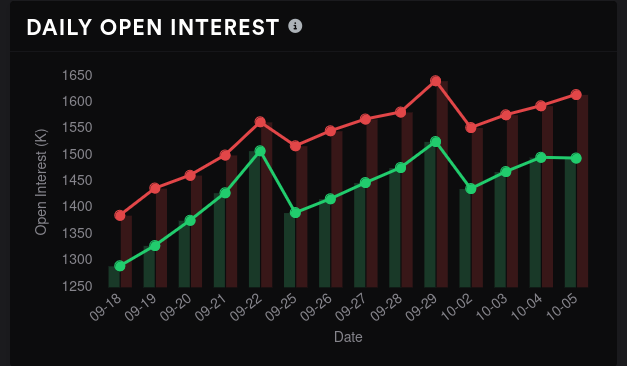
Options volume is on its way up since Monday as traders get their bets set up for earnings at the end of the month. Open interest is up as well, but mainly on the put side.
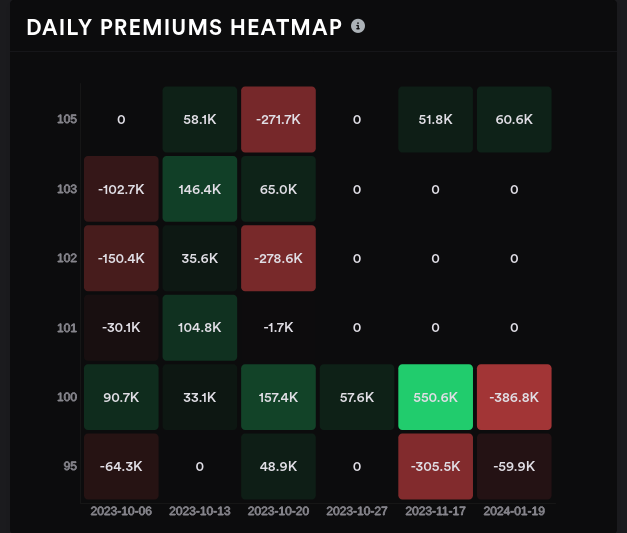
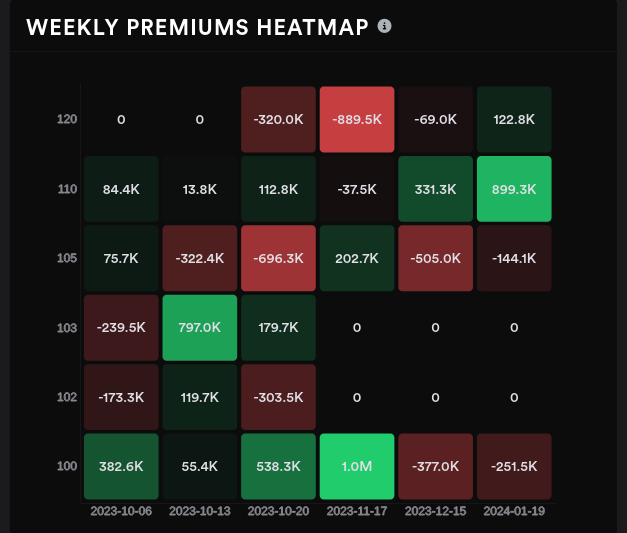
The weekly heat map is interesting here. There's more bullish attention on the higher strikes as you look at later expiration dates. $100 is certainly getting a lot of volume.
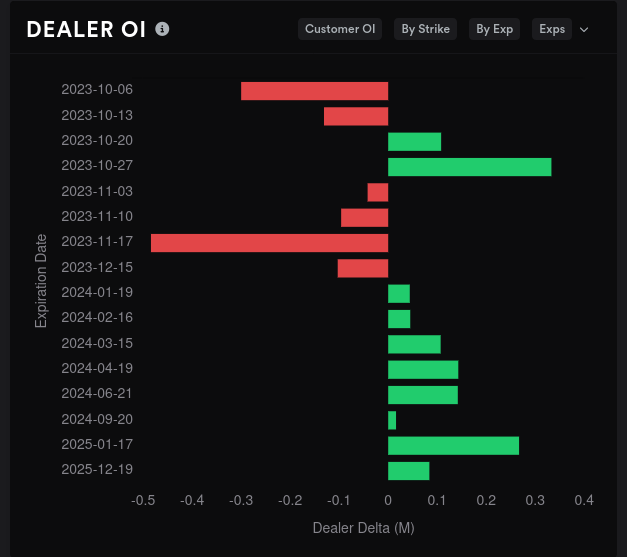
Dealer positioning
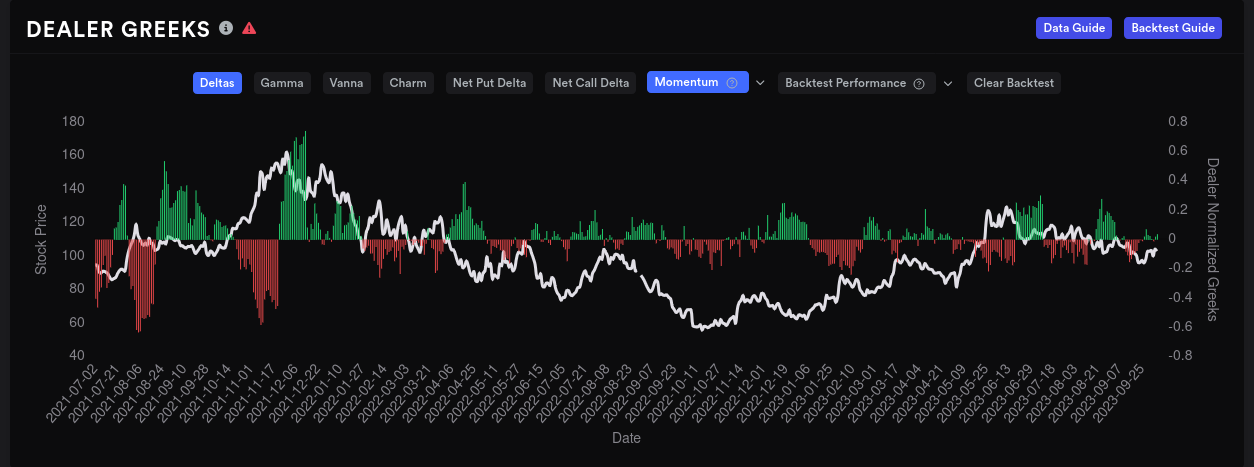
Dealer delta buildup over a 15 day momentum looks slightly long, which implies customers are leaning slightly bearish. However, the current levels are so close to the middle that I don't really see much useful data here.
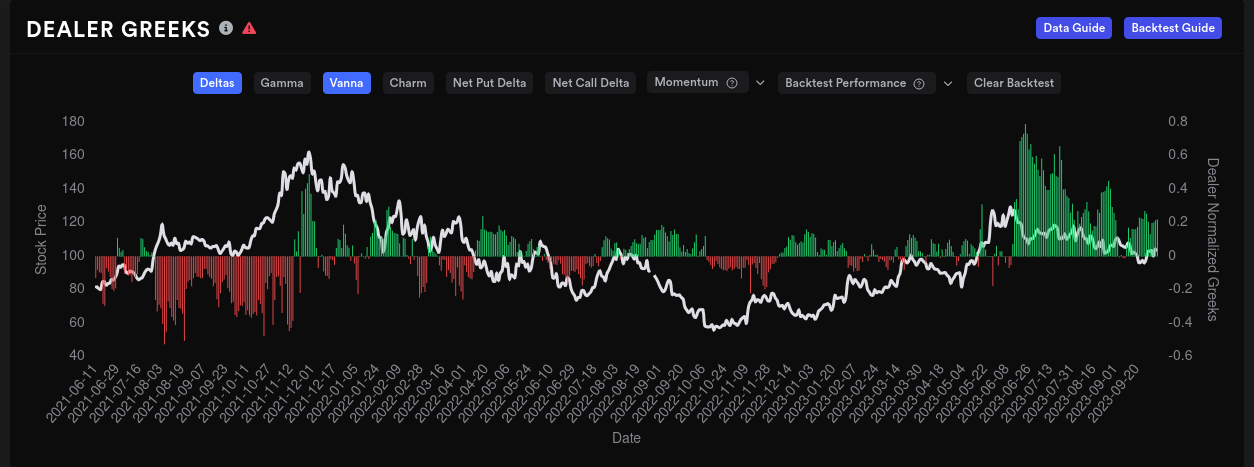
Dealer buildup of vanna is a little different. Green often precedes upwards price movement, but it takes a while to have an effect. AMD looks bullish here in the event of an IV contraction.
Dealer OI suggests that we have some bullish and bearish back and forth until 11/17, but these lines are very, very small (check the X axis). 11/17 leans bullish, but it has plenty of negative vanna. This makes me think that an IV crunch (typical after earnings) might not help pull AMD's price upwards.
AMD, like many other tech stocks, seems to have a ton of positive vanna built up for January 2024. This is where AMD's $110 bets live (and TSLA's $300 bets).

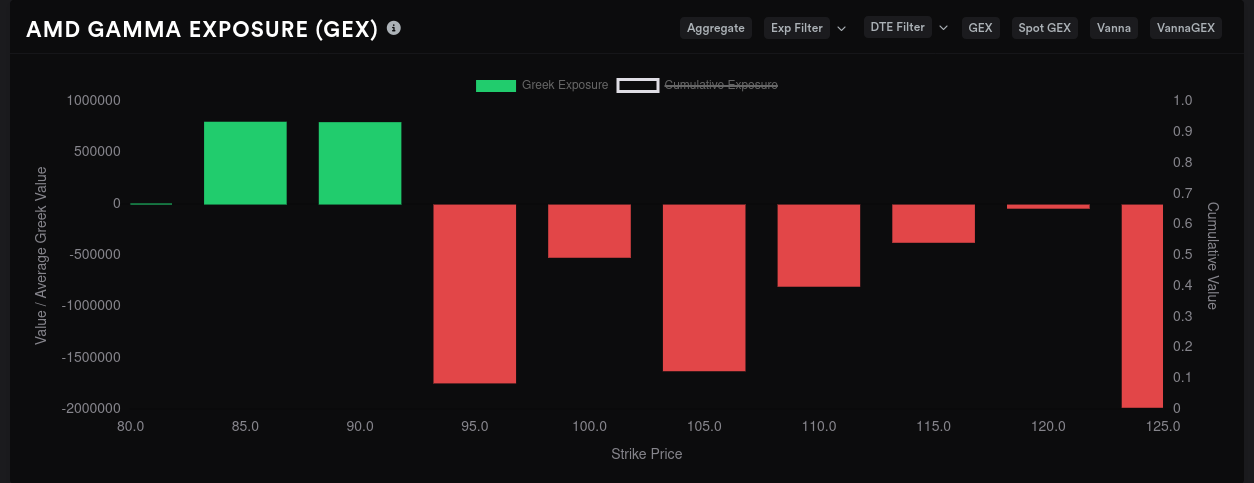
Gamma exposure
These charts measure how much gamma has built up on certain strikes. You can go pretty deep into these charts, but I look at them like this:
- Red, or negative gamma bars, often act like magnets for price. Very long bars that are much longer than anything else on the chart are clear price magnets. Also, if you see a range of prices where multiple red bars are located together, that can be a magnet for price, too.
- Green bars signify positive gamma. These often have the opposite effect of a magnet as they repel price away. Bear in mind that they can repel in both directions and sometimes add a little momentum to price movement. I like using these as support levels when they're below price and as resistance levels when they're above price.
Taking all expiration dates into consideration, AMD's aggregate GEX shows potential targets for price at $95, $98, and $101. The $105 level looks like resistance and it hasn't moved much this week.

AMD's biggest GEX expiration dates are 10/27 (last one before earnings) and 11/17 (first monthly OPEX after earnings). Let's take a look at those.
10/27 doesn't leave much to the imagination here. $98 is a big level that makes all the others look tiny. This could be a target for price before the earnings call.

11/17 looks pretty messy, but there are some distinct targets at $95, $105, and $125. This will likely change as we get closer to earnings. It is nice to see some larger bets showing up above $100 again! 👏
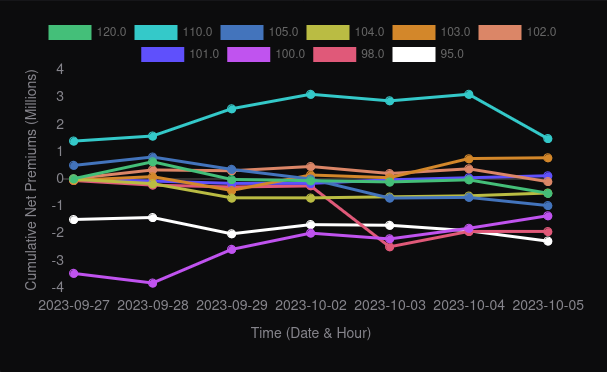
Whales
On the aggregate, whales are moderating their bets on both sides of the current price. Bullish bets on $110 are coming back down and bearish bets on $100 are coming back up.
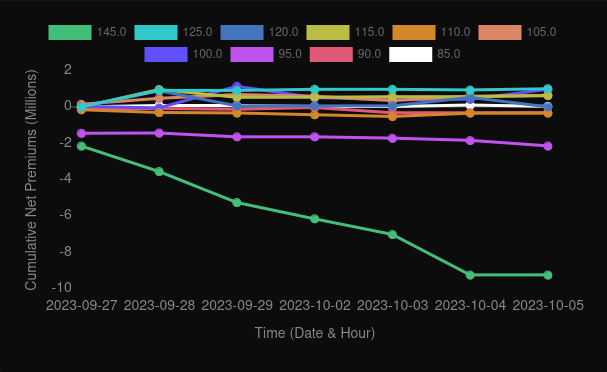
10/27 shows traders going slightly bearish on $98 before earnings. Nothing really stands out as bullish. Looking out to 11/17, someone is betting hard against $145: 🤷♂️
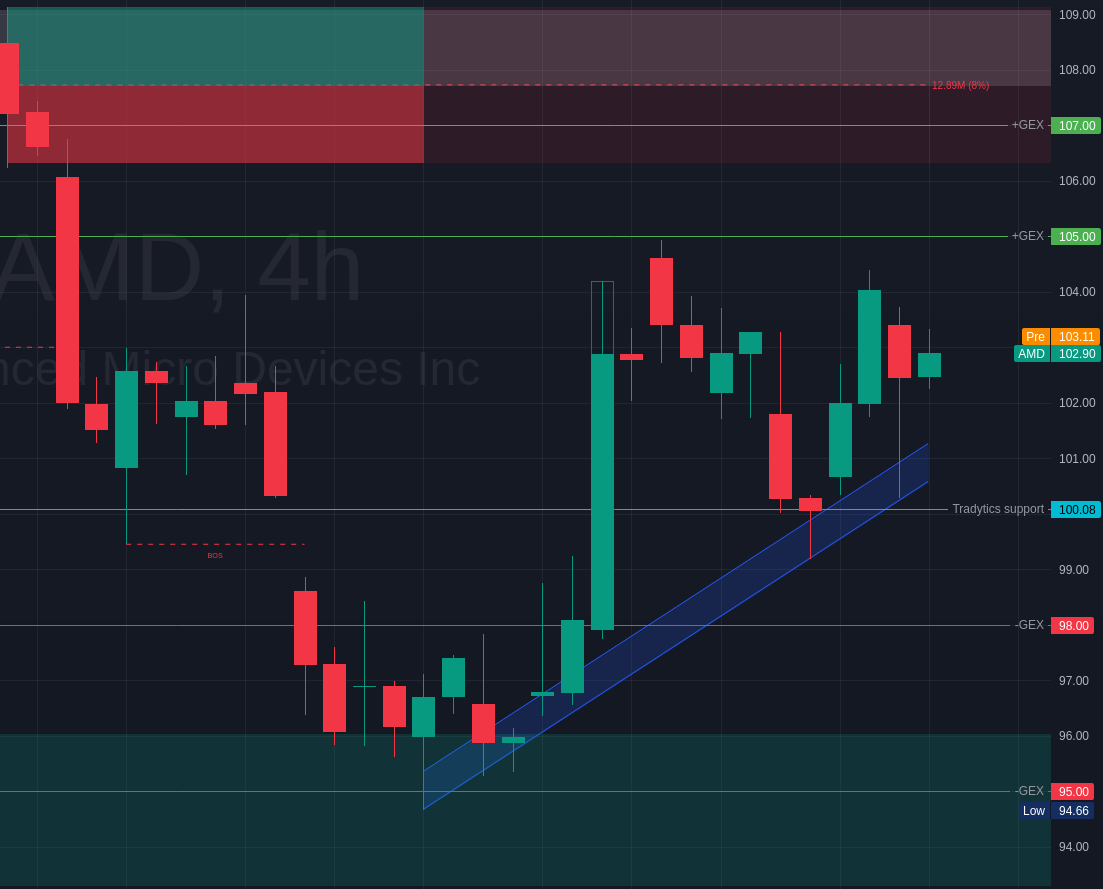
Chart
Here's an excerpt from AMD's 4h chart. We're riding a trend line upwards, but we're limited on the top side by positive GEX at $105 and $107. There's a bearish order block just above $106 that adds more resistance.
If we lose this trend line, there are some support levels below. Tradytics identified a support level around $100.08 and then we have negative GEX at $98 and $95. The large green band below $96 is the beginning of the discount zone.
Discount zones are an ICT concept based on significant highs and lows in the chart. When price enters the discount zone, there's a high chance that it will bounce back out with decent volume. AMD landed in there for several days (Sep 20-27) until it bounced out on 9/28 with a massive green candle. Then we finished the morning with a bearish liquidity grab that sent us back down to the trend line.
Thesis
AMD looks like it will be held in a range until earnings, or until we know about the possibility of an interest rate hike. $98-$105 seems like a safe range to trade for now, but aggressive traders might want to monitor that trendline to see if we break out over $105 at some point next week.
I'm really interested to see if these positive GEX lines disappear or move higher into next week. I've already seen SPY's GEX lines scoot higher over this week. AMD will have some challenges at $110 and definitely at $120 prior to earnings.
Thanks for reading and good luck today! 🍀
Discussion