Friday wrap for 8/4

We made it to the weekend! I'll dig into TSLA today primarily and look at the changes in AMD since yesterday. 🌴

We made it to Friday! 🎉 This week was a wild one for all kinds of news, earnings, and economic challenges.
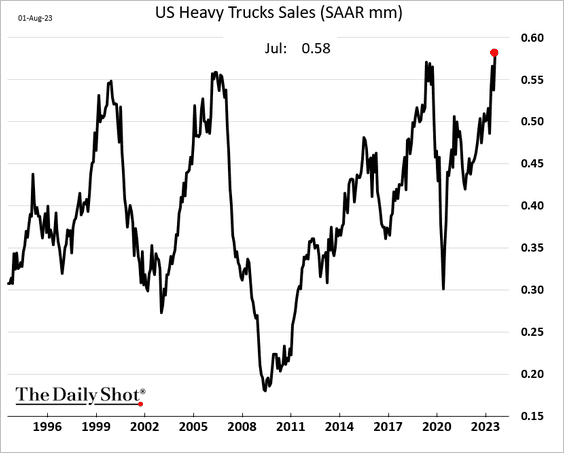
In a macro view, services revenue continues to drop from some pandemic highs back to normal levels and hiring has slowed down a bit more. Heavy truck sales have gone through the roof, which suggests that manufacturing and shipping is rallying back:
Also, companies are thinking harder about what to do with cash and the trend for stock buybacks has faded:

I'll get a look at TSLA first today and follow up with what's changed for AMD this week. But first:
All investments come with significant risks, including the loss of all capital. Please do your own research before investing, and never risk more than you are willing to lose. I hold no certifications or registrations with any financial entity.
Let's go! 🤘
TSLA
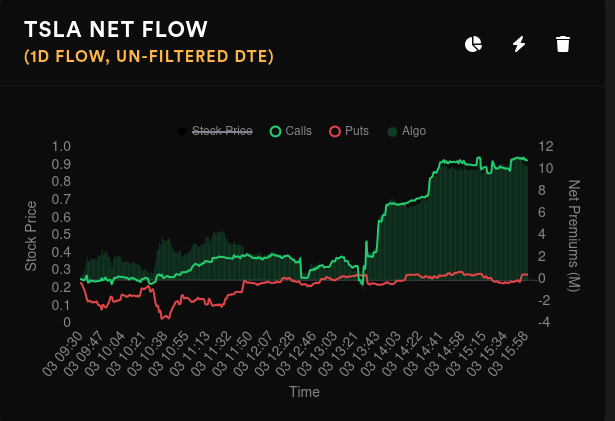
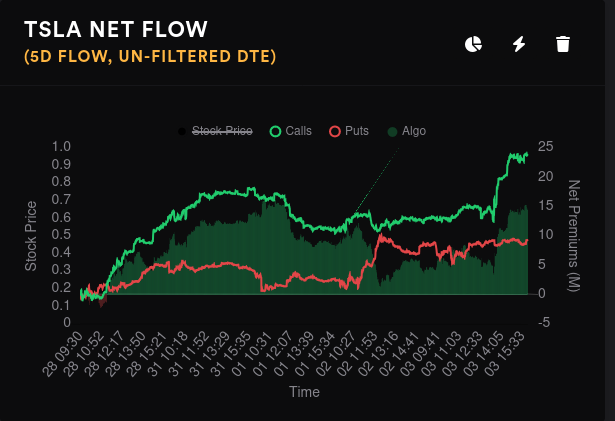
Let's start with a look at the options flow for one and five days. We've been tilting bullish overall for five days with a decent run upwards yesterday. However, puts crept up on August 2nd and they haven't come down yet.
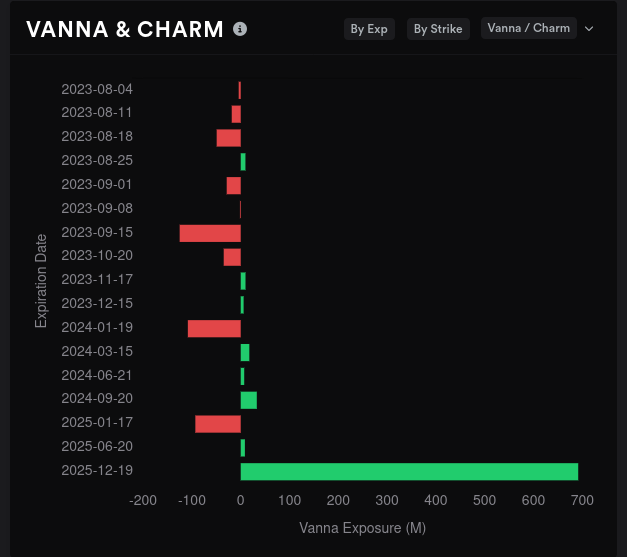
TSLA's aggregate vanna is a mixed bag, but it looks bearish overall to me. One thing to note is that we're currently trading just over $260 in pre-market trading as I type this and that means two things:
- $260's vanna bar has almost zero effect on price action right now (vanna runs to zero as price approaches the level)
- Crossing above $260 flips that bar and turns it green, which leaves the only big red bar at $250
If IV crunches and TSLA remains above $260, there's a chance we pull towards $265 or $267.50.

If I narrow down vanna to look at 8/4 through 9/15 combined, things turn a bit ugly. Now, if TSLA can climb over $260, that bar flips positive. However, TSLA must find a way to push higher as vanna needs a little distance from price to have an effect (most effective around 0.15-0.35 delta).

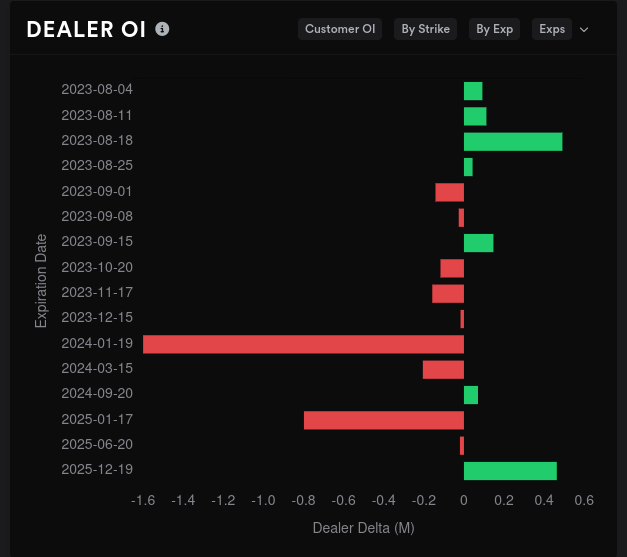
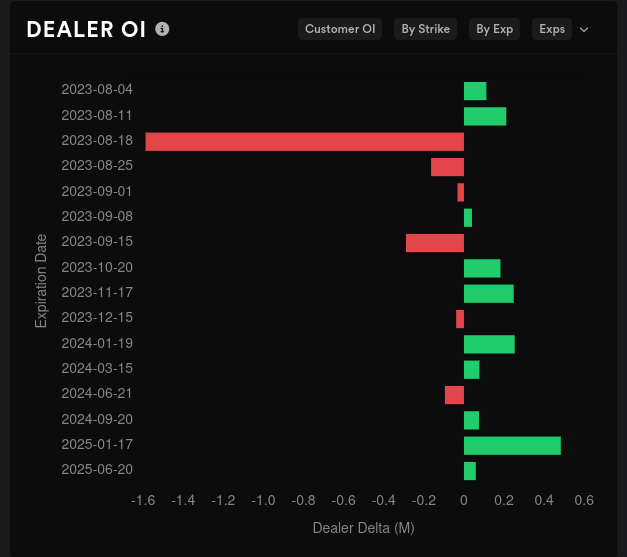
Can we use other data to tell us the chances of TSLA over $260? First off, dealers are long TSLA which suggest that market participants are bearish. That's not a great start.

What are we looking at as far as timeframes go? The first chart shows dealer open interest, which is the opposite of customer open interest. Red is bullish here and we see most of that bullishness piled up after January 2024. In addition, most of the bullish vanna we are seeing is coming from a long-dated LEAPS expiry in 2025. 🤯
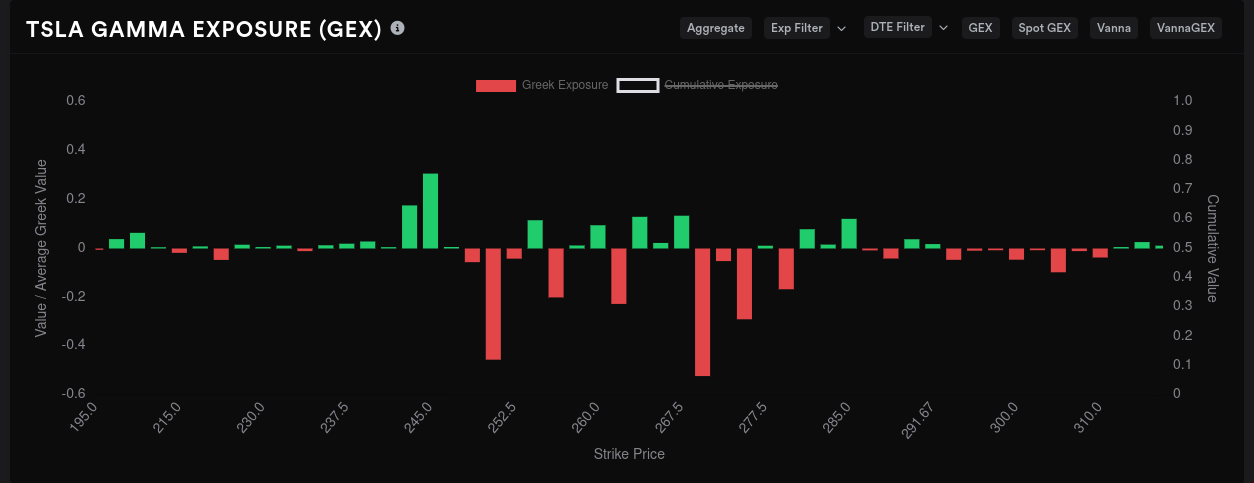
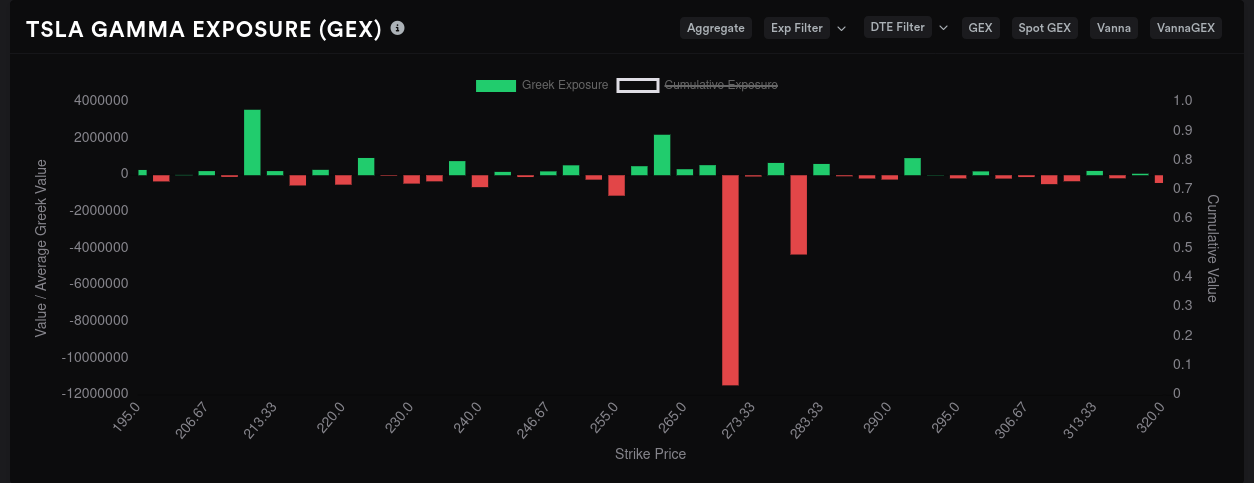
Okay, so lots of strikes against bullishness for TSLA in the short run thus far. What does gamma exposure tell us?
- The biggest price magnets are $250 and $270. Overall, the $270-$275 region has more negative gamma, so it might be the more likely target. Might.
- Price is bounded on the lower end by $240-$245. I have a support/resistance line drawn down there in my charts.
- We have some minor resistance about every $5-$10 from $255 to $267.50.
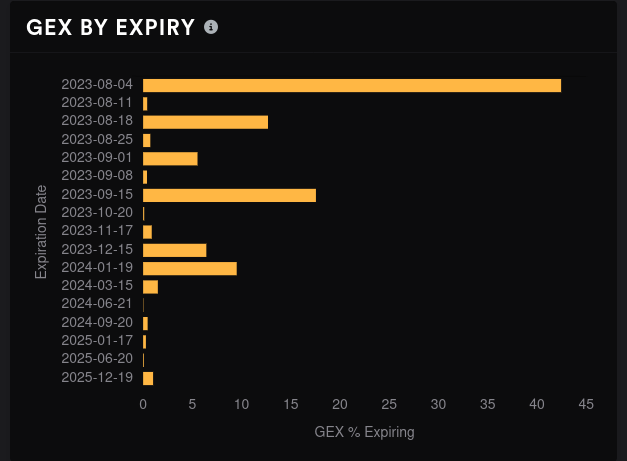
If we want to look at specific expiration dates for GEX, which ones are most impactful? We should have a look at 8/18 and 9/15 based on this chart.
The 8/18 GEX shows the biggest magnets for price at $270 and $290. There's nothing there that I see that would stop TSLA from running around in that range provided that it clears $265 with authority and holds that level.
If TSLA fails to hold $265, we're likely stuck in $257.50-$262.50 territory for a while.
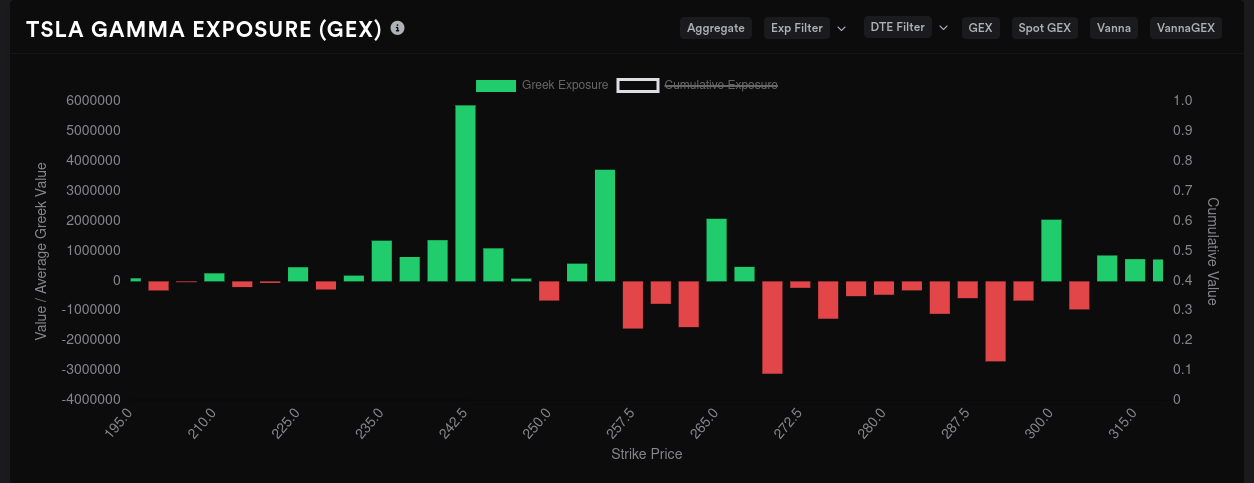
TSLA's 9/15 GEX shows a massive price magnet to $270 with a smaller one at $280. We have a little bit of resistance down at $260 and plenty at $210. I like seeing these big negative bars, but I wish there was more positive GEX here to better understand the boundaries for price. This will likely change as we get closer to 9/15.
Big money options traders are bullish on the $250 for 8/18 and the $280 for 9/15, so it seems like they're betting that we clear $260 and hold that level.
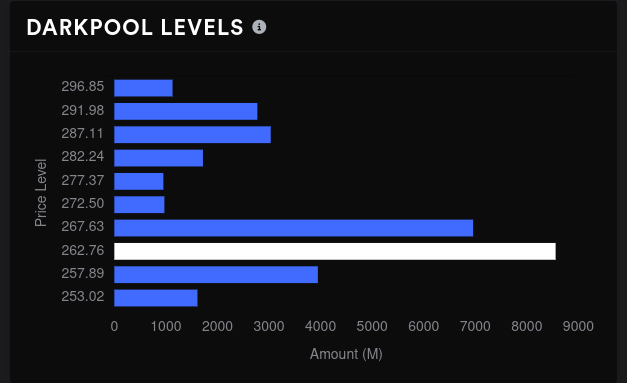
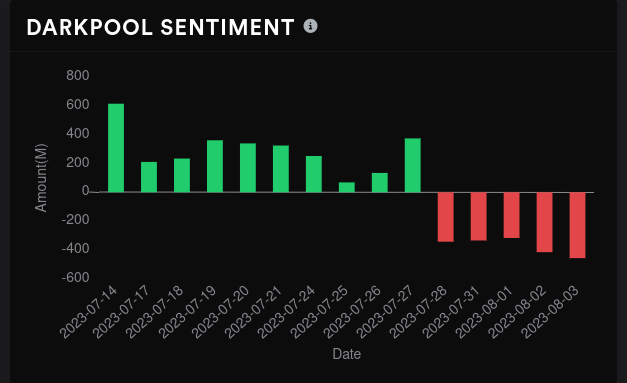
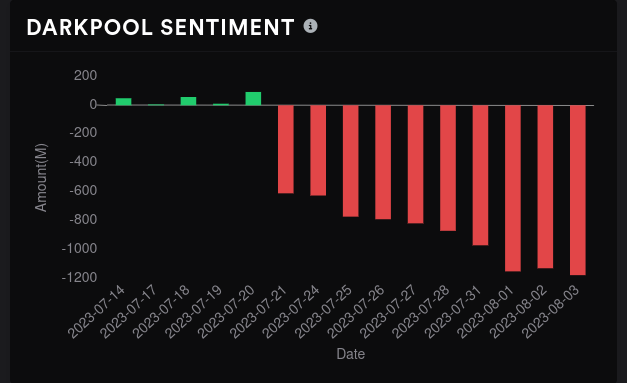
Dark pool data suggests we have good volume from about $258 to $268, so holding $260 seems fairly reasonable based on this data. Overall sentiment on these trades tipped bearish recently, though. This will be important to watch as TSLA loves retreating to dark pool levels in both directions.
AMD
I've beaten AMD to death with analysis this week and I'll just share some changes I noticed as the week progressed. AMD continues the bounce between $109 and $115 with another good test yesterday. Not every day is like this, but it's amazing when you do your homework, label your charts, and the price action follows your prediction almost perfectly:

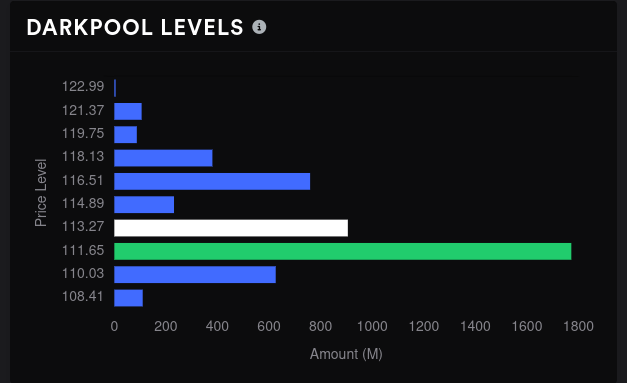
Dark pool levels have been quietly sneaking upwards bit by bit this week since earnings and they're still going. Last week, our biggest level was around $110, but that big level of nearly $1.8B has remained and has slowly crept up to the upper $111's. The $113 level also built out yesterday without taking any volume from the big $111 level.
I like this movement because it shows again that AMD is building a solid base with this consolidation, potentially for another move up. Remember, NVDA earnings are approaching and there may be bets happening on AMD based on what people think NVDA might be releasing.
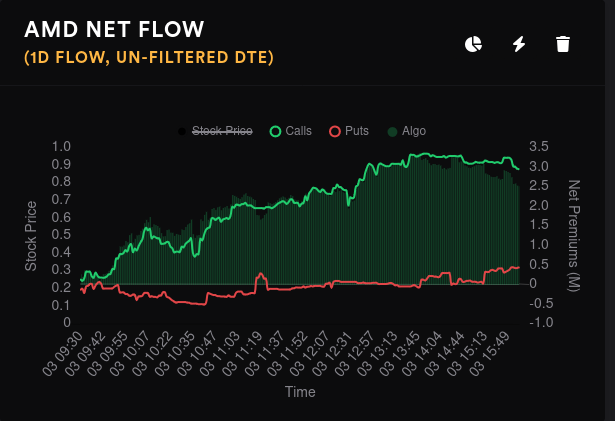
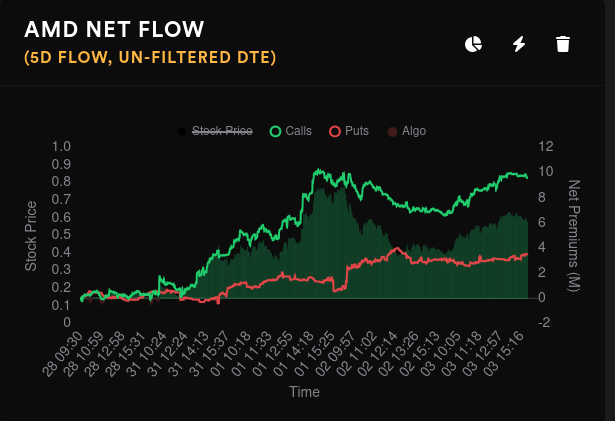
Net flow was strong on the bullish side yesterday, but puts have been on a steady march this week, too.
AMD's aggregate vanna shows some pull up to $120, not much past there.

Bullish vanna shows up most for 8/18 and later in the fall. Bearish vanna shows up on 9/15.
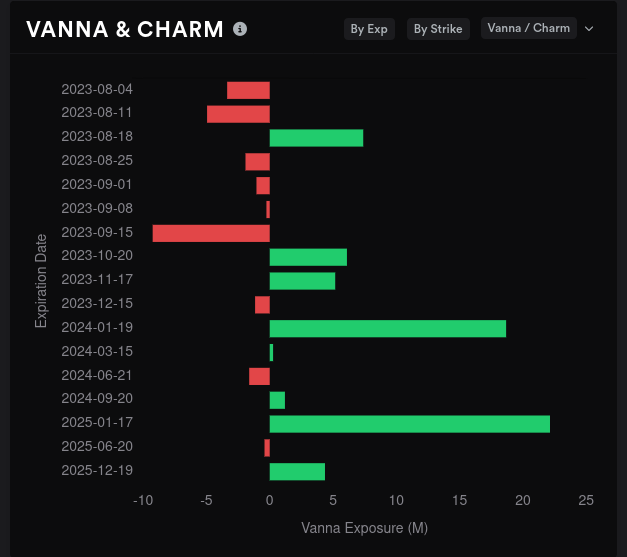
Again, the expiry I'm most excited about is 8/18 since we have some room to run up to the price magnet at $120:
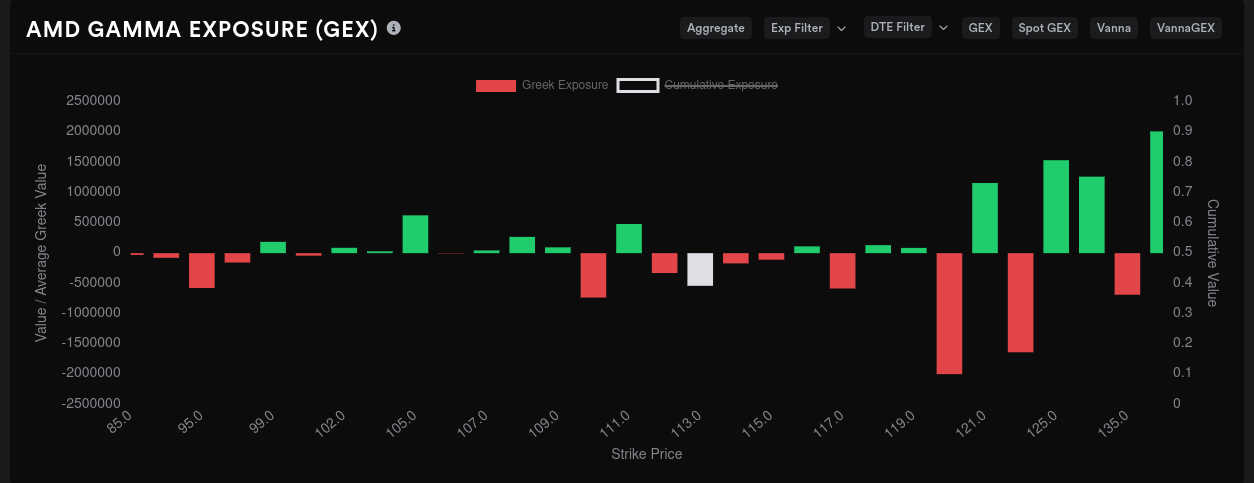
But AMD's 9/15 expiry looks like a move back down to $115 potentially and $120 becomes resistance.

Big money options traders love the $117 strike for 8/18, but that bullishness dries up for 9/15. Big money traders made some big bets for $90 on 9/15. That seems a bit drastic, but let's see how this plays out. This could be a proxy bet on NVDA earnings, so watch out for that.
Thesis
TSLA sure does have a lot of mixed data. Vanna suggests we might get a push to the $260s and hold it. Dark pool data suggests we have volume there to help with that. The 9/15 expiration opens the door to some wider price movement, likely to $280 but possibly to $290, but TSLA will need some serious volume to help it reach those levels.
I like $245-$250 as a good level for selling puts through 9/15 and I've sold a 8/18 $250 put. I also sold a $270 and $280 call for 8/18 since I doubt we top out above those levels before then.
As for AMD, the wall comes down and allows a move to potentially $120 for 8/18, but it appears we might get pushed back down to the $110-$115 range as we head to 9/15. You might grumble about this, but it's been an incredibly easy range to trade lately and pick up some good profits. 😉
I'm looking to trim my AMD holdings as we go into 8/18, so I will likely sell some more aggressive covered calls around the $120 strike for 8/18 when AMD's price approaches $115 again. If it clears $115, I'll keep selling $120's until all my long shares are covered.
Good luck to everyone out there today. 🍀 Have a great weekend, too!
As always, my trades and trade notes are on my Theta Gang profile.
Discussion