Hunting interesting trades at big volume levels

Volume bars are helpful, but what if you flip them on their side and sort your volume by price? Let's dig into some charts from Volume Leaders and build a plan for turning points.

It's been a while! Work has been wild as we launched a new product and finishing the school year is always a little crazy. I've been working hard lately to simplify my trading strategy down to the bare bones. More on that later.
Today's post will be a deep dive into how big institutional trading levels can give you some clues about turning points in your favorite stocks. But first:
All investments come with significant risks, including the loss of all capital. Please do your own research before investing, and never risk more than you are willing to lose. I hold no certifications or registrations with any financial entity.
Let's get into some nerdy data.
Institutions, you say?
Lots of market strategies are hunting for signs where institutions are making their bets. If you've done any studying of Investor's Business Daily (IBD) or Inner Circle Trading (ICT), these strategies are based on picking out where big institutional investors are going long or pulling back on bullish trades.
I get a lot of this data from Volume Leaders since it presents the data in really interesting ways. You can see big individual trades and where they occurred, but you can also see interesting levels where big trades were made over longer periods.
There are tons of examples where stocks will get lots of institutional attention, go on a wild rally, pull back, and the institutions come back again. They love their levels. As with anything in the market, this isn't guaranteed.
Turning points on ADSK
Sometimes a stock will reach a turning point where it received plenty of attention in the past. As an example, here's ADSK:
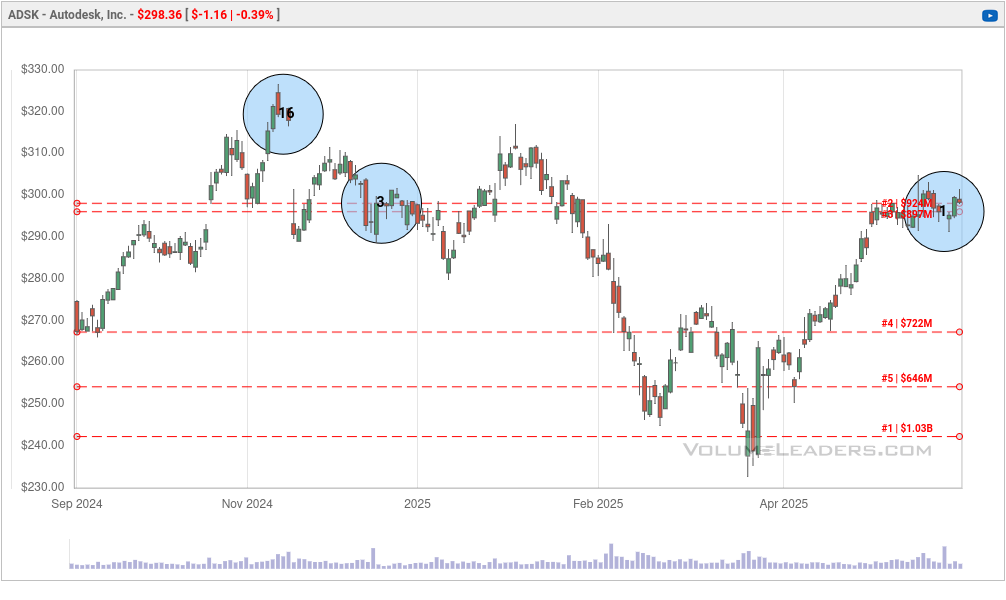
The blue circles show ranked trades. A #3 trade is the third biggest ever made in the history of the stock. A #1 is the biggest. You can see how ADSK has received plenty of attention around $290-$300 for a while, including a #3 and #1 trade. The horizontal red lines highlight trade levels where multiple trades over time have added up to make an interesting level.
Note how ADSK's price reacted during the drops. Price got stuck on the #4 and #5 level in both directions and it caught a bounce on the #1 level. These are ranked levels, so the #1 trade is the biggest level on the stock right now (within the time window we are looking at now).
Let's zoom into ADSK since right before that #3 trade in December:

A #1 trade recently came through on the same level as a #3 and price is sitting on the #2/#3 levels just under $300. Big round numbers like these can sometimes become a cap on price movement or they can be the springboard for the next move.
ADSK had an almost textbook double bottom pattern recently where the second leg was lower than the first. That's a really bullish sign since it cleared out more of the sellers on the second run. Price now sits at a turning point, but it tried to dip below the #1 trade and was pulled back up. This could be a great one to watch to see which way it breaks.
Possible bottom for ANF?
Another example is ANF. If you know your markets from the past couple of years, ANF went on an incredible bull run and then got stuck in a multi-month consolidation before a drawdown:
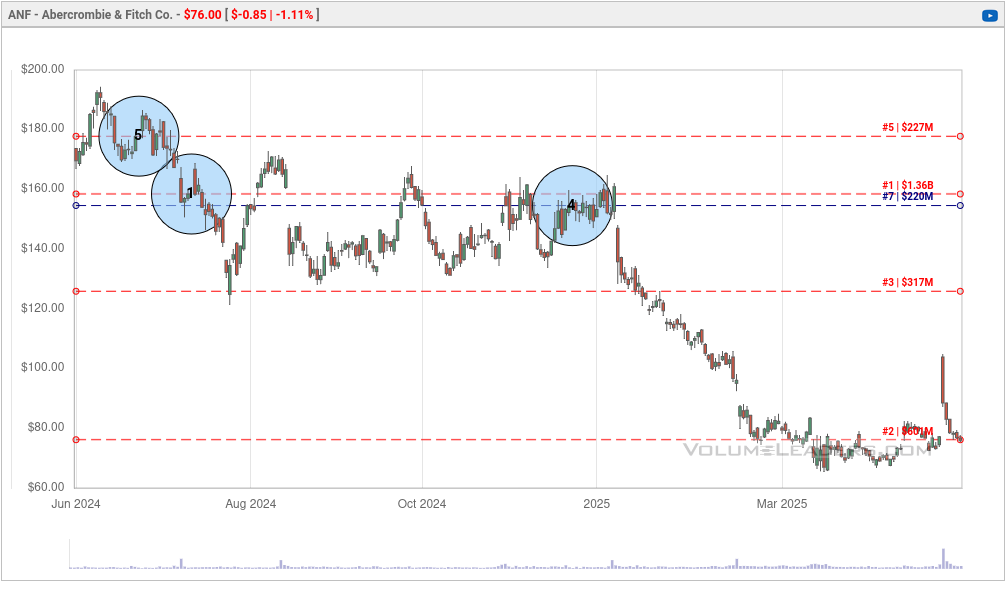
But where is price now? It settled down right on the #2 most traded level. There was a strange earnings gap up recently and price went right back to the same spot. Something is special about this level around $76.20.
How do things look if we zoom down into March 2025?
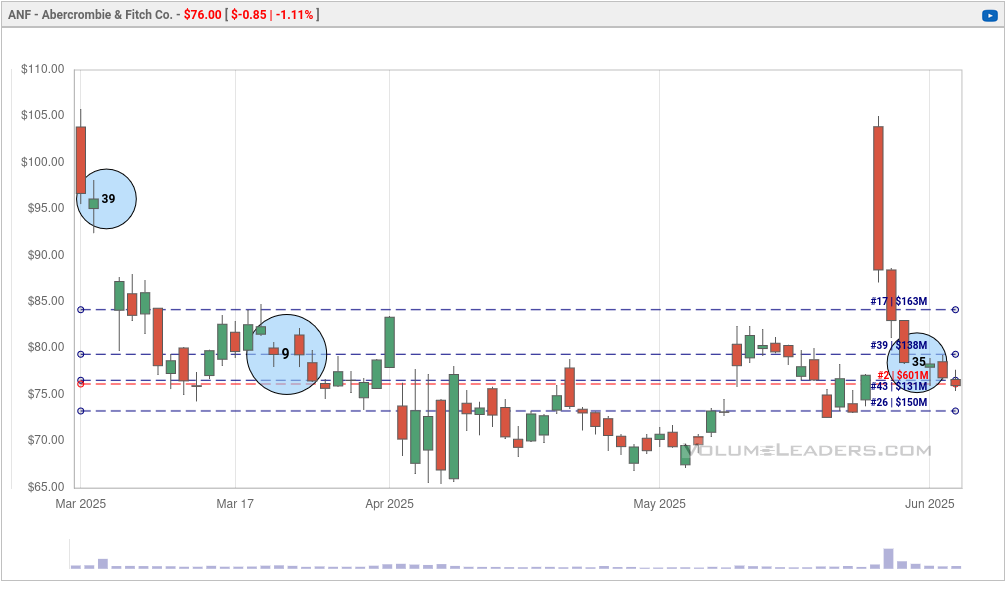
The #2 level is the red line on the chart here and there's a #9 trade just above the current price level. If ANF can retake $76.20, we might see a potential run to the #1 trade around $160.
Your next question might be: Okay, what's so special about this #2 level? Why do traders seem to care about it so much? We need to zoom out for that:

Wow! 🤯 This was a level that was absolutely blasted back in 2006 and price consolidated before a downturn in 2008. Price tried to retake the level in 2011 and failed. It never came to that level again until November 2023! If ANF is going to make a stand, it needs to do it here. This is another one I'm watching.
Lots of levels for MSTR
Trading MSTR is like riding a snake, but price is sitting near some interesting levels today:
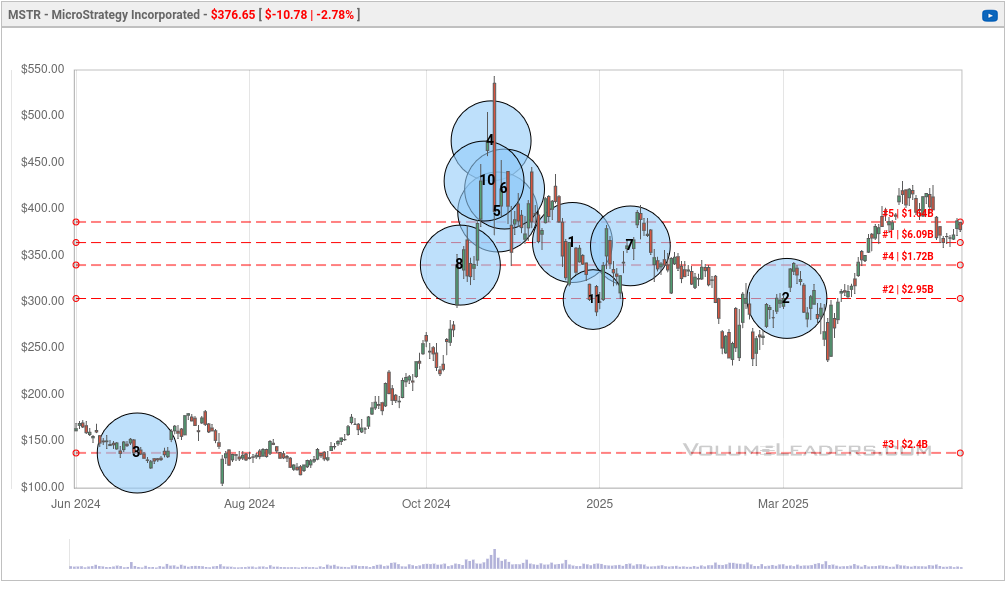
There are four big levels sitting near the current price, including the #1 level. This is pretty messy, so let's zoom in to start around November 2024:
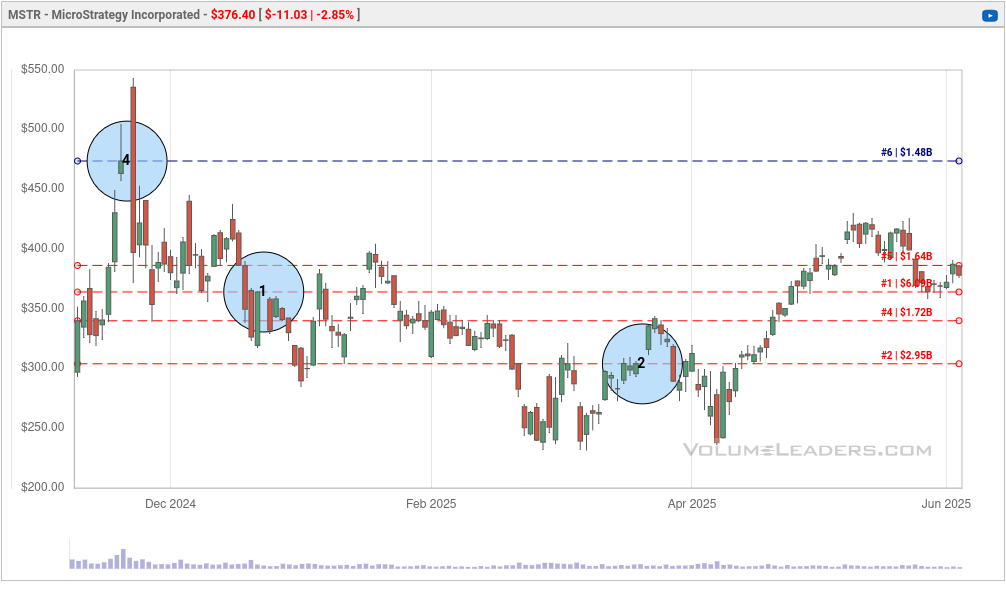
Note how price bounced on the #1 level recently and began making a move up. Price action was messy in 2024 with an ugly double-bottom followed by another downturn and then a rally. Price ran off above the #5 level but pulled back in.
Zooming into April shows a bit more of the move:
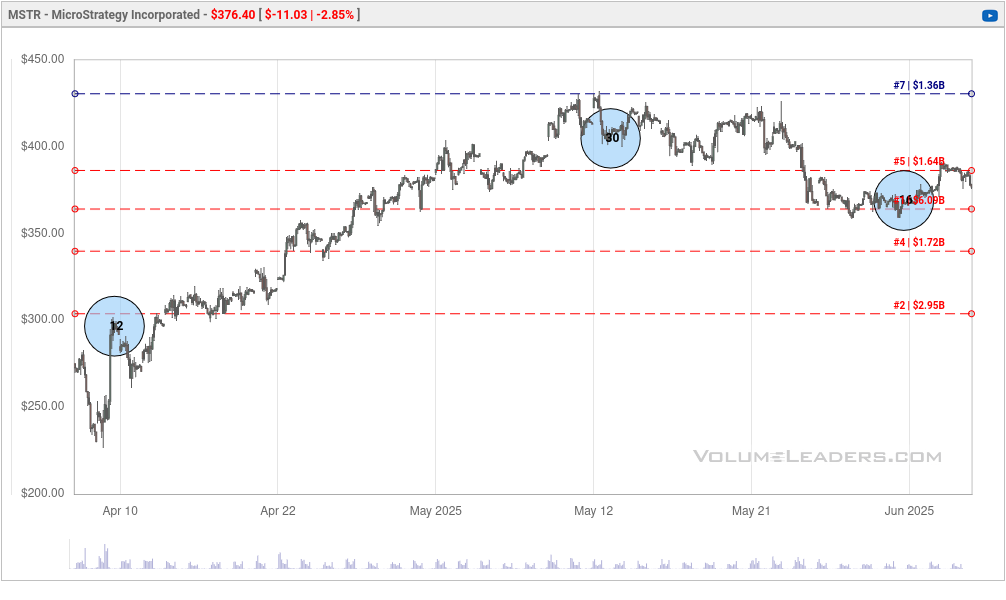
Price rolled through level after level until it hit the #7 level and began to fall back to the #1 most traded level. If MSTR can climb over the #5 level around $386.40, we might see another run higher.
Making waves with PLTR
You need to use some caution with all the levels you see, because sometimes they show up right in the middle of clear skies at all time highs. Here's an example with PLTR:
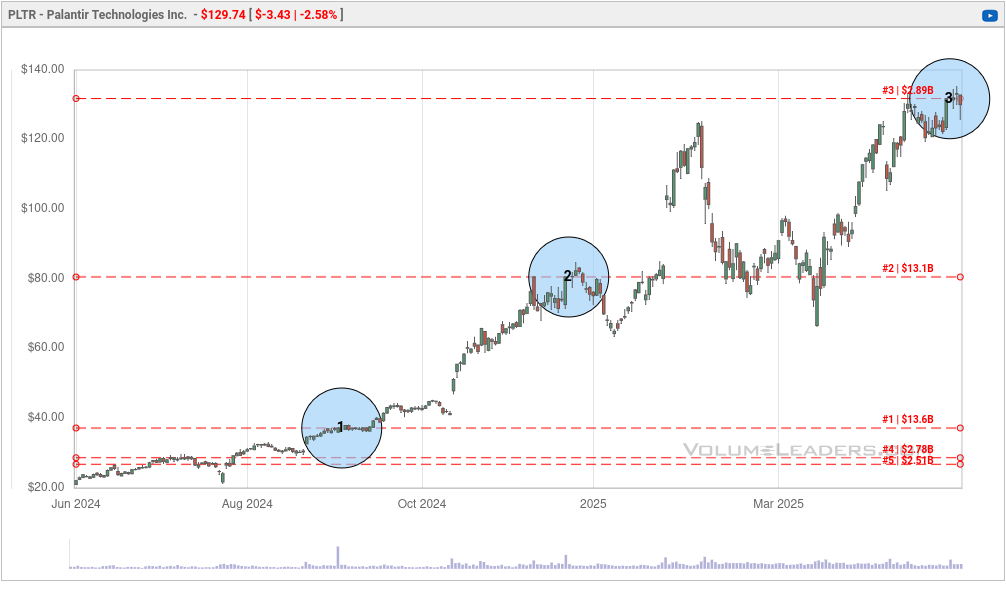
Your first instinct might be to say "Oh PLTR got stuck on the #3 level!" However, it's very likely that the #3 level formed with the big #3 trade on May 30th. In these situations, I like to look backwards and see how price reacted at previous big levels.
Note the #1 circle towards the left. Price got stuck there for a while before slowly lifting off the level and eventually gapping up. That's an excellent sign. We don't want to see a #1 level cut through aggressively.
The #2 circle was a different ball game. Note how price retreated back aggressively, then gapped up and fell right back down. That's not the price action we want. However, that led to a double bottom and another rally to a new level.
So the question now is: How will price react around #3? I have no idea, but let's zoom in to see what happened since that big rally after #2:
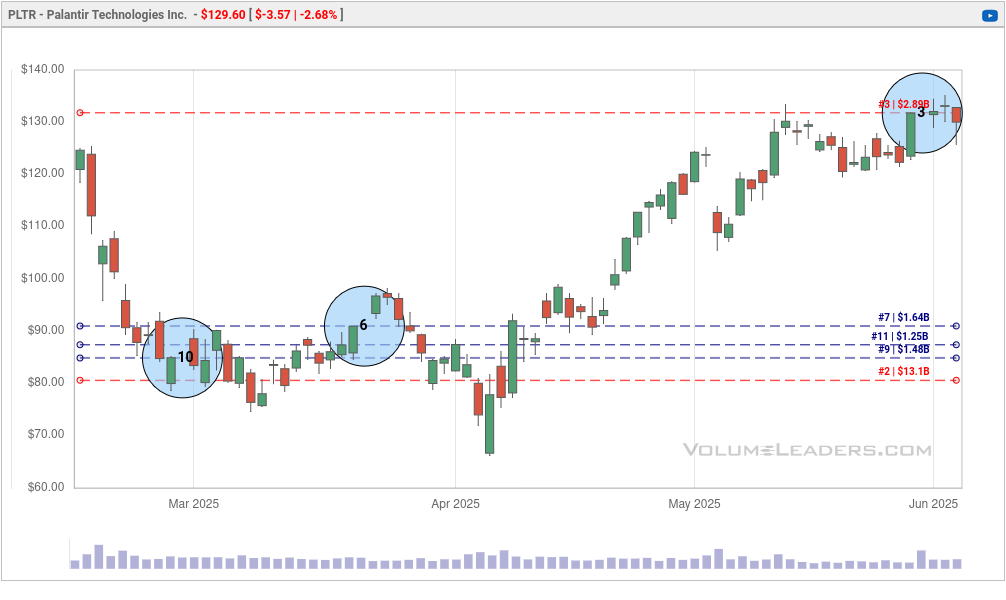
Late February was a rough time for tech stocks. That's when Deepseek hit the news and everyone was spooked. What happened with price?
The 10th biggest trade was made just above the #2 level and then we got another #6 trade slightly higher. The tariff war sent the price back down below the #2 level, but then it retook the levels, retested a little in April and ran to all time highs in May.
I can't predict the future, but I can be ready for it. I'd like to see PLTR do something similar to what it did after the #2 trade where it consolidated, picked up some additional trades, flushed the sellers, and ran to new highs. There's no guarantee that this move will look the same.
Summary
Using the volume by price indicator gets you a fairly good picture of where the most volume is on a chart, but I really like how Volume Leaders makes it crystal clear. Whenever you see these levels, start to ask yourself:
- What did price do around these levels the last time?
- Are there any obvious chart patterns (cup/handle, double bottom/top, etc) nearby that might give me a slight edge to make a trade?
- Is there a reason why the stock is at an inflection point? Think about recent news for the stock and its industry.
- What move will I make based on the trend I see from here? Be aware that the market loves fakeouts and shakeouts. 😉
Good luck to you this week! 🍀
Discussion