Interesting volume on HOOD

HOOD popped up with some interesting volume towards the end of the week and it's at quite a crossroads after coming down from the highs. Let's identify some levels for potential trades. 📊

Hey there! I was working through my weekly screens in Volume Leaders and came across some interesting volume and price action on Robinhood this week. My favorite scan on Volume Leaders is this one:
- Include trades from the previous week (but I excluded Friday from my screen since the OPEX days are really, really wild)
- Must be a trade ranked #5 or higher (5th biggest trade ever made or better) and a relative size (to the average trade size) of 5x or more.
Before we dig in:
All investments come with significant risks, including the loss of all capital. Please do your own research before investing, and never risk more than you are willing to lose. I hold no certifications or registrations with any financial entity.
Let's take a look at the data.
Big trades
I like seeing things in perspective first, so here's a one year chart for HOOD:
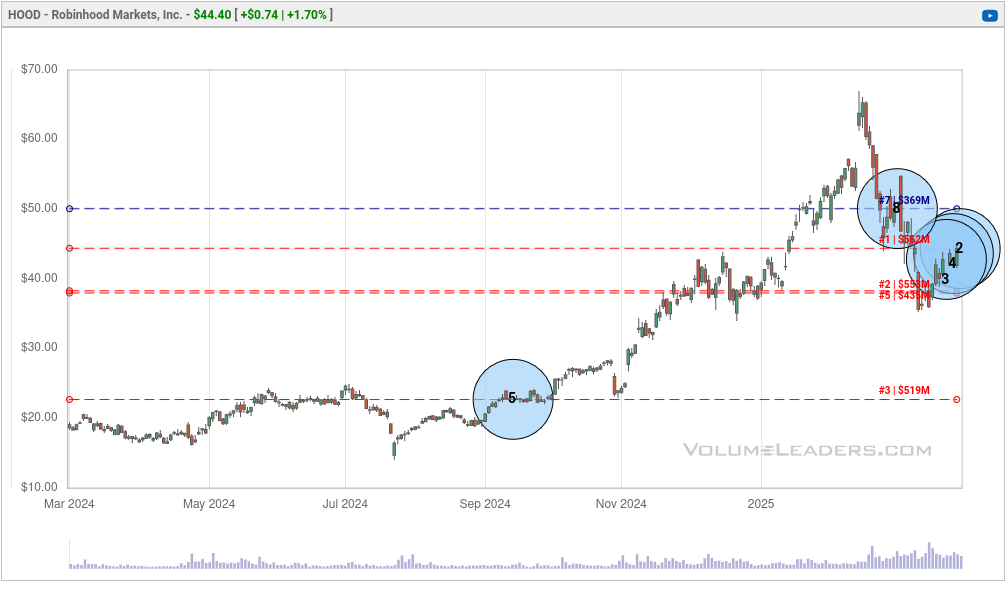
Four of the five biggest trades made in the past year were since the big climax top in February 2025. That includes three very large ones ranking #2 through #4. Note the red horizontal lines that highlight trade levels where large amounts of shares were traded. HOOD is getting very close to that #1 trade level.
Let's zoom into the chart starting with the most recent low of $35.23 on March 10th:
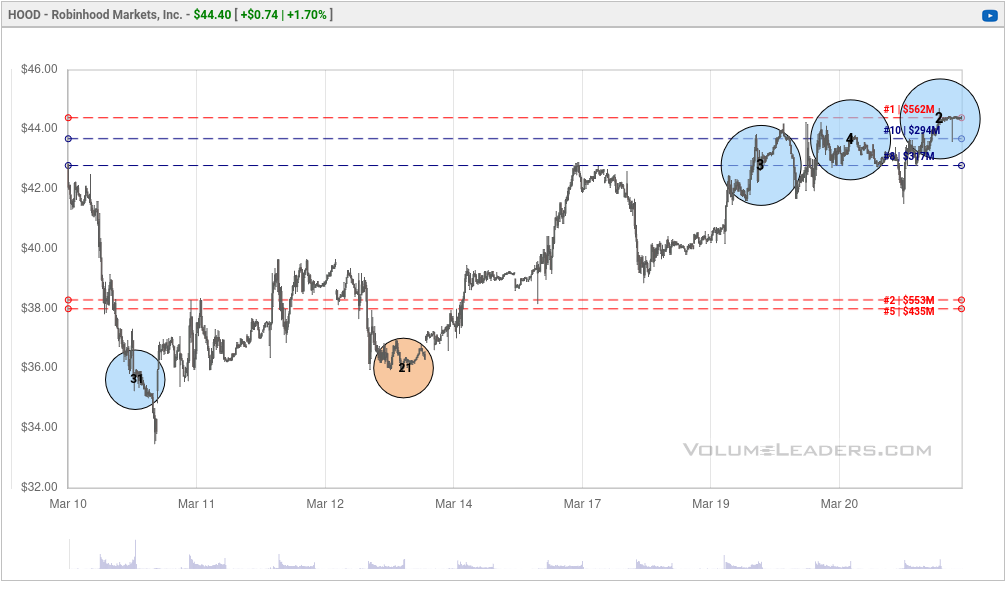
HOOD had no problem clearing the #2 and #5 volume levels, but will it do the same as it approaches the #1 level? The three most recent trades of the week are these:
- #3: 6.32M shares or $270M
- #4: 5.91M shares or $258M
- #2: 9.02M shares or $400M
Three days in a row of highly ranked trades is a little unusual, but we have to take Friday's #2 trade with a grain of salt since the OPEX date comes with a lot of volume shuffling around.
At this point, there are two possible outcomes floating around in my mind:
- Traders are looking at this big supply zone and thinking that HOOD might take another move down. These could be traders closing long positions or opening new shorts.
- Traders are betting on HOOD blasting through the supply zone with another breakout similar to the one from January, perhaps something more sustainable this time around. They could be covering shorts or adding to long positions.
We've got ANTS!
You can read more about ANTS in Deepvue's post, but they mark places where price moves and volume suggest that institutions are making moves in a particular stock. MarketSurge adds them as little black marks above the price bars.
In general, when you spot these, it's best to wait for a pullback afterwards to see if the level is defended. I tend to get shaken out of a trade when I jump into a stock right after the ANTS indicator appears.
Here's the chart from MarketSurge:
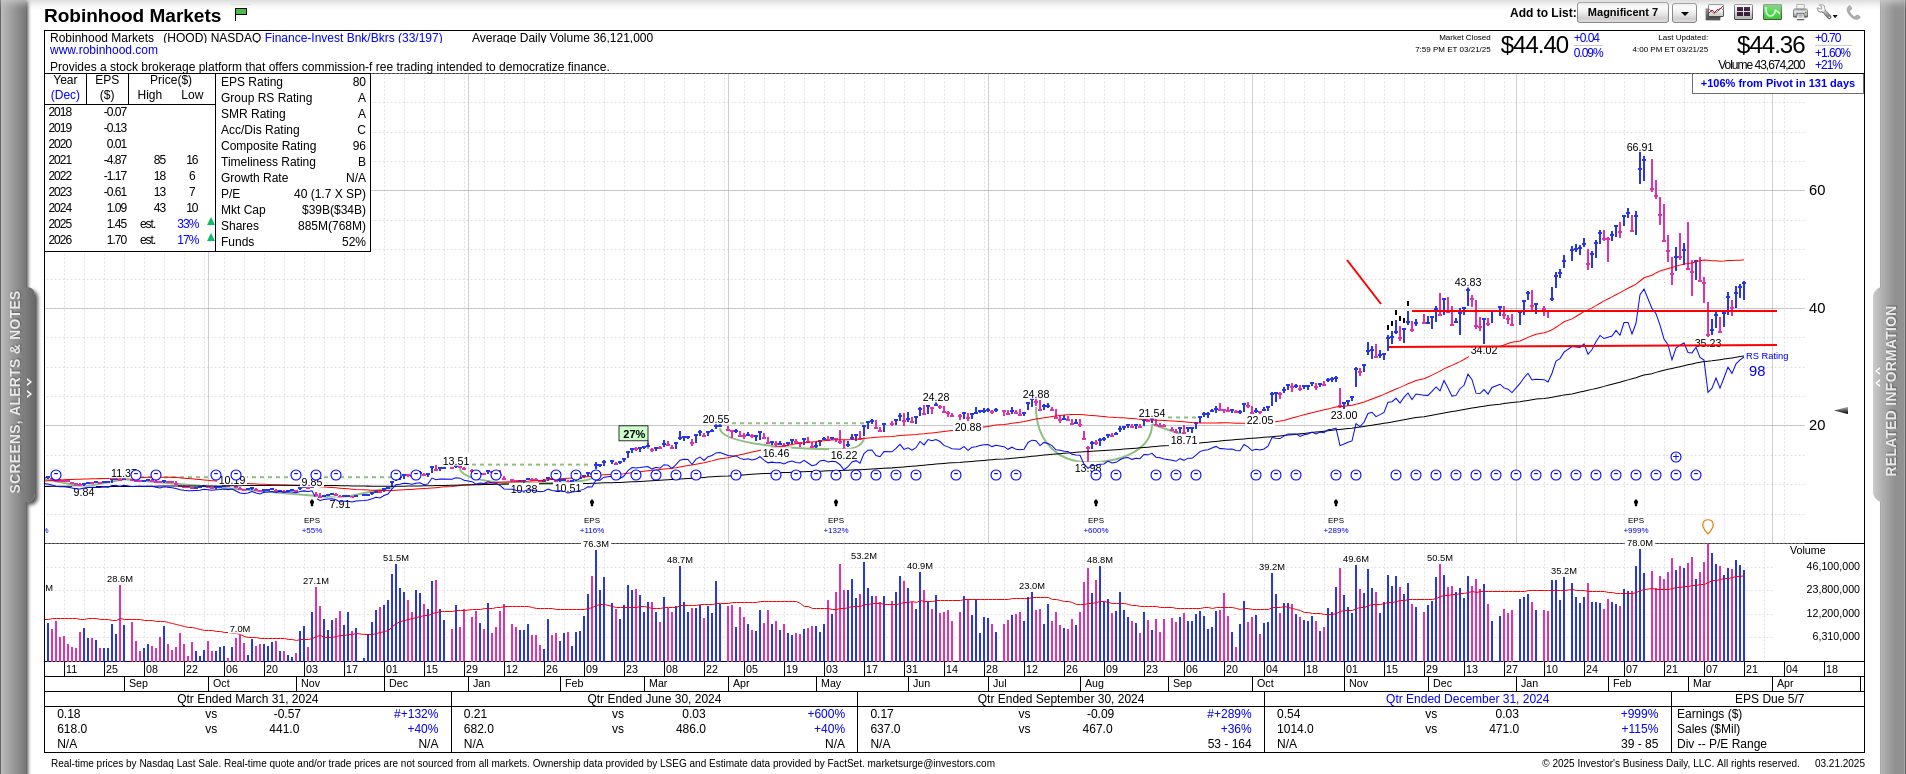
The ANTS indicators appeared while the price was moving from around $33-$40. I extended some lines to the right at the top and bottom of the ANTS indicators and it looks like the level has been defended to some extend. Price is now above the levels of the ANTS indicators.
There's one other thing to notice here. If you look at the last six days of trading in HOOD, the closing price is higher on five of those days:
That suggests to me that although bulls and bears are fighting it out, the bulls might be winning. However, overall volume slid downwards slightly over the past three days, so that's a concern.
Insiders bought some shares on February 26th.
Stock chart
We've seen plenty of information already, but the relative strength for HOOD is interesting. Look at the bottom pane where HOOD performance is compared against SPX, its industry, and its sector:
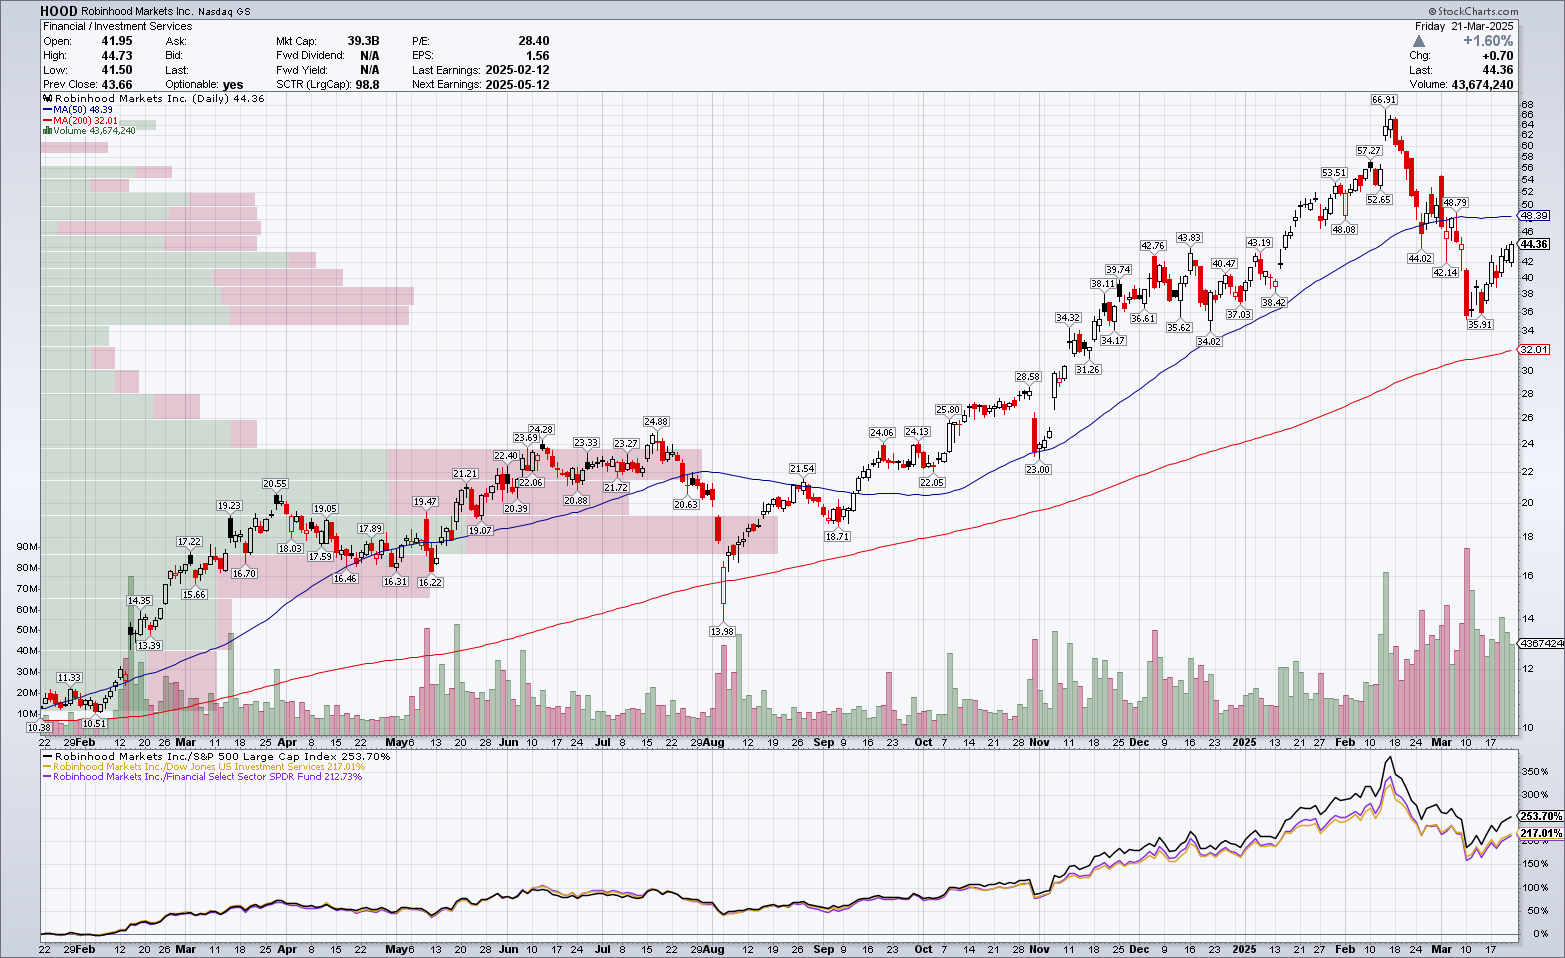
Something happened in November and HOOD started gaining more ground against the SPX index than its own sector and industry. This might not mean a lot here, but other brokerages, such as SCHW, TW, and IBKR have similar patterns on their relative strength charts.
Conclusion
Something interesting is happening with HOOD and we have some ingredients here for a potentially large move. Let's recap what we've seen:
- Higher closes five days of the last six
- Very large market on close trades three days in a row
- We're above the ANTS indicators now and above a fairly low volume zone
- HOOD is strong relative to SPX and its industry/sector
- HOOD closed above the consolidation zone that formed before the big climax top
These large volume single trades rarely disappoint, especially those that rank in the top five. I'm interested in potentially going long on HOOD soon, but I'd like to see how it reacts around this overhead supply from $45-$50. The 50 day moving average sits around $48.39 as of this weekend and HOOD needs to make a strong move there.
There's a potential that HOOD taps the 50MA and retreats down a bit to retest the low. That could make a double bottom pattern and open the door for a higher probability of a bullish move.
As for me, I don't have any positions in any stocks right now, including HOOD. Nearly everything I have is in cash or short term treasury bills (via the SGOV ETF).
Good luck to everyone this week! 🍀
Discussion