It's about time that we talk about SMCI

Yes, let's dive into SMCI's data and see where the risk lies for this stock that is on an incredible run. 👟

Happy Thursday! Yesterday was busy with some wild trading around the FOMC press conference and the possibility of a March rate cut (or lack of one). But something else has caught my eye recently: Supermicro, or SMCI.
This stock has flown from $275 to the $550's in the span of a month after they offered pre-earnings guidance saying that their profit would be higher than expected. The earnings call was great and they guided higher there as well.
I have used plenty of SMCI products in the past and I have two in my house now. They build everything from edge devices and workstations up to massive machines that can house 8+ NVIDIA GPUs with some of the fastest interconnections available. If you're doing AI/ML workloads on premises, then Supermicro has some of the best hardware products out there. They also avoid being encumbered with a consumer business (laptops, desktops, etc) like Dell or HP.
All investments come with significant risks, including the loss of all capital. Please do your own research before investing, and never risk more than you are willing to lose. I hold no certifications or registrations with any financial entity.
Let's see where SMCI might go from here. 🤔
Long term
The weekly chart since the COVID lows is simply staggering:
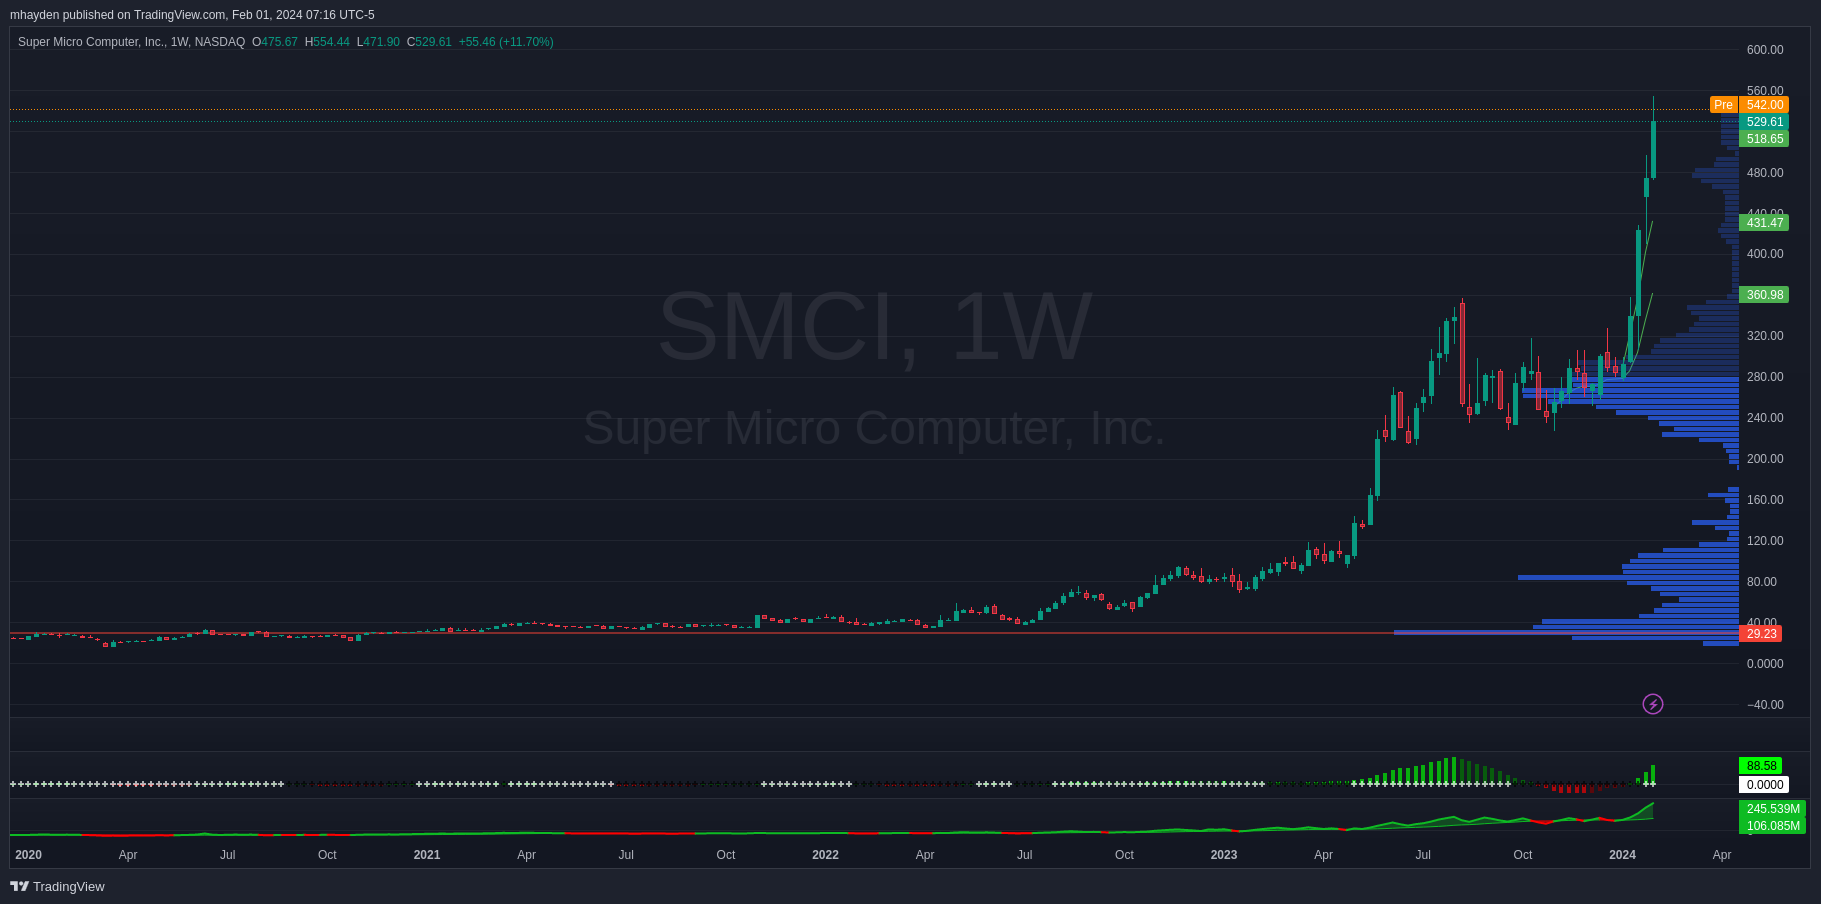
The majority of the volume sits at $29, but there's a massive volume wall up around $265 that built out through much of the summer and fall of 2023. This chart has changed so much recently that the long term view doesn't help too much.
Since last earnings
SMCI reported on January 29th, so let's roll back to the previous earnings call and take a slightly wider view. This chart starts on November 1, 2023:
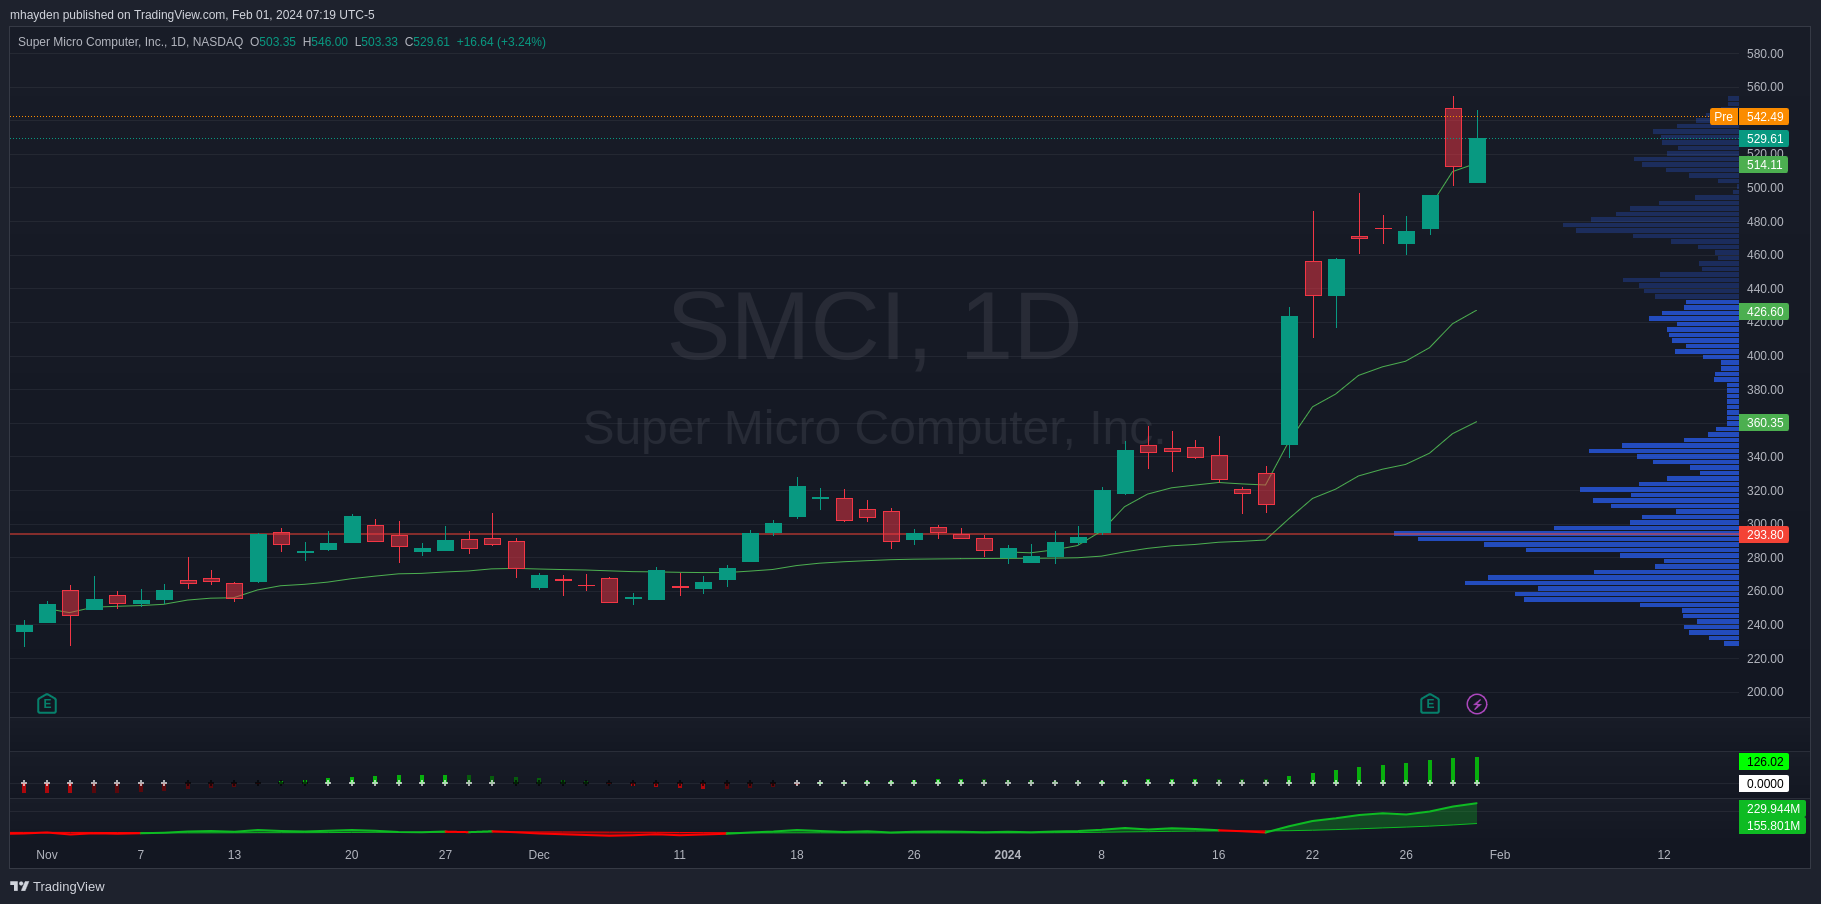
First off, we have the heaviest volume at $294, but there's another large pocket around $480. We have some low volume pockets scattered around $500, $460, and $360-$400. I see these as potential support levels since price should gravitate more often to the areas of higher liquidity. These weren't from gaps, but they were from single day candles where price made some significant moves in one day.
You'll see three green VWAP lines on the chart. Two are from the most recent earnings calls and there's another from January 1st. All three of these are trending upwards and price is well above the YTD and November earnings VWAP lines.
Everything I can see in this chart tells me that SMCI has some serious strength behind it. Yes, the price action likely needs a breather with some more consolidation, but I would not like to step out in front of this freight train with a bearish trade right now.
Institutional trades
Volume Leaders tracks big trades likely made by institutions on various stocks and ETFs. This tool doesn't give us the direction or sentiment of the trade, but it tells us when institutions made a big trade, how big it was, and the price when they traded it. It also tells us whether the trades were made on a lit exchange (blue circles) or in dark pools (orange circles).
Let's start with SMCI since the November earnings call:
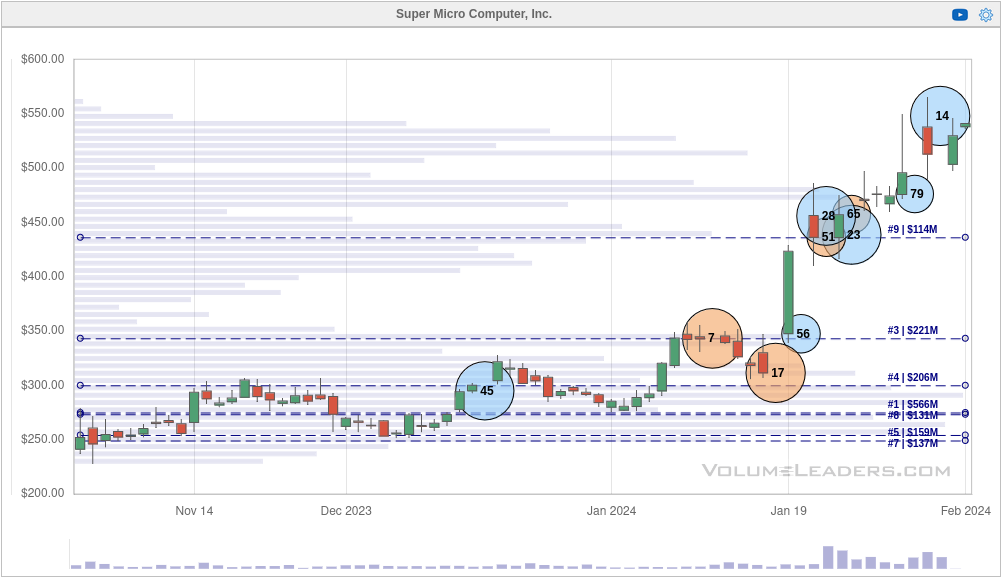
The #1 level is $275.10 and most of the top levels are packed tightly around that area. $250-$350 was a busy zone for institutions trading SMCI. There are quite a few large trades recently with the 14th biggest trade ever on January 30. That was around 130K shares at $547.97.
Let's zoom in a bit and see if we can pick out some trends after the massive green candle on January 19th:
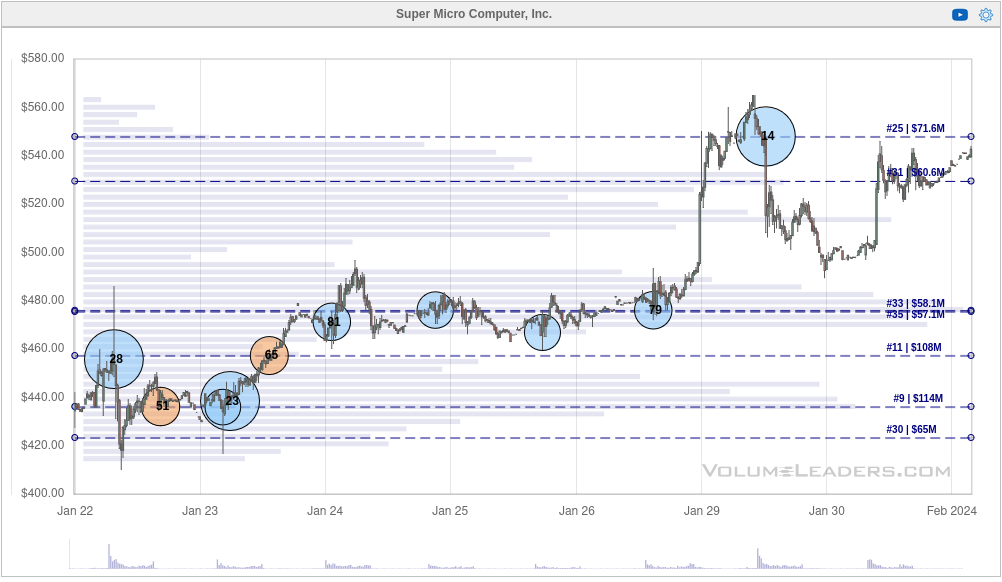
I love seeing a zone on a chart where institutions are quietly trading in a consolidation area before a big change in price. Notice those small circles around $475. These are areas where institutions try to quietly build or reduce positions in a particular stock without the market noticing. This happened a little around $440 as well.
The run to $550 seemed weak and someone made the 14th largest trade just before SMCI fell to about $500. There hasn't been much institutional trading since then.
Let's crunch the chart down to the last seven days:
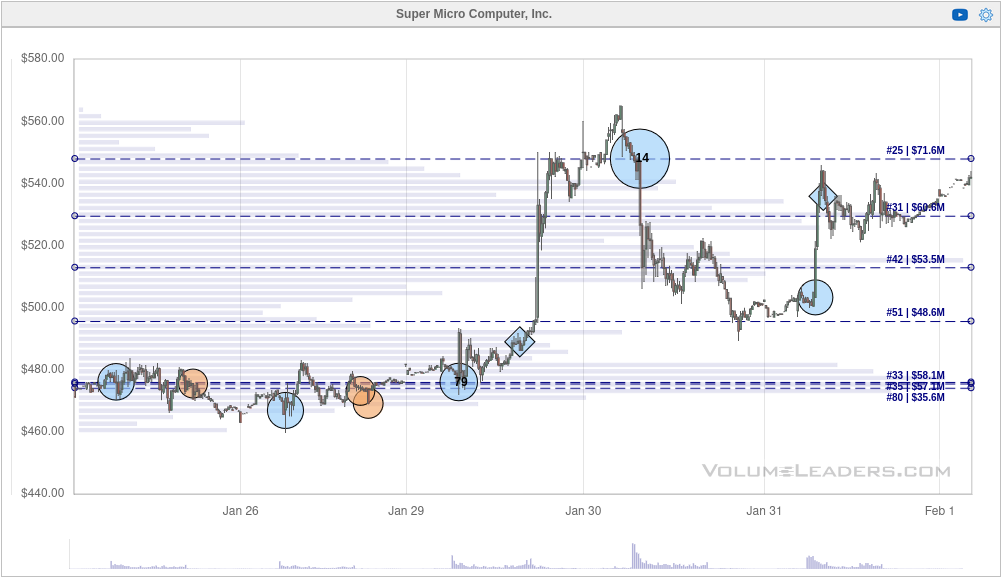
Starting from the left, institutions were making trades while SMCI consolidated. Then we had that big run to $550 and someone likely took some profits just below the highs. Someone got in with a great trade yesterday around 10:30 AM before SMCI ran from $500 to $540. 👏
All of this data leads me to think that institutions are betting on $480 to hold in the short term.
Thesis
Has SMCI been on an absolutely incredible run? Yes.
Would I love to see SMCI get a breather and consolidate somewhere around $500-$550? Absolutely.
I've seen lots of people on X/Twitter and in Discords argue that we should be shorting SMCI because there's no way this price action is sustainable. That's certainly a valid argument, but it's tough to take a trade like that with confidence when the chart looks like it does. If there's a train barreling down the tracks towards you, would you rather get in front of it or hop on for a ride?
I'm reminded of this quote:

I've been layering into short puts on SMCI since the IV remains quite high and I'd like a little downside protection over owning the stock outright. I've sold puts on the $10 levels from $430-$460. My break even points range from about $446 down to $418.
My goal is to keep these on until I hit 50% gains or SMCI shows me signs of weakness. Weakness would include falling through a VWAP or losing a critical level like $480.
Good luck to everyone this week! 🍀
Discussion