January 24 AAPL analysis 🍎

AAPL earnings are coming up on February 1. What is the recent price action saying about the risk through earnings? 📈

Good morning! I'm usually a short put seller and I look for names with higher implied volatility, so AAPL isn't usually on my list. However, earnings are coming up on February 1 and that gives AAPL's puts enough juice (sorry, I had to) for some short options trades.
All investments come with significant risks, including the loss of all capital. Please do your own research before investing, and never risk more than you are willing to lose. I hold no certifications or registrations with any financial entity.
Let's dig into the data.
Long term
The "zoom out" reminder is a good one here with AAPL. If we zoom out on a monthly chart to the beginning of AAPL's bull run in 2003, it's incredible how far the stock has climbed:
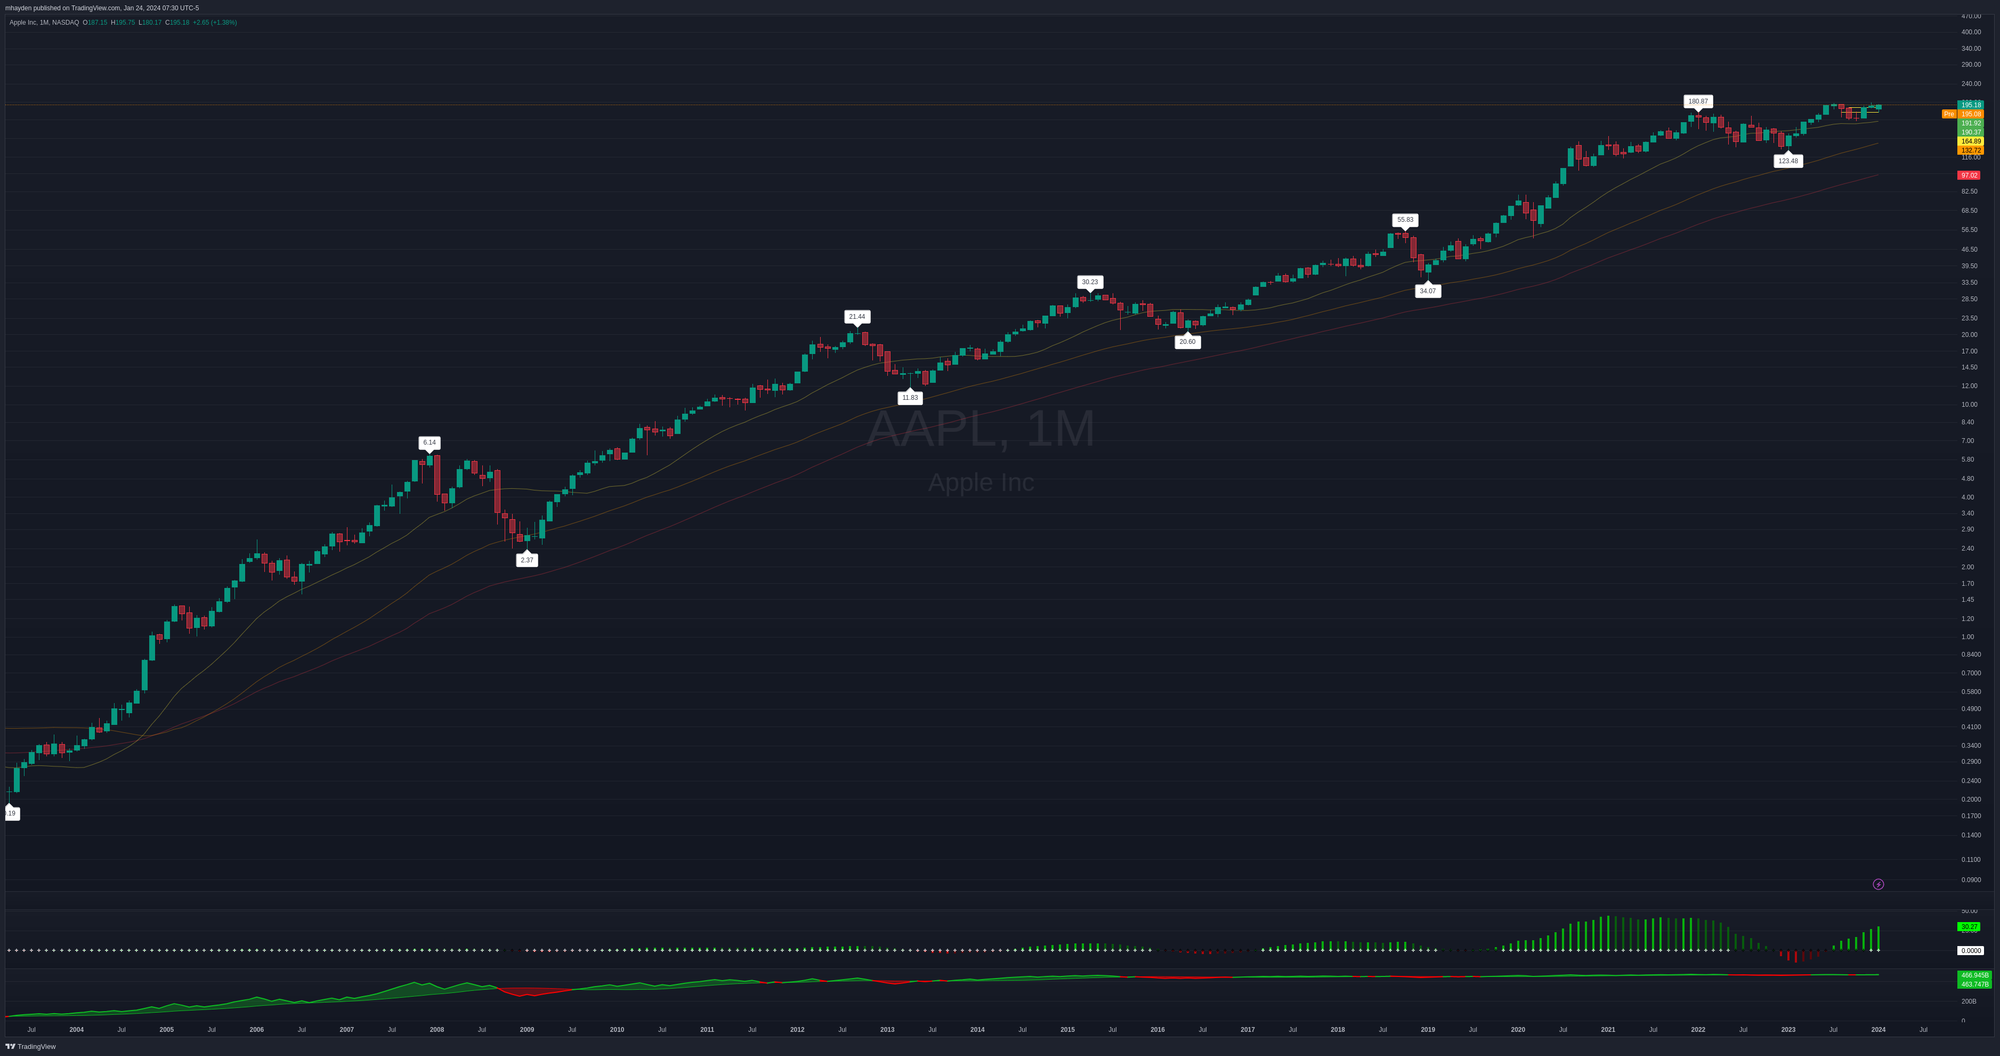
It tapped various moving averages along the way but rarely ever dipped below a 55-month moving average (orange line above). Both the OBV and TTM Squeeze indicators note that volume supports the current upwards move and volatility is ready to help us squeeze a bit higher.
Since last earnings
I really like examining daily or 195m (~4h) charts since the last earnings call with a VWAP line applied. The 195m chart below has two green VWAP lines: one from the last earnings call on November 2, 2023 and the other starts on the first trading day of 2024.
AAPL dipped under both VWAPs and then climbed back out of the lows relatively quickly. It was in a battle with MSFT for the highest market cap in the S&P 500 and it reclaimed the top spot recently.
The majority of the volume centers around $189.68 and you'll find 70% of AAPL's volume since the last earnings between $184 and $197. Volume supports the most recent move and AAPL is approaching a lower volume level above $195 now that might prove to be resistance without additional buyers coming to help.
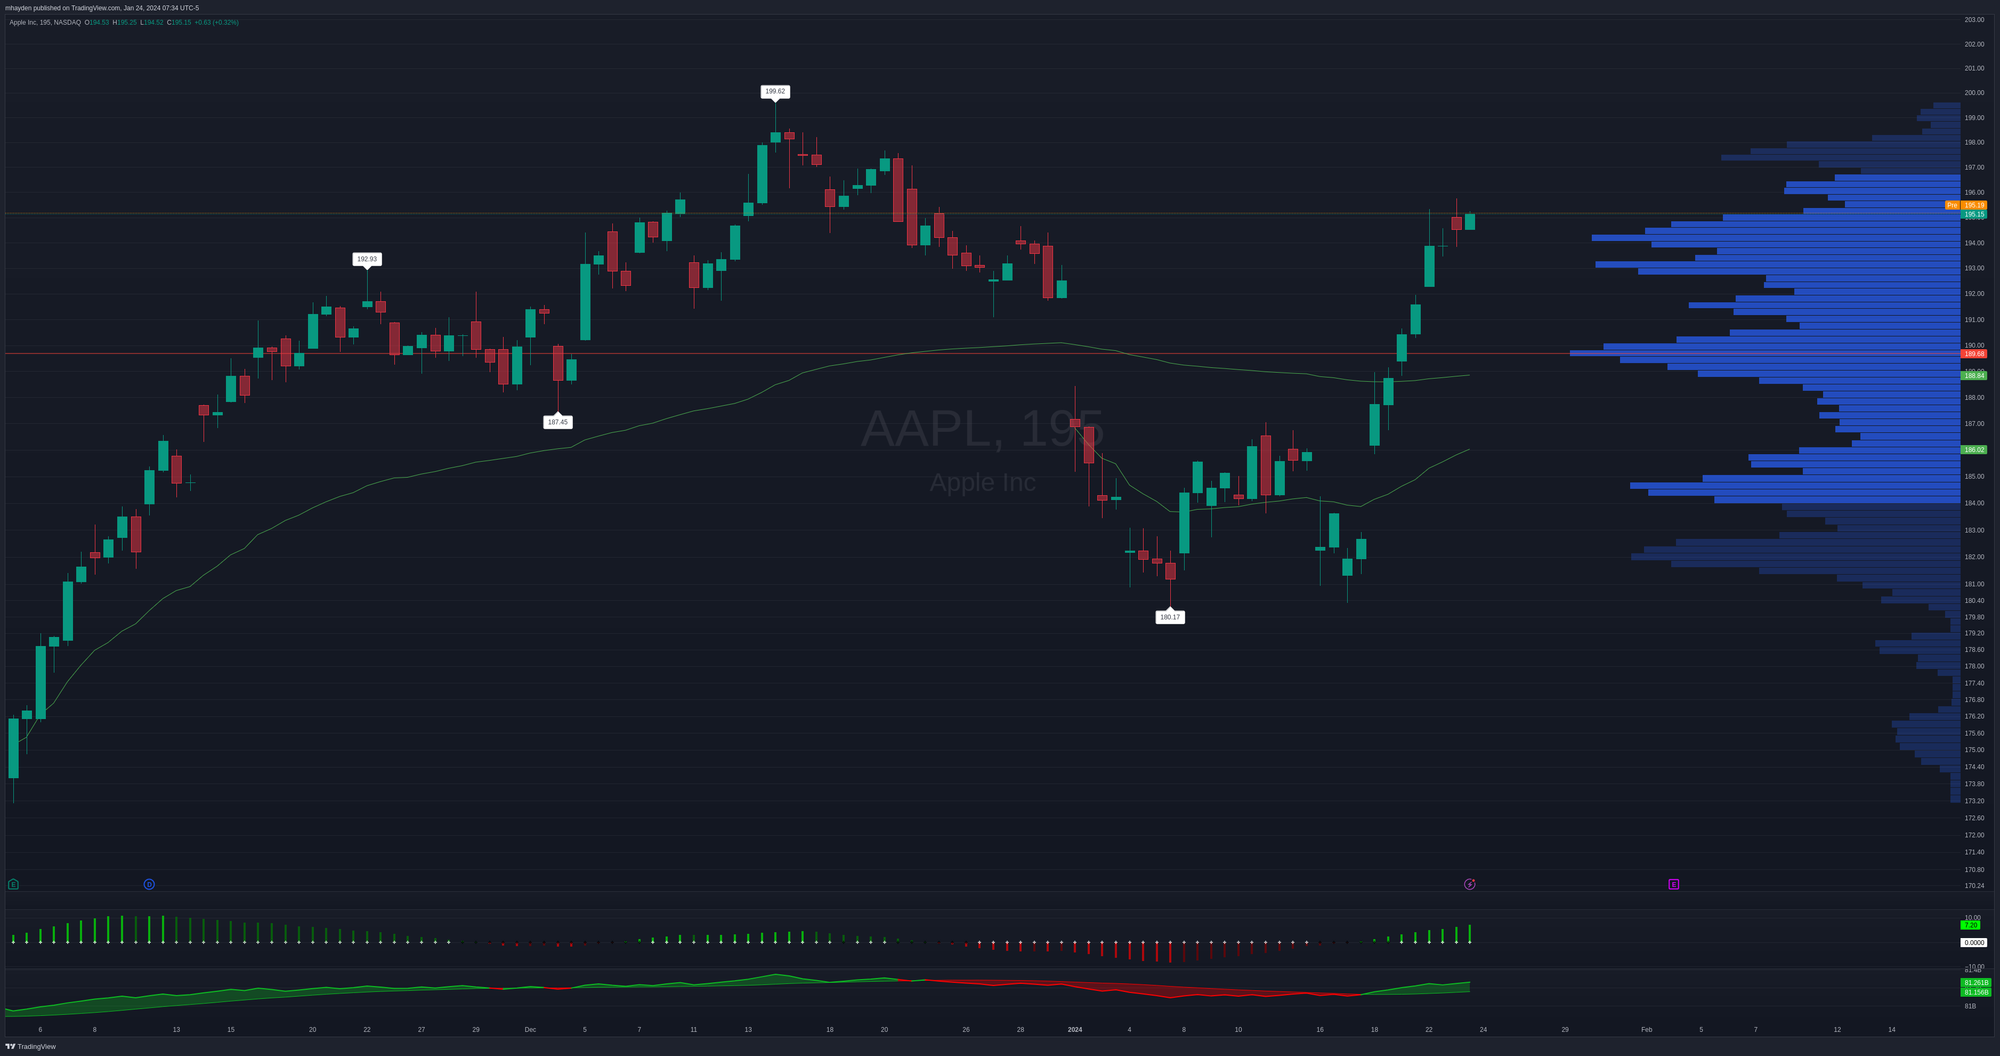
This chart leads me to think there's more risk to the upside since AAPL reclaimed its VWAP lines and volume is increasing with the move up.
Institutional trades
Volume Leaders tracks large trades but it doesn't tell which direction the trades are going. As a reminder, every trade here could be a new long position, a new short position, a moment for profit taking, and added money into existing trades.
Let's start with a default chart since the last earnings call showing the top 10 trades made:
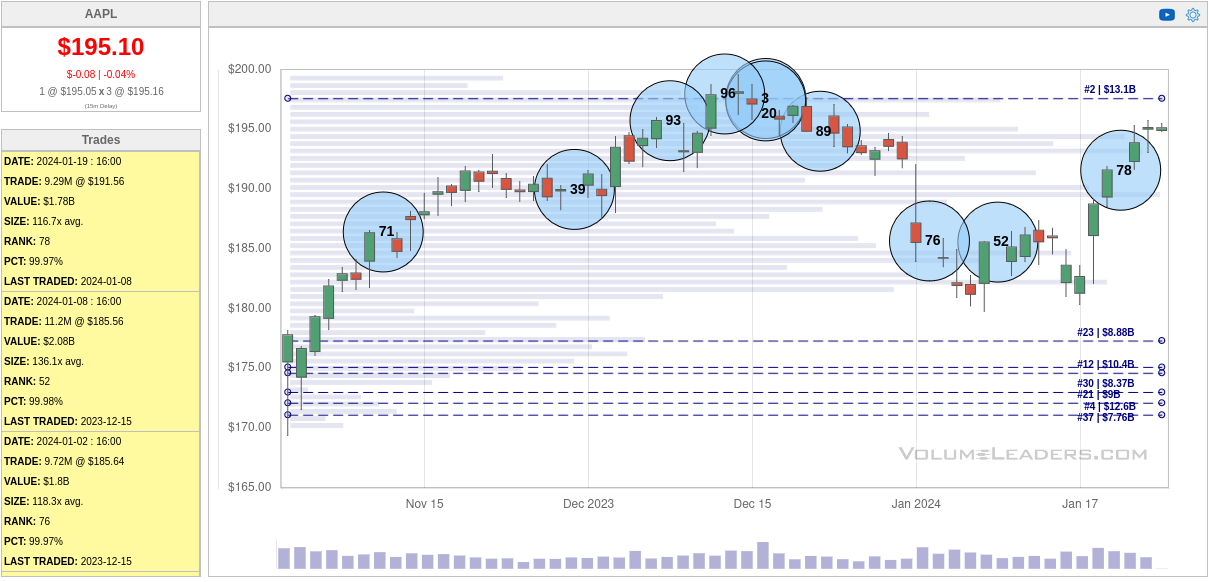
The $195-ish level had plenty of attention from traders, but it's difficult to tell what their bets were. Perhaps they were taking profits or going short. The other level that looks interesting is between $185-$190. There are three big trades in this area and AAPL tends to climb over that level not long after those trades were made. This could be a level for support.
Many of these trades here are market on close orders from ETF re-balancing events. Let's remove those and focus solely on dark pool trades:
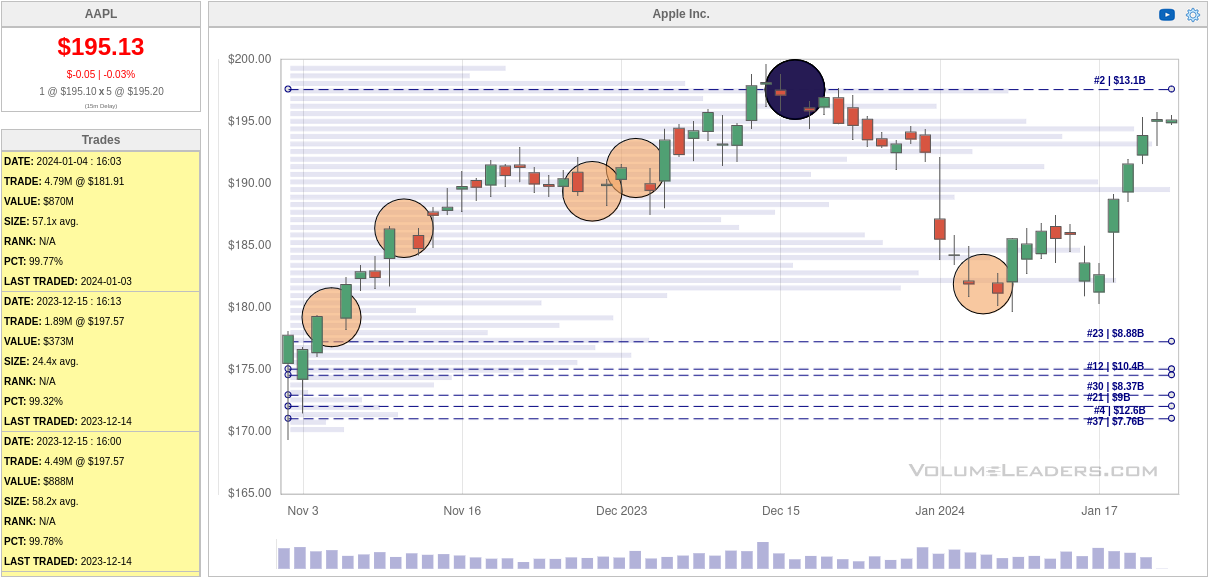
Wow, look at that massive late print hiding up there around $197. There are five trades with almost 20M shares traded at that level. The other orange circles show trades of anywhere from 2M-5M trades. This could prove to be a problem for AAPL climbing over $197 unless the institutional thesis around AAPL changes with earnings.
Thesis
There's no doubt about AAPL's bull run in the long term. It has taken some hits lately with sales challenges and patent issues on their watches. MSFT has also been on AAPL's heels recently as they battle for which company will have the highest market cap in the S&P 500.
AAPL definitely has risk to the upside, but institutions don't seem eager to let it climb to $200 yet. On the downside, I'm looking at some support levels at various places from $180-$190.
I've sold two $185 puts on AAPL expiring March 15th. There wasn't too much premium in these at $2.41 each, but I managed to get some extra premium from rolling puts up from $180. I plan to manage these at 50% profit or roll them up if the deltas become too low.
The trade had a return on risk of 1.32% at 0.23 delta when I put it on the board.
Good luck to everyone today! 🍀
Discussion