Have we reached the last interest rate hike?

It's interest rate decision time! How will the market react? Let's check out the data. 🤓

First and foremost, thanks to both of the people who signed up to support my work financially. It means a lot. I do a lot of research to make my trades and I thought that other people might learn a few things by seeing how my process works. It's far from a perfect process, but we can learn together. 🫂
On the macro side, we're looking at an interest rate decision from the Federal Reserve this afternoon and most seem to think we will get a small hike, perhaps 25 bps, and it might be our last. Either way, consumer sentiment is ticking upwards:

The data also showed that sentiment in the market is also creeping up:

If you've been watching this space recently, you've seen how the service industry is cooling off while manufacturing is coming back. This is great, but we're still struggling with affordability of homes and vehicles:

Auto repossessions are on the rise and this impacts people's ability to work and earn an income. Forbearance programs for auto loans are ending and student loan repayments are starting again for many. I learned quite a bit from Lucky Lopez on this topic and his brief video is worth a watch if you're interested in the auto industry:
Let's get to the nerdy data now! But first:
All investments come with significant risks, including the loss of all capital. Please do your own research before investing, and never risk more than you are willing to lose. I hold no certifications or registrations with any financial entity.
I'll start with a look at the overall market.
Overall market
I like to compare SPX (S&P 500 index) and SPXEW (S&P 500 index if each stock was equally weighted) to see how the market is performing broadly. The RSI (relative strength index) gives us an idea of whether an index or stock is overbought or oversold:
- SPX: 71.33% (14 day RSI)
- SPXEW: 72.17% (14 day RSI)
Anything above 70% is generally thought to be overbought on the RSI scale. For bullish traders, they might argue that there are plenty of buyers in the market and a high RSI shows that there's a lot of buying strength. Bearish traders would argue that the price is running far too hot and needs a correction before buying can start again.
The all-time high for SPX is 4818 and we're sitting at 4567 this morning. 🤷♂️
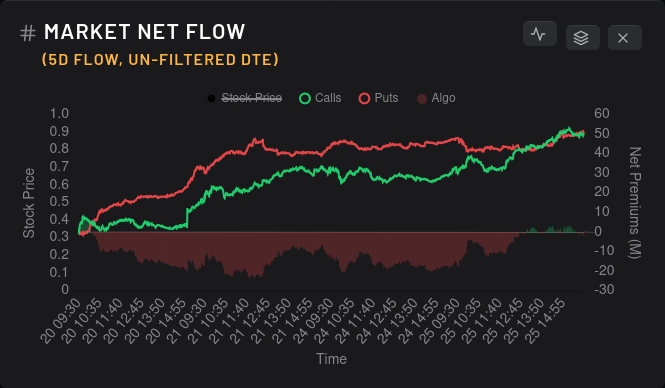
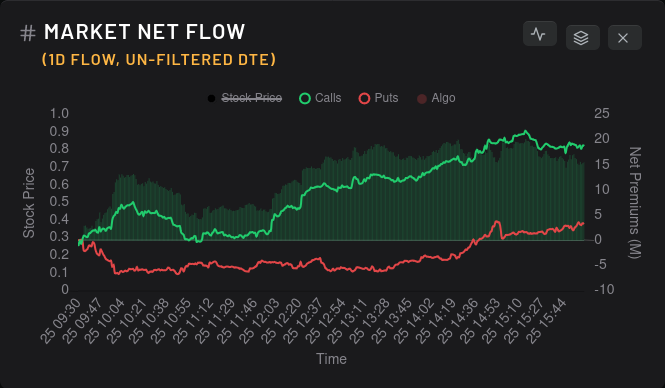
Here's the overall options flow so far over 1 and 5 days. Yesterday looked like a day where everyone was adjusting their bets all day to prepare for the interest rate decision and earnings calls. We're still bullish over a five day period:
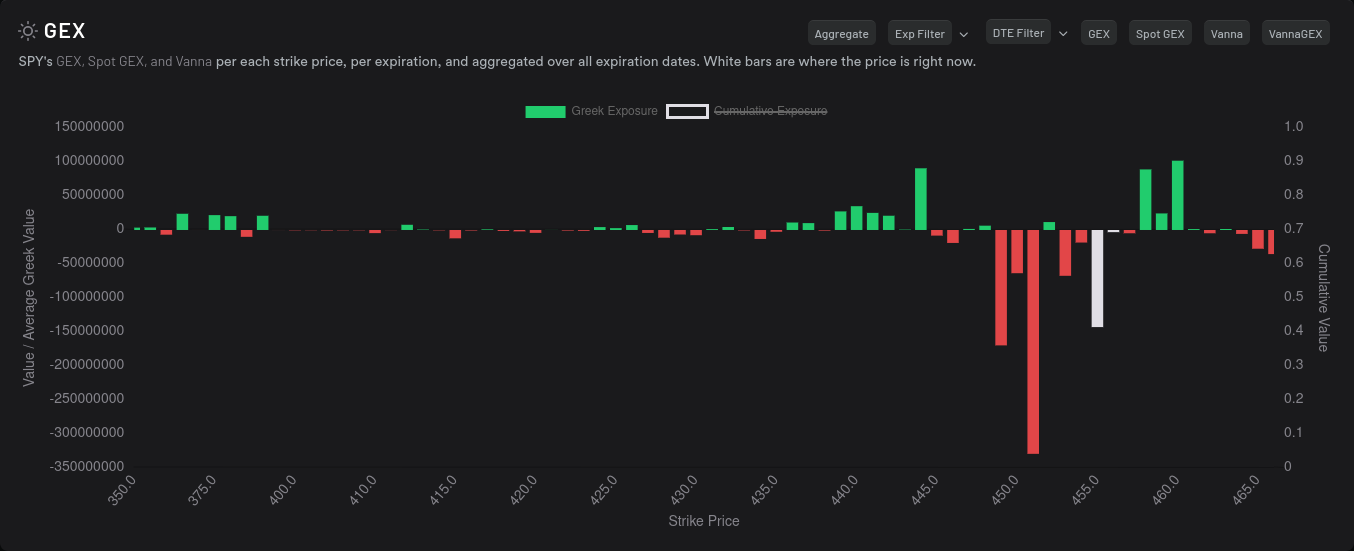
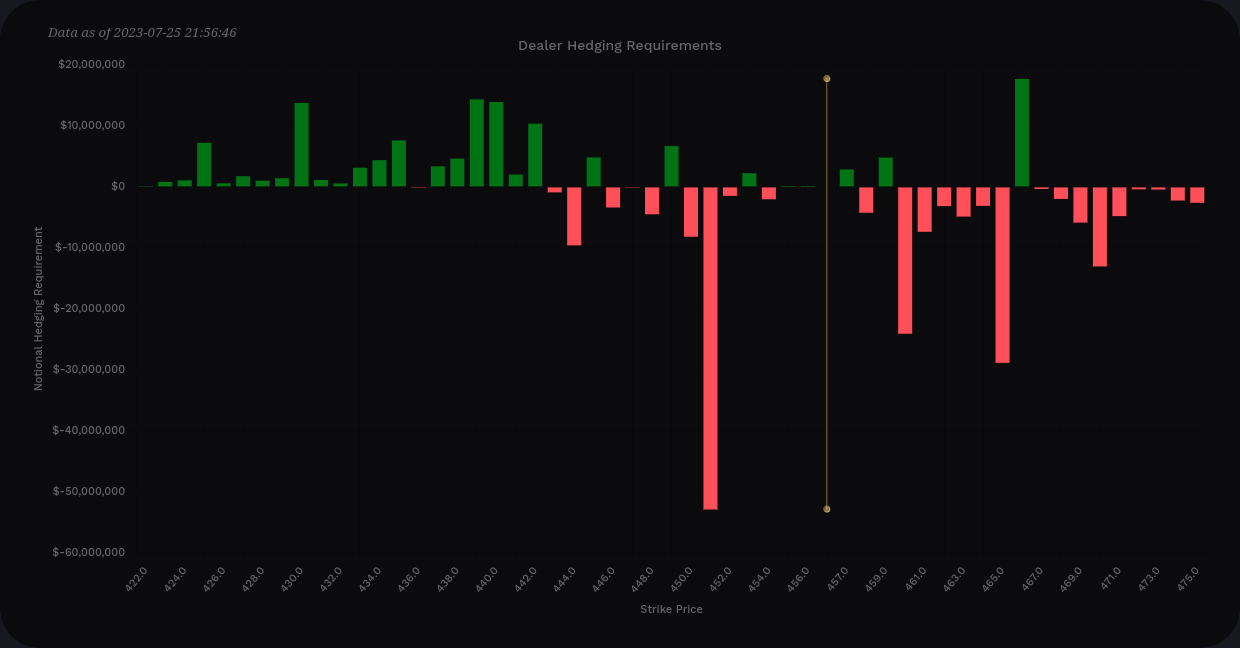
SPY definitely isn't the whole market, but it's often used as a barometer. Our next weekly expiration on 7/28 is showing a potential return to $451 by looking at the most negative spot on the GEX chart. Resistance to price movement shows up at $458 and down at $444:
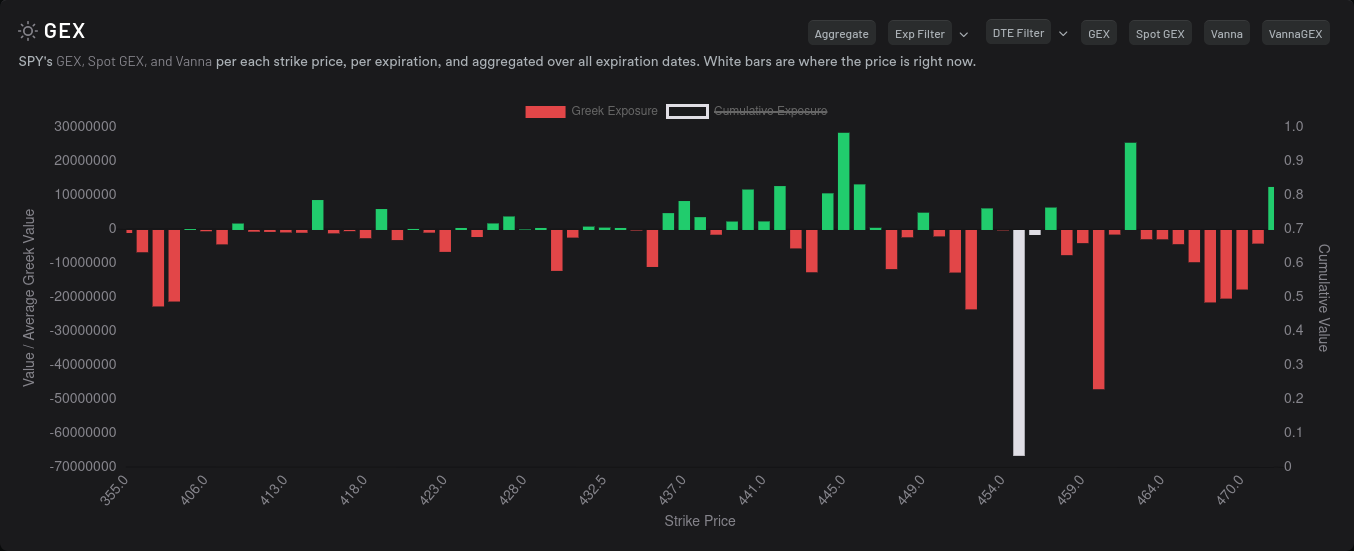
Next week looks like $455 is the largest price magnet and that's where price sits this morning:
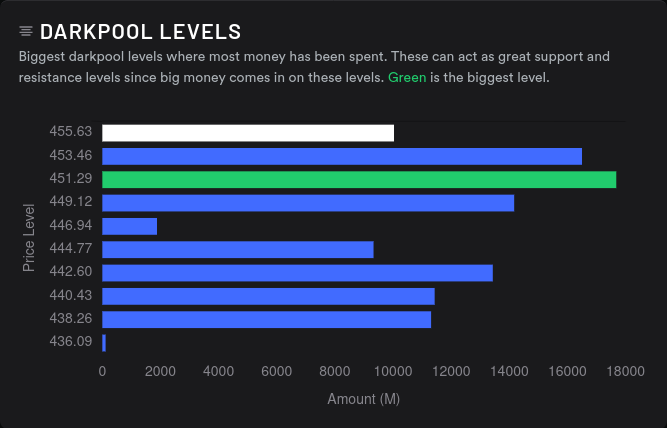
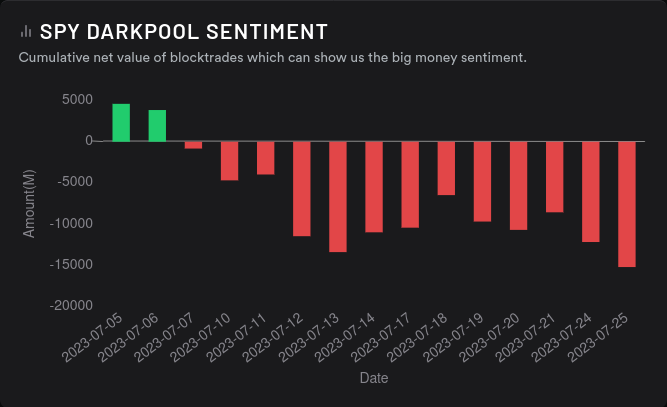
Dark pools for SPY show the highest volume at $451 with a negative sentiment change starting earlier this month:
SPY's vanna chart for 7/28 shows selling pressure down to $451 and the tallest positive bar at $466 is largely canceled out due to several negative bars nearby:
Is a correction coming? Data strongly suggests that we might see a move slightly lower, perhaps to $451.
TSLA
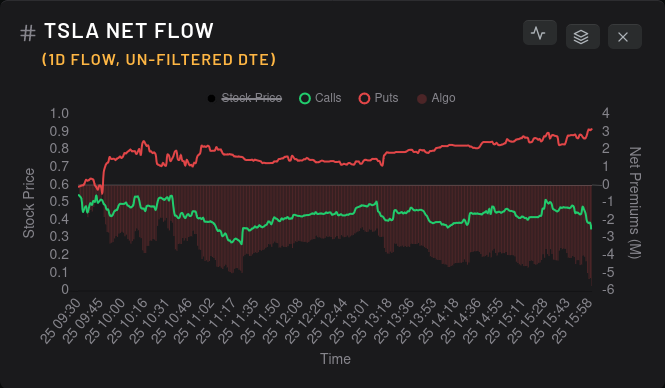
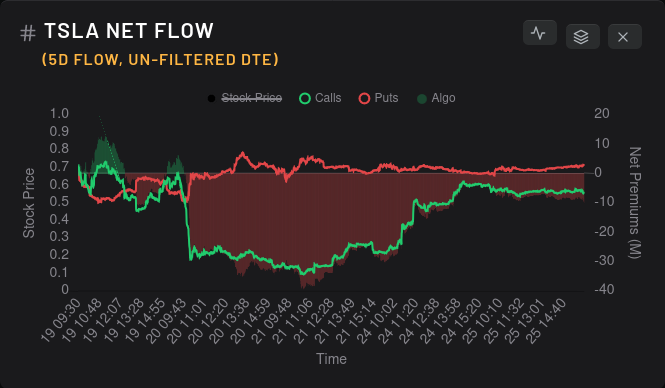
First up, the net flow for TSLA tilts bearish but it's beginning to even out over the last couple of days:
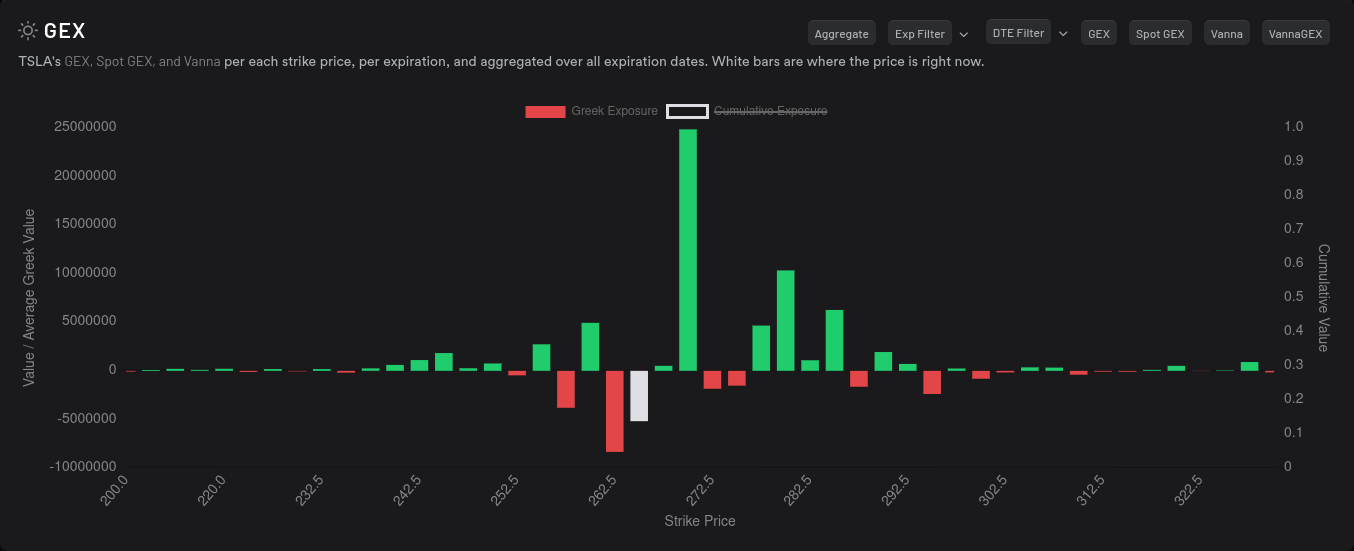
It was incredible to watch TSLA try to break through $270 yesterday and then get pushed back down. The $270 positive GEX level has proven to be really strong for 7/28 and it's not going anywhere yet:
Yesterday's price action on a 5 minute chart was amazing. TSLA fought over $270 after hours on Monday, then was sent back down to the $260's on Tuesday:

Does this cloud at $270 go away for 8/4? Yes, but it spreads out into some other strikes. Next week's GEX levels look much smaller and if TSLA can find a way to stay above $265, there's not much in the way of gamma exposure to keep it from running to $285. The biggest magnet for price is $292.50, but there's plenty of positive gamma nearby to halt that movement:

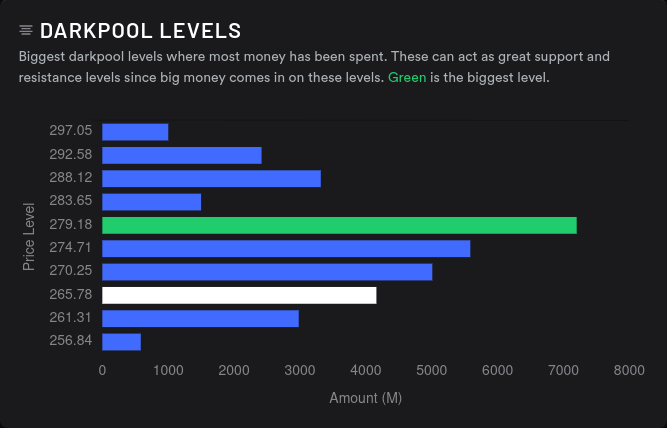
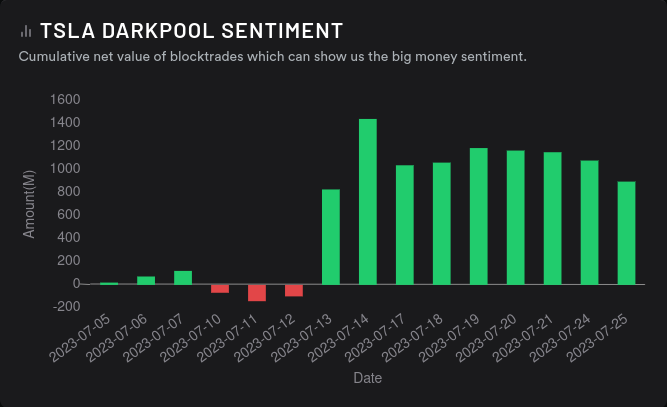
Dark pool volume remains heavy around $280 and TSLA keeps building out that base between $265-$275:
AMD
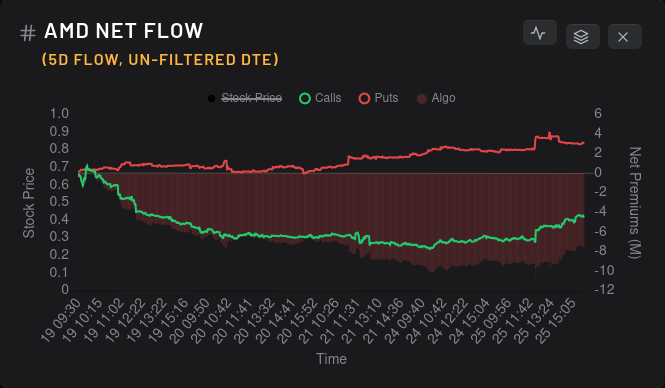
The flow yesterday for AMD was fairly wild, but it's bearish over a 5 day period:
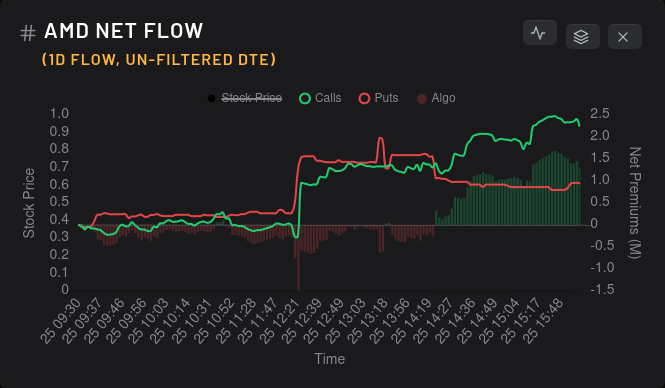
We had strong positive gamma Monday at $113 that restricted price movement, but then that spread across $113 and $114 on Tuesday. As I look at today's GEX chart for 7/28, I'm noticing that the positive gamma there has come down. However, I also notice that we have price magnets in both directions:
- $108 and $111 to the downside
- $121 to the upside (has been strong for days)

Let's try to look for more data about whether $121 or $108/$111 might be in our future.
The $121 level disappears for 8/4. Yikes! Next week's biggest price magnet turns out to be $110, but don't ignore $117 either. $115 is our new level where dealers will resist price movement:

Can we narrow this down futher? Big money options traders are going somewhat bearish on $110 and very bearish $115 on 8/4:

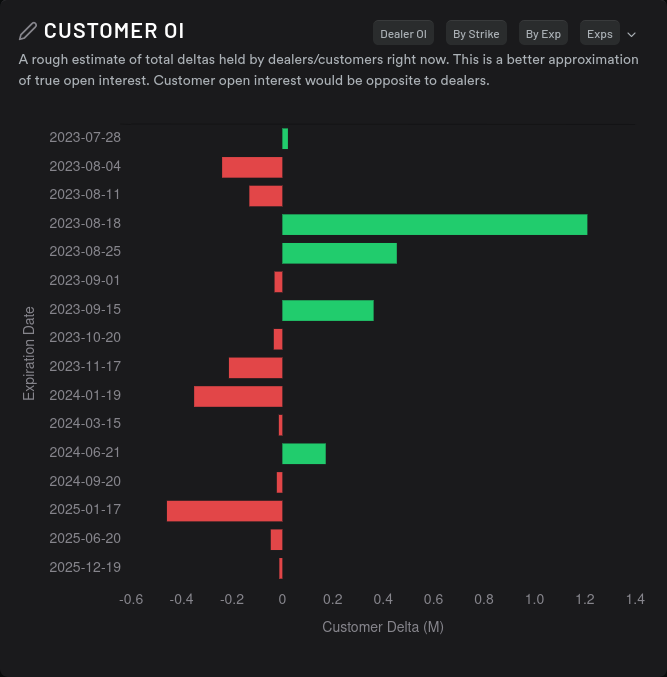
Customer open interest for 8/4 is relatively bearish as well:
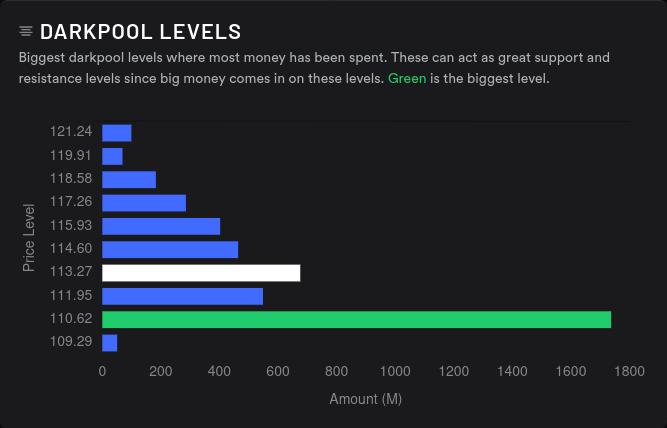
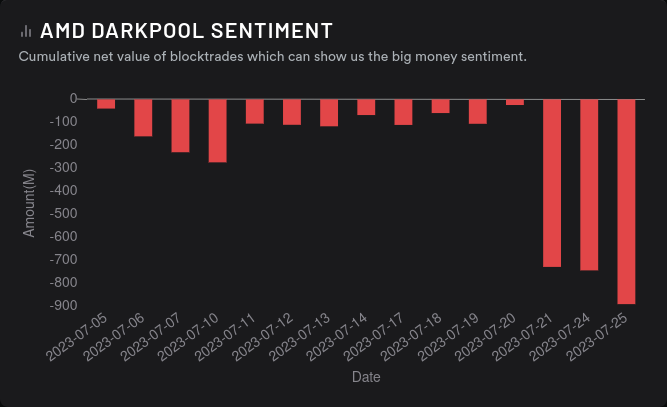
Dark pool data suggests that $110 is still our biggest support level, but sentiment remains strongly negative:
Thesis
For the broad market, I think we might correct a bit and SPY might revisit $451. I rarely ever go long on an options contract, but I bought a $451 put for 8/4 on SPY just to see if I should trust my gut feeling after doing all this research. 😉
TSLA $270 remains a strong resistance point for price at least for this week. For next week, $265 is the barrier, so if we find a way to close above $265 this week, we should be in good shape for more bullish moves next week. If we don't then $265 could become our price barrier next week. I am generally a bullish TSLA trader and I sold a $270 call for 7/28 and a $267.50 call for 8/4.
My portfolio is weighted a bit heavy on AMD going into earnings, so I've been aggressive with covered calls for 7/28 as $113/$114 becomes a difficult level to pass. I really think we might see a retreat to support before or after earnings through 8/4, so I'm making bets on that. I'm okay with assignment on AMD up in this price range since my cost basis is in the mid-$90's.
My trades and trade notes are kept up to date over on my Theta Gang profile. Good luck to everyone today! 🍀
Discussion