META analysis for October 11

META is up almost 65% this year. As it approaches the big $600 level, what are the odds that we will see a continuation of the current rally? 🤔

Happy Friday! Today's post is all about META, or the company formerly known as Facebook. You might say this post is so meta, but it feels a little early for dad jokes. 😜
META gained just under 65% in 2024 so far and it showed up in the 15th spot in today's power scan that I run on StockCharts:
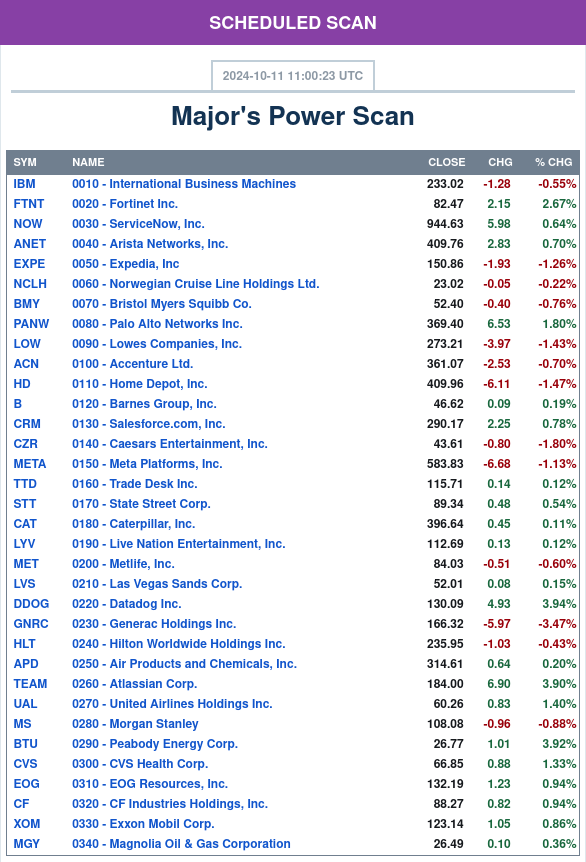
Let's dig into the data to see if this massive rally has good odds of a continuation. But first:
All investments come with significant risks, including the loss of all capital. Please do your own research before investing, and never risk more than you are willing to lose. I hold no certifications or registrations with any financial entity.
Here we go!
Charts
After watching a lot of John Rabil's videos, I've started focusing on measuring trends over different time frames and I have a four-pane setup on TradingView. It's a little busy at first glance, but it gets a little easier over time. You can view this chart on your screen by going directly to the chart on TradingView.
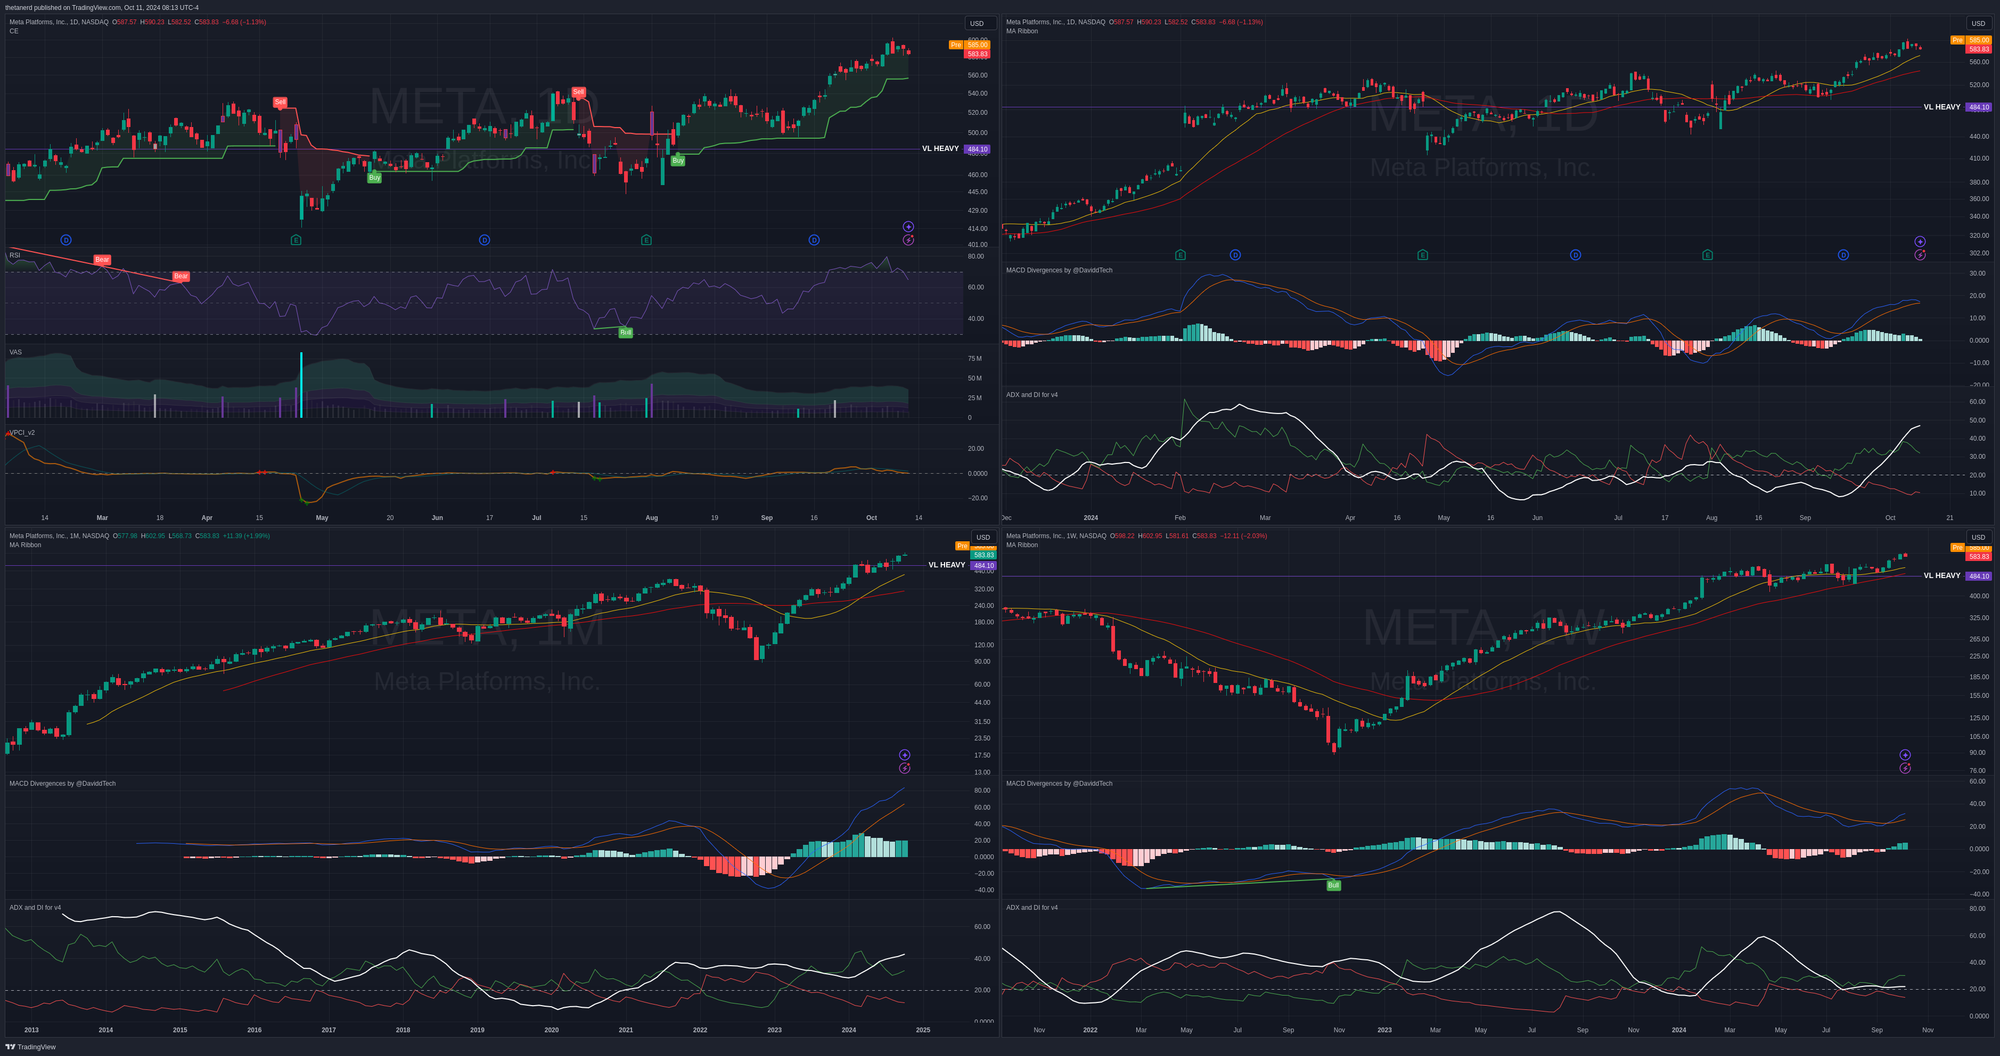
Starting with the top left and going clockwise:
- I have a daily chart with a Chandelier Exit applied (entry/exit based on ATR), followed by RSI, volume analysis, and VPCI (based on Buff Dormeier's work).
- The rest of the charts have MACD and ADX indicators added and they include daily (top right), weekly (bottom right), and monthly (bottom left) time frames.
This really helps me identify if a trend is holding across multiple time frames. Sometimes a very strong trend on a monthly or weekly chart doesn't show up well on a daily chart, or vice versa. I'm a trend follower and I'm looking for charts with decent odds of trend continuation.
Let's start with the daily chart on the top left:
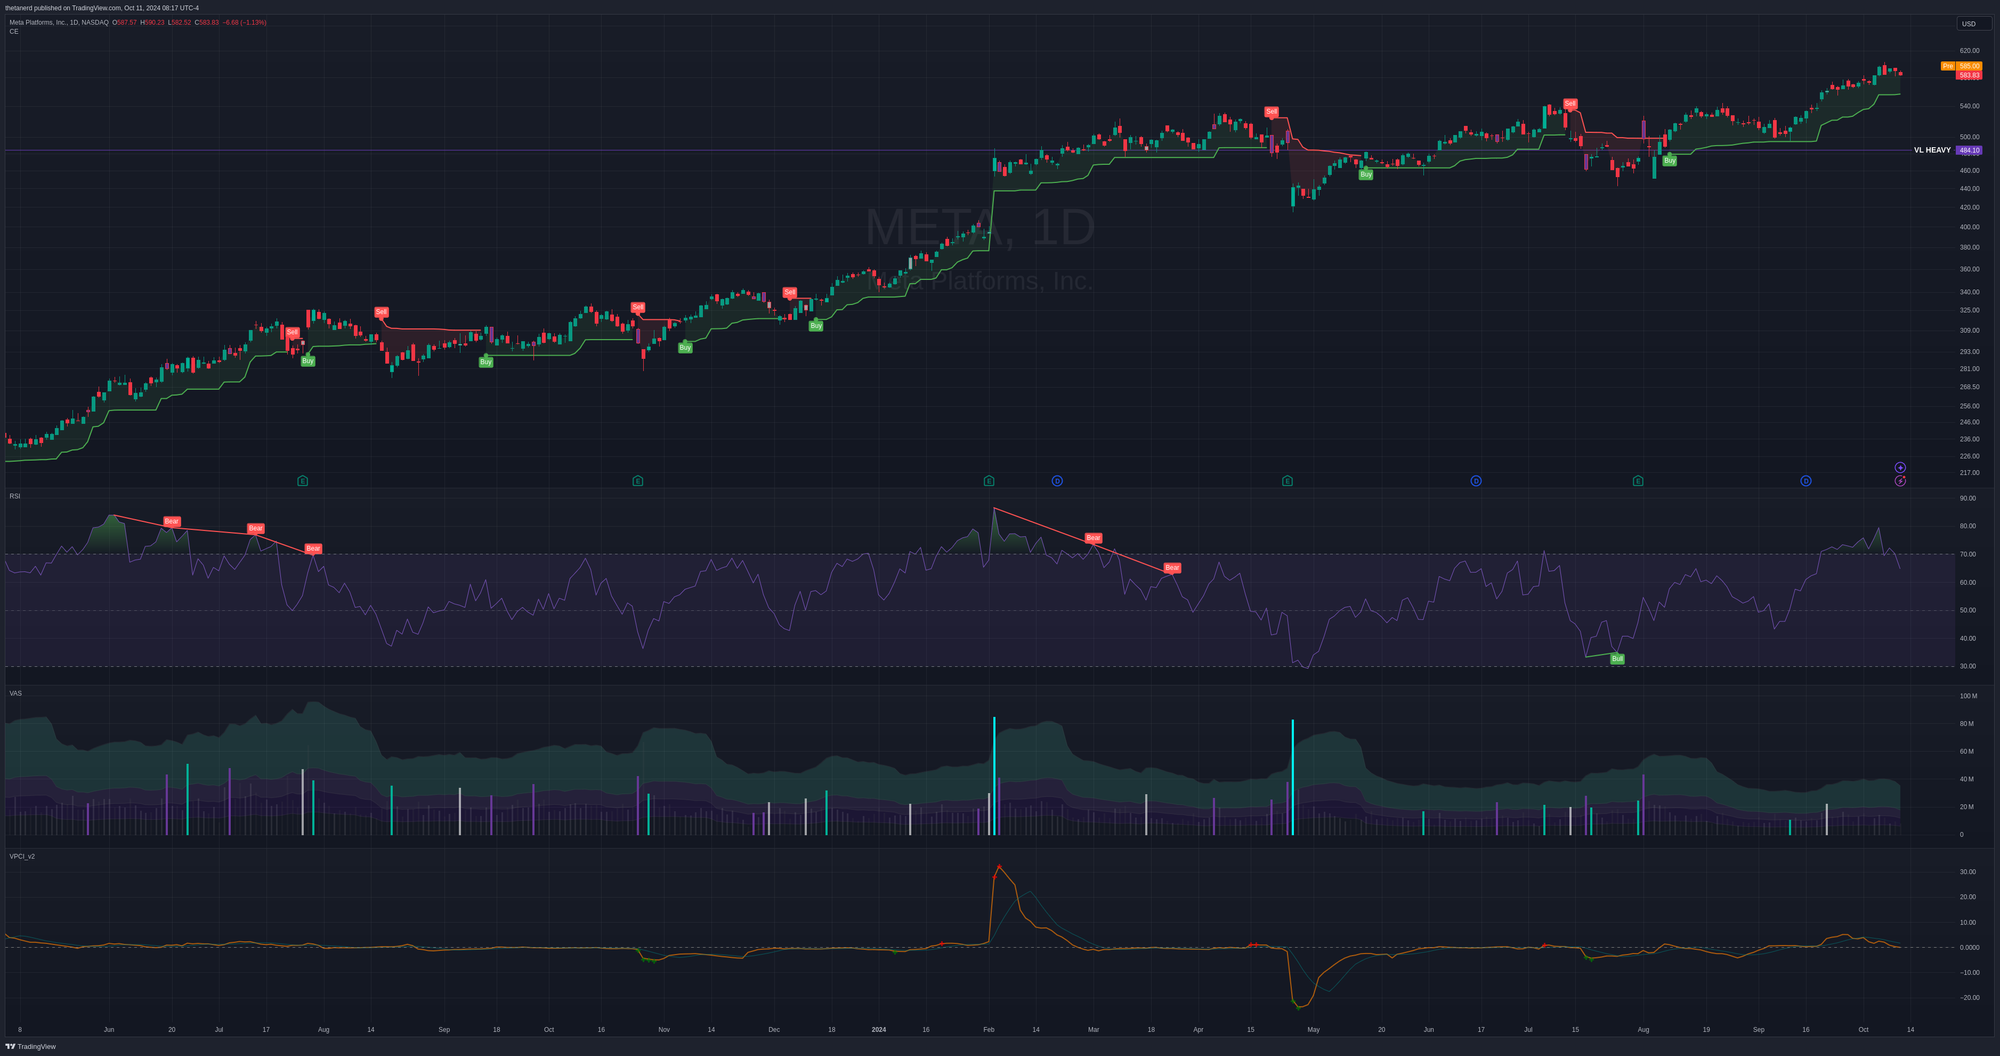
This chart focuses heavily on volume, momentum, and volatility. Starting from the top:
- META has been in a buy zone based on the ATR since early August. It came down to test the bottom of the band in early September and bounced right off of it. The purple VL HEAVY line there is data that I retrieved from Volume Leaders charts where institutional traders were very active in META. This is an area worth watching to see if it becomes a support level.
- RSI is just below and we had a small bullish divergence in July that hinted that something might be coming. The earnings gap up quickly calmed down and price made higher lows as the RSI did the same.
- Volume Analysis is just below RSI and it tracks spikes in volume. Purple is strong bearish volume, cyan is strong bullish volume, and white is strong volume with an unknown direction. It's been fairly quiet since the post-earnings spike.
- Finally, the VPCI indicator sits at the bottom. The orange line is below the signal line which hints that volume is likely not supporting the current move. Buff believes that volume leads price and this indicator is looking for volume changes that might impact price.
I'll skip the daily and monthly for now. Let's examine the weekly chart:
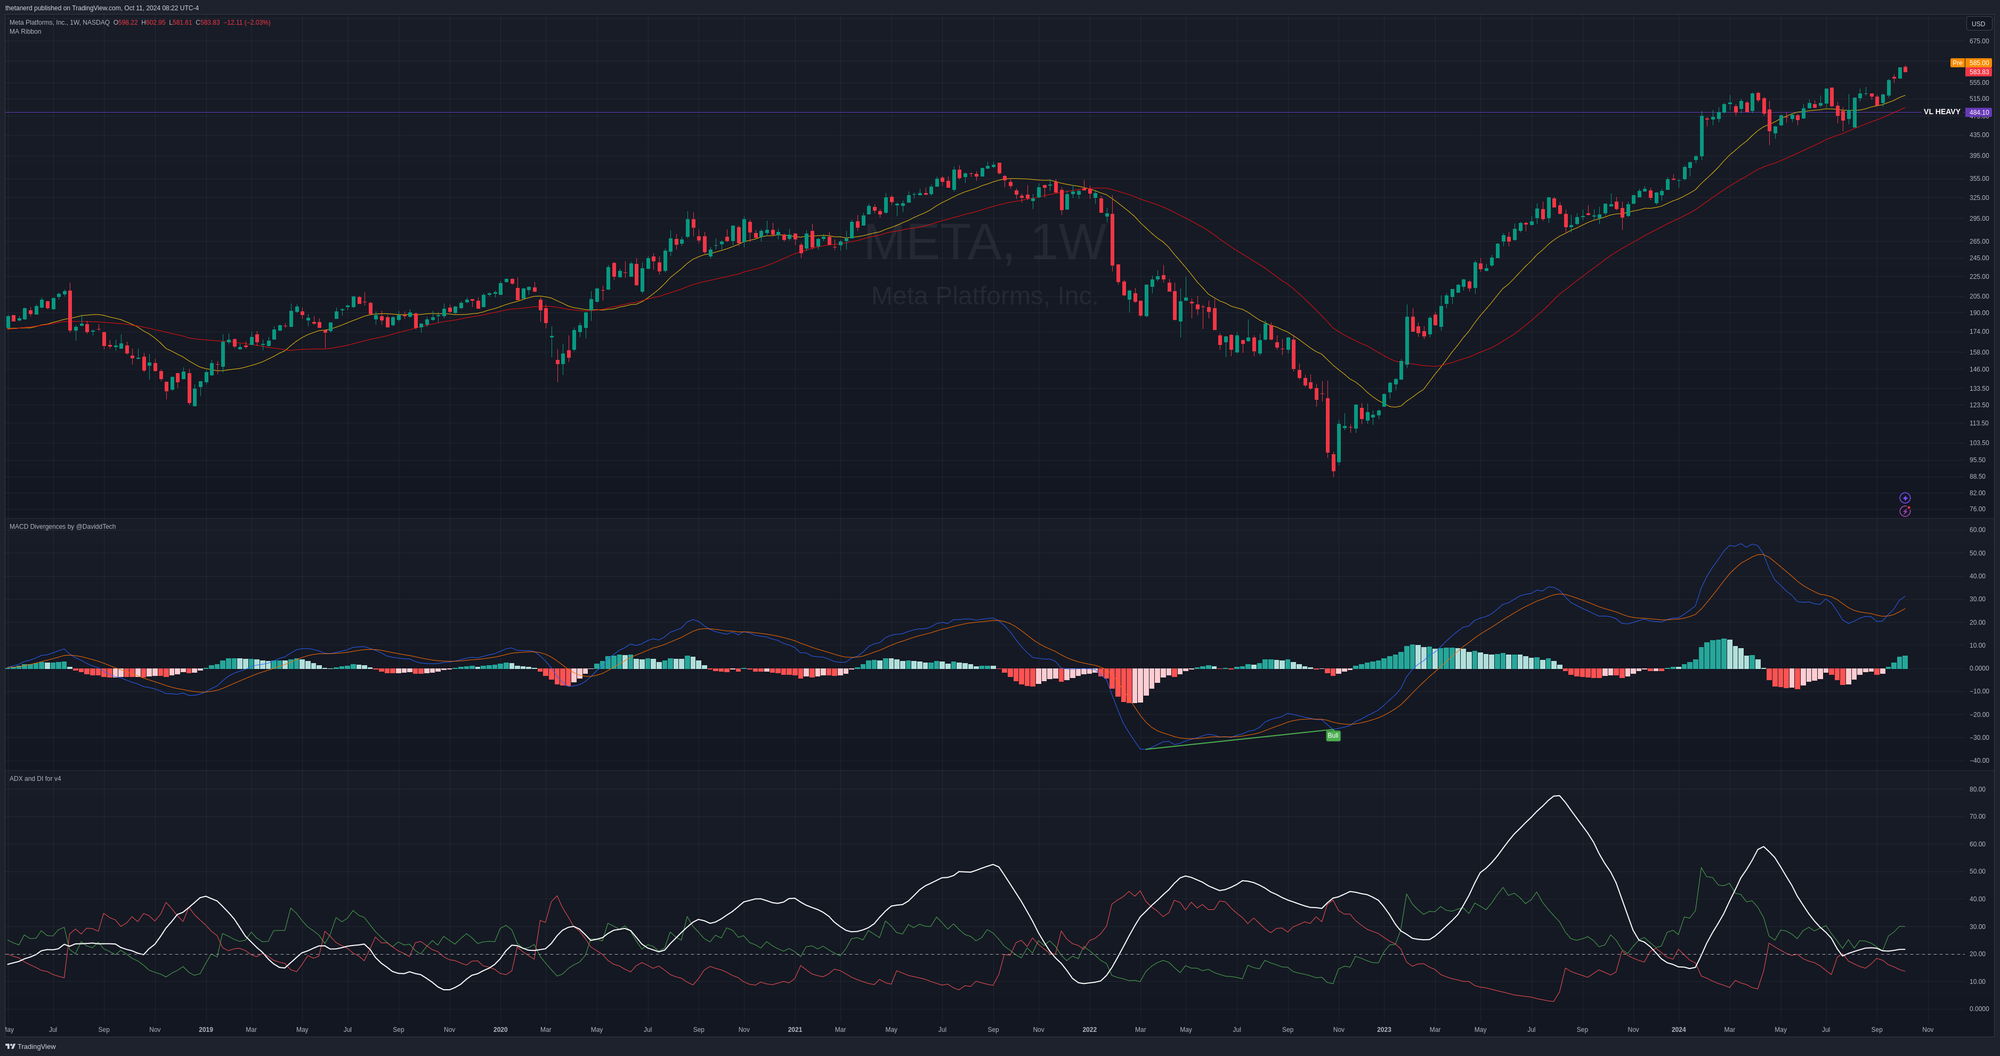
This chart is all about momentum. Let's do this one from top to bottom:
- The moving averages are stacked properly and price is above both right now.
- The MACD line crossed above the signal line recently and is moving away from the signal line with some decent strength. Note the big bullish divergence as META ran to its lows at the end of 2022. 👀 This is an area where multi-timeframe analysis shines.
- Finally, the ADX is at the bottom. I like to see the ADX (white) line above 20 with the green line (buying pressure) above the red line (selling pressure). The trend is strengthening a bit with sellers trailing off. However, buying pressure has flattened out. Combine this with the VPCI indicator earlier and it's a hint that META might need a little time to cool off.
Institutional Volume
Volume Leaders provides some great charts that highlight areas where very large trades are made on various stocks and ETFs. These are often an indication of activity from large institutions that are making big bets or adjusting their holdings. Let's kick things off with a 30 day chart:
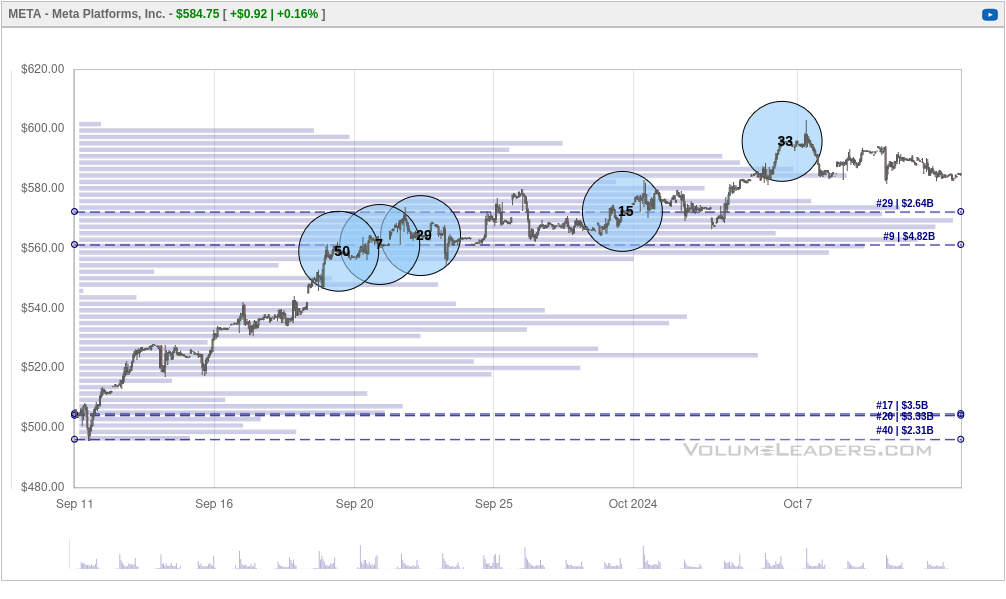
META saw plenty of attention in the $560-$580 range with a #7 trade coming in just over $560. That's the 7th biggest META trade of all time. With that said, the #33 is a bit more interesting. It sits up around $595 and that's very close to META's all time high.
Why is this interesting? This could be a trader taking some profits off the table or potentially going short on META. It's been on a great run so far and the volume has had a little trouble supporting the most recent moves. I'd love to see META come back down to the $560-$570 level for a re-test before moving higher. Traders likely need some time to digest these moves.
#33 could be a long trader adding to their position, but that seems doubtful to me based on the lack of volume in that area.
What if we zoom out to a 365 day view?
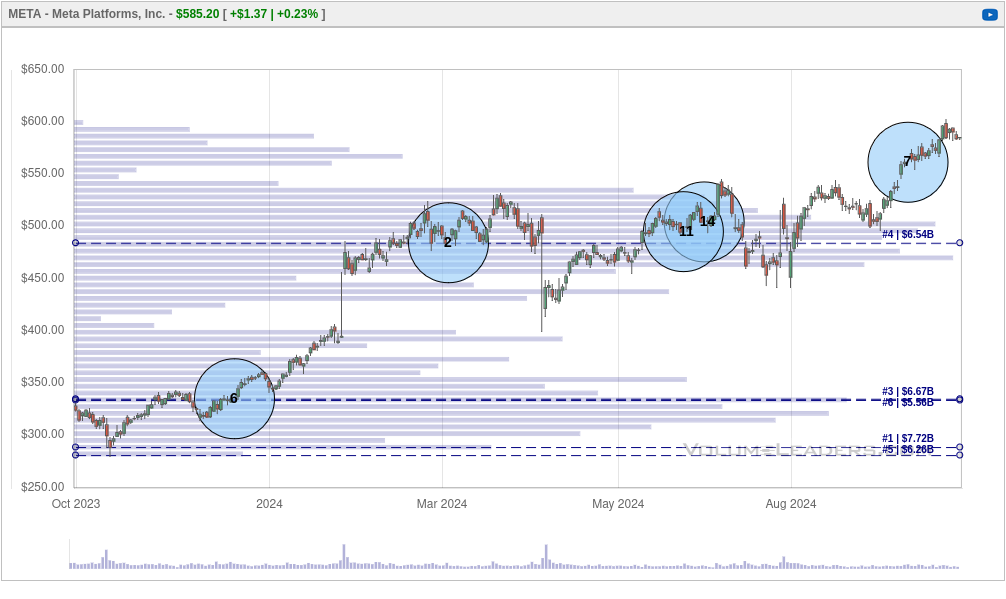
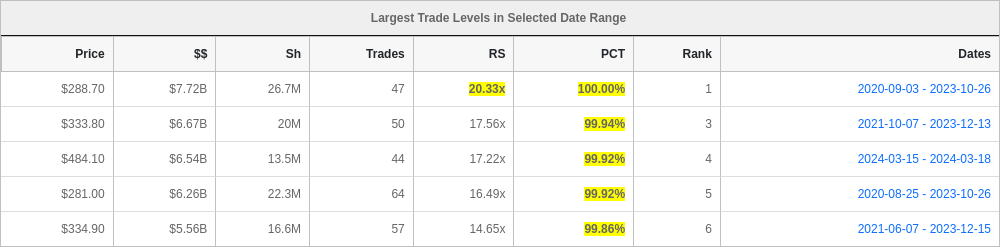
This is where the dashed lines that show the biggest volume levels get interesting. $484 is the nearest big level and that one ranks #4. You can also see that #7 showed up just above a very low volume area.
There's nothing here in the Volume Leaders data that suggests we're heading down aggressively soon, but a re-test of $560-$570 seems reasonable.
Thesis
Mega-cap names have received plenty of attention in 2024 and they've been a driving force behind the S&P 500's returns. META has played a big part in that. However, it's approaching a big psychological level at $600 and traders probably need some time to digest this move before adding more capital.
I don't have any trades on META right now, but I'm looking at selling puts if it drifts back down to $560 and shows signs of consolidation.
Good luck today! 🍀
Discussion